. 2024 May 31;13(5):965-985.
doi: 10.21037/tlcr-24-118. Epub 2024 May 29.

Contribution of crosstalk of mesothelial and tumoral epithelial cells in pleural metastasis of lung cancer

Affiliations

Contribution of crosstalk of mesothelial and tumoral epithelial cells in pleural metastasis of lung cancer

Pei-Heng Li et al. Transl Lung Cancer Res. .

Abstract

Background: Tumor metastasis commonly affects pleura in advanced lung cancer and results in malignant pleural effusion (MPE). MPE is related to poor prognosis, but without systematic investigation on different cell types and their crosstalk at single cell resolution.

Methods: We conducted single-cell RNA-sequencing (scRNA-seq) of lung cancer patients with pleural effusion. Next, our data were integrated with 5 datasets derived from individuals under normal, non-malignant disease and lung carcinomatous conditions. Mesothelial cells were re-clustered and their interactions with epithelial cells were comprehensively analyzed. Taking advantage of inferred ligand-receptor pairs, a prediction model of prognosis was constructed. The co-culture of mesothelial cells and malignant epithelial cells in vitro and RNA-seq was performed. Epidermal growth factor receptor (EGFR) antagonist cetuximab was utilized to prevent the lung cancer cells' invasiveness. Spatial distribution of cells in lung adenocarcinoma patients' samples were also analyzed to validate our findings.

Results: The most distinctive transcriptome profiles between tumor and control were revealed in mesothelial cells, which is the predominate cell type of pleura. Five subtypes were divided, including one predominately identified in MPE which was characterized by enriched cancer-related pathways (e.g., cell migration) along evolutionary trajectory from normal mesothelial cells. Cancer-associated mesothelial cells (CAMCs) exhibited varied interactions with different subtypes of malignant epithelial cells, and multiple ligands/receptors exhibited significant correlation with poor prognosis. Experimentally, mesothelial cells can increase the migration ability of lung cancer cells through co-culturing. EGFR was the only affected gene in cancer cells that exhibited interaction with mesothelial cells and was associated with poor prognosis. Using EGFR antagonist cetuximab prevented the lung cancer cells' increased invasiveness caused by mesothelial cells. Moreover, epithelial mitogen (EPGN)-EGFR interaction was supported through spatial distribution analysis, revealing the significant proximity between EPGN+ mesothelial cells and EGFR+ epithelial cells.

Conclusions: Our findings highlighted the important role of mesothelial cells and their interactions with cancer cells in pleural metastasis of lung cancer, providing potential targets for treatment.

Keywords: Epidermal growth factor receptor (EGFR); epithelial mitogen (EPGN); mesothelial cells; pleural metastasis; single-cell dataset.


Conflict of interest statement

Conflicts of Interest: All authors have completed the ICMJE uniform disclosure form (available at https://tlcr.amegroups.com/article/view/10.21037/tlcr-24-118/coif). The authors have no conflicts of interest to declare.

Figures
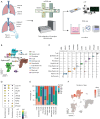
Figure 1
Figure 1
Landscape of tumor microenvironment in lung cancer using integrated scRNA-seq data. (A) Overview of the experiment procedure. scRNA-seq of LUAD patients and publicly available dataset were integrated. In total, 202,449 cells of 46 samples were analyzed. Subsequently, the co-culture of mesothelial cells and epithelial cells in vitro, as well as RNA-seq of both cell types were conducted. mIF of patients’ samples derived from lung adenocarcinoma invading pleural were analyzed. (B) UMAP plots of a total of 202,449 cells, which are divided into 10 major cellular components (T cells, myeloid cells, fibroblasts, B cells, epithelial cells, mesothelial cells, endothelial cells, plasma cells, mast cells, and erythrocytes). (C) Violin plots showing the expression levels of the cellular components-specific markers. (D) The dot plots displaying the marker genes distinguishing mesothelial cells, fibroblasts and epithelial cells. (E) The proportions of sampling sites of the 10 major cellular components. (F) The number of DEGs of each cellular components between (PT and PE samples) and normal (NL, Adj, and NP samples) subtypes. LUAD, lung adenocarcinoma; NL, normal lung tissue; Adj, lung tissues adjacent to tumor; NP, normal pleural; PT, primary lung tumors; PE, pleural effusions; mIF, multiplexed immunofluorescence; UMAP, uniform manifold approximation and projection; DEGs, differentially expressed genes.
Figure 2
Figure 2
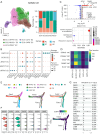
The re-cluster of mesothelial cells from different disease status. (A) Left: UMAP plots of 6,807 mesothelial cells derived from normal, cancer and NMD status, which are divided in to 5 clusters. Right: the proportions of cells derived from different disease status in each cluster. (B) Dot plot displaying the highly expressed genes in each cluster. (C) GO enrichment analysis of increased DEGs in CEMIP+ MC. (D) GO enrichment analysis of increased DEGs in CCL2+ MC. MC, mesothelial cells; UMAP, uniform manifold approximation and projection; NMD, non-malignant disease; ITLN1, intelectin 1; CEMIP, cell migration inducing hyaluronidase 1; CCL2, C-C motif chemokine ligand 2; YWHAH, tyrosine 3-monooxygenase/tryptophan 5-monooxygenase activation protein eta; CRIP1, cysteine rich protein 1; EZR, ezrin; PLEC, plectin; STMN1, stathmin 1; SAA1, serum amyloid A1; EGFL6, epidermal growth factor like domain multiple 6; IGFBP7, insulin like growth factor binding protein 7; NEAT1, nuclear paraspeckle assembly transcript 1; CXCL1, C-X-C motif chemokine ligand 1; LGALS1, galectin 1; HMGB, high mobility group box; GO, gene ontology; DEG, differentially expressed genes; BP, biological process; CC, cellular component; MF, molecular function.
Figure 3
Figure 3
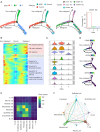
The identification of cancer-associated mesothelial cells. (A) Cell trajectory analysis of mesothelial cells demonstrated distinct transition paths from normal conditions to malignant diseases and NMDs. Left: 3 states were identified on the trajectory. Middle: the subtypes of cells were shown on the trajectory. Right: the cluster of mesothelial cells were displayed on the trajectory. Meanwhile, the distribution of CEMIP+ MC in the 3 states of the trajectory was also shown. (B) Heatmap showing the expression changes of the highly variable genes along the two distinct trajectory paths. Enriched pathways were displayed on the right side of the heatmap. (C) Violin plots displaying the expression levels of CAV1, CCL2, MIF, CXCL1, CEMIP, EPGN, ITGA3, TGFB1, and WNT2 in different states of the trajectory. (D) Up: the expression of CEMIP along the trajectory path; middle: the expression of EPGN along the trajectory path; low: the expression of WNT2 along the trajectory path. (E) The mutual interactions between the major cellular components in pleural effusion were inferred by CellphoneDB. (F) The mutual interactions between the major cellular components in pleural effusion were inferred by CellChat. The arrow and edge color indicated direction. Edge thickness indicated the number of interactions. The loops indicate autocrine circuits. NMD, non-malignant disease; MC, mesothelial cells; CEMIP, cell migration inducing hyaluronidase 1; CAV1, caveolin 1; CCL2, C-C motif chemokine ligand 2; CXCL1, C-X-C motif chemokine ligand 1; MIF, macrophage migration inhibitory factor; ITGA3, integrin subunit alpha 3; EPGN, epithelial mitogen; WNT2, Wnt family member 2; TGFB1, transforming growth factor beta 1.
Figure 4
Figure 4
The interaction between mesothelial cells and epithelial cells in tumor microenvironment. (A) UMAP plots of epithelial cells, which are divided in to 5 clusters. Right: the proportions of cells derived from different samples in each cluster. (B) Dot plot displaying the highly expressed genes in each cluster. (C) Up: volcano plot displaying the DEGs between MUC21+ EC and other clusters of EC. Low: GO enrichment analysis of increased DEGs in MUC21+ epithelial cells. (D) The mutual interactions between the clusters of epithelial cells and mesothelial cells inferred by CellphoneDB. (E) Cell trajectory analysis of epithelial cells demonstrated 2 transition paths from normal subtypes. Left: 5 states were identified on the trajectory. Middle: the cluster of cells were shown on the trajectory. Right: the sampling sites of epithelial cells were displayed on the trajectory. (F) Left: violin plots displaying the expression levels of EGFR, HIF1A, MUC21, NAXE, ALDOA, CAPS and GPX1 in different states of the trajectory. Right: the expression of EGFR along the trajectory path. (G) Candidate genes from ligand-receptor pairs between CEMIP+ MC and MUC21+ EC were selected. Univariate cox regression analysis of selected genes regarding OS in the TCGA-LUAD cohort was performed. 21 genes significantly related to prognosis were displayed (P<0.05). EC, epithelial cells; DEGs, differentially expressed genes; UMAP, uniform manifold approximation and projection; NL, normal lung tissue; Adj, lung tissues adjacent to tumor; PT, primary lung tumors; PE, pleural effusions; SFTPC, surfactant associated protein C; MUC21, mucin 21; ZFAS1, ZNFX1 antisense RNA 1; CCT5, chaperonin containing TCP1 subunit 5; CAPS, capricious; LCN2, lipocalin 2; FAM3C, FAM3 metabolism regulating signaling molecule C; SOX4, SRY-box transcription factor 4; EGFR, epidermal growth factor receptor; HIF1A, hypoxia inducible factor 1 subunit alpha; NAXE, NAD(P)HX epimerase; ALDOA, aldolase, fructose-bisphosphate A; GPX1, glutathione peroxidase 1; CEMIP, cell migration inducing hyaluronidase 1; CEACAM5, carcinoembryonic antigen cell adhesion molecule 5; OS, overall survival; FC, fold change.
Figure 5
Figure 5
A Prediction model constructed based on the interaction genes between CAMCs and epithelial cells. (A) The enrichment scores of 21 interaction genes in late-stage samples (stage III and IV) compared to early-stage samples (stage I and II) from TCGA-LUAD cohort were displayed; (B) the survival curve of the enrichment score in early-stage patients; (C) the survival curve of the enrichment score in late-stage patients; (D) the AUC of 3-year OS on the validation cohort based on Random Forest models constructed by 21 candidate genes and clinical information; (E) DeLong’s test was also performed to provide a quantitative comparison between the TNM stage and the prediction model (P=0.001). CAMCs, cancer-associated mesothelial cells; TCGA, The Cancer Genome Atlas; LUAD, lung adenocarcinoma; AUC, area under the curve; OS, overall survival.
Figure 6
Figure 6
EPGN-EGFR appears as a vital ligand-receptor between CAMCs and epithelial cells in TME. (A) The experimental protocol of mesothelial cells and malignant epithelial cells’ co-culture and subsequent RNA sequencing. (B) GO enrichment analysis of increased DEGs in co-culture groups of mesothelial cells. (C) GO enrichment analysis of increased DEGs in co-culture groups of epithelial cells. (D) The Venn diagram of the increased DEGs in epithelial cells after co-culturing with mesothelial cells (RNA-seq), the potential ligand/receptors between mesothelial cells and epithelial cells identified by CellphoneDB, and interaction genes related to prognosis (prognosis). EGFR was identified. (E) The expression level of EGFR in epithelial cells before and after co-culturing with mesothelial cells. (F) The survival curve of the EGFR expression in TCGA-LUAD patients without EGFR mutations. (G) Up: the illustration of invasion assay of A549 cells co-culturing with mesothelial cells. Scale bar: 100 µm. Staining: crystal violet. Middle: upper left: cetuximab; upper right: control. Lower left: cetuximab + mesothelial cells; lower right: mesothelial cells. Low: the area of cells/area of the filed in different groups. (H) Multiplexed immunofluorescence staining of PANCK, calretinin, EPGN, and EGFR in samples of lung adenocarcinoma invading the pleura. Upper left: scale bar: 20 µm. Lower left: immunofluorescence staining of individual markers including PANCK, calretinin, EPGN, and EGFR, scale bar: 20 µm. Upper right: the distance between EGFR+ epithelial cells and mesothelial cells (EPGN vs. EPGN+) of 5 tissue samples. Lower right: the distributions of the distance between mesothelial cells (EPGN vs. EPGN+) and EGFR+ epithelial cells, respectively (within 100 µm). *, P<0.05; ***, P<0.001. GO, gene ontology; DEGs, differentially expressed genes; PANCK, pan-cytokeratin; EPGN, epithelial mitogen; EGFR, epidermal growth factor receptor; CAMC, cancer-associated mesothelial cell; TCGA, The Cancer Genome Atlas; LUAD, lung adenocarcinoma; TME, tumor microenvironment.

Similar articles

Cited by

References

    1. Tsou PH, Chiang PH, Lin ZT, et al. Rapid purification of lung cancer cells in pleural effusion through spiral microfluidic channels for diagnosis improvement. Lab Chip 2020;20:4007-15. 10.1039/d0lc00663g - DOI - PubMed
    1. Stathopoulos GT, Kalomenidis I. Malignant pleural effusion: tumor-host interactions unleashed. Am J Respir Crit Care Med 2012;186:487-92. 10.1164/rccm.201203-0465PP - DOI - PMC - PubMed
    1. Sung H, Ferlay J, Siegel RL, et al. Global Cancer Statistics 2020: GLOBOCAN Estimates of Incidence and Mortality Worldwide for 36 Cancers in 185 Countries. CA Cancer J Clin 2021;71:209-49. 10.3322/caac.21660 - DOI - PubMed
    1. Xia C, Dong X, Li H, et al. Cancer statistics in China and United States, 2022: profiles, trends, and determinants. Chin Med J (Engl) 2022;135:584-90. 10.1097/CM9.0000000000002108 - DOI - PMC - PubMed
    1. Luo L, Deng S, Tang W, et al. Recruitment of IL-1β-producing intermediate monocytes enhanced by C5a contributes to the development of malignant pleural effusion. Thorac Cancer 2022;13:811-23. 10.1111/1759-7714.14324 - DOI - PMC - PubMed