. 2024 May 29:39:427-442.
doi: 10.1016/j.bioactmat.2024.05.036. eCollection 2024 Sep.

Senescence-targeted MicroRNA/Organoid composite hydrogel repair cartilage defect and prevention joint degeneration via improved chondrocyte homeostasis

Affiliations

Senescence-targeted MicroRNA/Organoid composite hydrogel repair cartilage defect and prevention joint degeneration via improved chondrocyte homeostasis

Ye Sun et al. Bioact Mater. .

Abstract

Introduction: Cartilage defect (CD) is a common complication in osteoarthritis (OA). Impairment of chondrogenesis and cellular senescence are considered as hallmarks of OA development and caused failure of cartilage repair in most clinical CD cases. Exploring markers for cellular senescence in CD patients might provide new perspectives for osteoarthritic CD patients. In the present study, we aim to explore senescent markers in CD patients with OA to fabricate a senescence-targeted SMSC organoid hydrogel for cartilage repair.

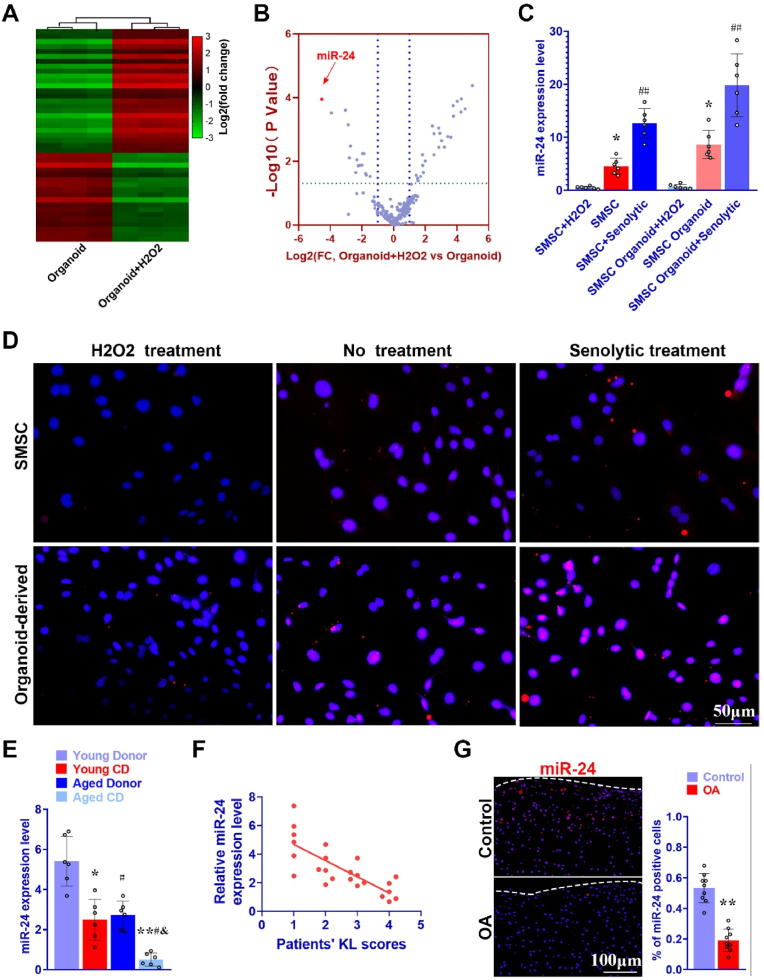
Methods: Clinical cartilage samples from cartilage defect patients were collected. Immunofluorescence staining of senescent markers and SA-β-Gal staining were used to detect the senescence state of SMSCs and chondrocytes in cartilage defect and OA patients. MicroRNA expression profiles of SMSC organoids and H2O2-treated SMSC organoids were analyzed and compared with high-throughput microRNA sequencing. Fluorescent in situ hybridization of miRNA were used to determine the expression level of miR-24 in SMSC organoids and cartilage samples. Interaction between miR-24 and its downstream target was analyzed via qRT-PCR, immunofluorescence and luciferase assay. Senescence-targeted miR-24 μS/SMSC organoid hydrogel (MSOH) was constructed for cartilage repair. Anti-senescence properties and chondrogenesis were determined in vitro for MSOH. Rats were used to evaluate the cartilage repair capacity of the MSOH hydrogel in vivo.

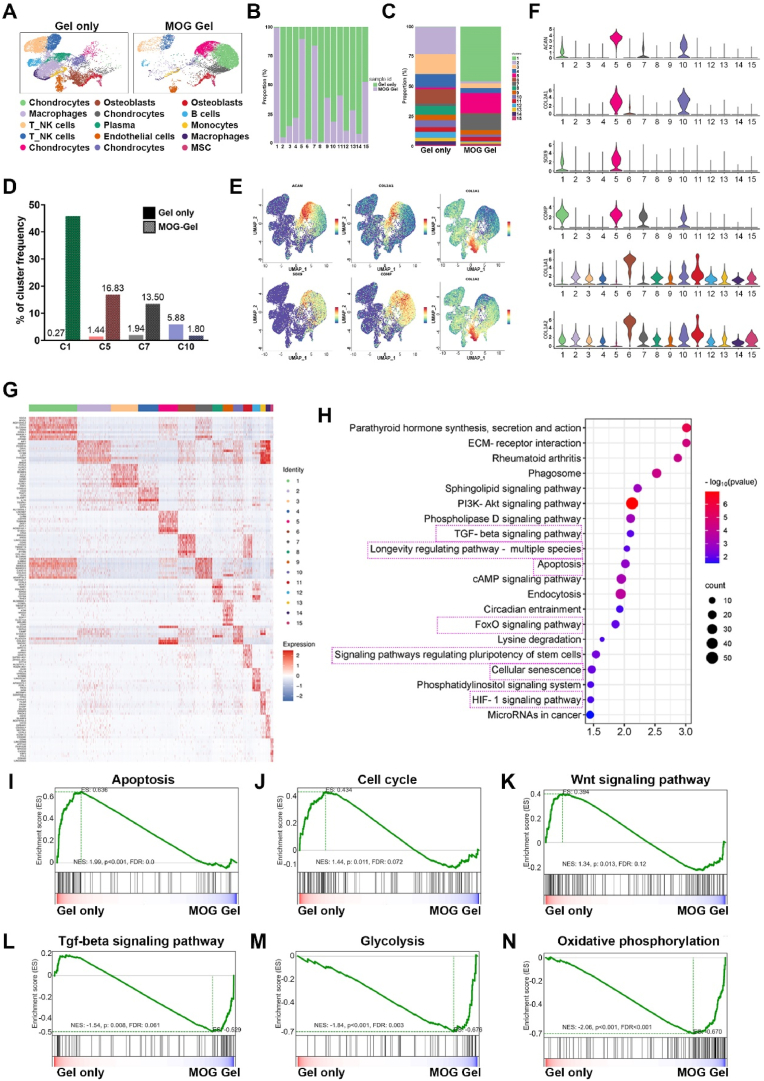
Results: In this study, we found Osteoarthritic cartilage defect patients demonstrated upregulated cellular senescence in joint cartilage. MicroRNA sequencing demonstrated senescence marker miR-24 was negatively associated with cartilage impairment and cellular senescence in osteoarthritic CD patients. Moreover, miR-24 mimics alleviates cellular senescence to promote chondrogenesis by targeting downstream TAOK1. Also, miR-24 downregulated TAOK1 expression and promoted chondrogenesis in SMSC organoids. Senescence-targeted miR-24 μS/SMSC organoid hydrogel (MSOH) was constructed and demonstrated superior chondrogenesis in vitro. Animal experiments demonstrated that MSOH hydrogel showed better cartilage repairing effects and better maintained joint function at 24 weeks with low intra-articular inflammatory response after transplantation in rat joint. Single-cell RNA-seq of generated cartilage indicated that implanted MSOH could affect chondrocyte homeostatic state and alter the chondrocyte cluster frequency by regulating cellular glycolysis and OXPHOS, impacting cell cycle and ferroptosis to alleviate cellular senescence and prevent joint degeneration.

Conclusion: Osteoarthritic cartilage defect patients demonstrated upregulated cellular senescence in joint cartilage. Senescence marker miR-24 was negatively associated with cartilage impairment in osteoarthritic CD patients. miR-24 attenuates chondrocytes senescence and promotes chondrogenesis in SMSC organoids through targeting TAOK1. Senescence-targeted miR-24 microsphere/SMSC organoid composite hydrogel could successfully repair cartilage defect in osteoarthritic microenvironment via enhanced miR-24/TAOK1 signaling pathway, suggesting MSOH might be a novel therapy for cartilage repair in osteoarthritic CD patients.


Conflict of interest statement

The authors have declared that no competing interest exists.

Figures

Image 1
Graphical abstract
Fig. 1
Fig. 1
Cellular senescent markers were upregulated in cartilage samples of osteoarthritic cartilage defect patients. A Safranin-O staining, immunofluorescence staining for p16INK4a, HMGB1 and ACAN in cartilage sample from young donor, young CD, aged donor, and aged CD. (green, HMGB1; red, ACAN; blue, DAPI) B Percent of HMGB1 and p16INK4a positive cell and OARSI score in cartilage sample from young donor, young CD, aged donor, and aged CD. (n = 6 for each) C SA-β-Gal staining and percent of SA-β-Gal positive cell in cartilage sample from young donor, young CD, aged donor, and aged CD. (n = 6 for each) D Immunofluorescence staining for 4-HNE and DAPI in cartilage sample from young donor, young CD, aged donor, and aged CD. (green, 4-HNE; blue, DAPI) E Immunofluorescence staining for γ-H2AX and DAPI in cartilage sample from young donor, young CD, aged donor, and aged CD. (green, γ-H2AX; blue, DAPI) F Immunofluorescence staining for p16INK4a and DAPI in cartilage sample from young donor, young CD, aged donor, and aged CD. (green, p16INK4a; blue, DAPI) G Alcian blue staining and Alcian blue positive cell in cartilage sample from young donor, young CD, aged donor, and aged CD. (n = 6 for each) H Relative Cdkn1a, Cdkn2aInk4a, MMP3, IL1β, IL6 and MMP13 expression level in cartilage sample from young donor, young CD, aged donor, and aged CD. (n = 6 for each) *P < 0.05, **P < 0.01 compared to the Young Donor group, #p < 0.05 compared to the Young CD group, &P < 0.05 compared to the Aged Donor group.
Fig. 2
Fig. 2
Discovery of H2O2 treated SMSC organoids-associated miRNAs by microarray and FISH. A Heatmap of clustering gene expression profiles with microarray in SMSC organoids compared to hydrogen peroxide treated SMSC organoids. (n = 3 for each group) B Volcano plot of RNA expression profiles of SMSC organoids and hydrogen peroxide treated SMSC organoids. MiR-24 was significantly downregulated in hydrogen peroxide treated SMSC organoids. C Relative miR24 expression level in SMSC, SMSC + H2O2 treatment, SMSC + senolytics treatment, SMSC organoids, SMSC organoids + H2O2 treatment, SMSC + senolytics treatment. (n = 6 for each) *P < 0.05 compared to the first column group, #p < 0.05, ##p < 0.01 compared to the 2nd column group. D fluorescent in situ hybridization (FISH) of miR-24 in SMSC, SMSC + H2O2 treatment, SMSC + senolytics treatment, SMSC organoids, SMSC organoids + H2O2 treatment, SMSC + senolytics treatment. E Relative miR-24 expression level in cartilage sample of young donor, young CD, aged donor, and aged CD. (n = 6 for each) *P < 0.05, **P < 0.01 compared to the Young Donor group, #P < 0.05 compared to the Young CD group, &P < 0.05 compared to the Aged Donor group. F Relationship between cartilage damage severity and miR-24 expression with linear regression of patients' Kellgren-Lawrence score and relative miR-24 expression level. G FISH of miR-24 in cartilage sample of OA patients and normal patients, and percent of miR-24 positive cell. (n = 6 for each) **P < 0.01 compared to the Control group.
Fig. 3
Fig. 3
TAOK1 is a direct target of miR-24 to modulate chondrogenesis. A Predicted genes were compiled for Venn analysis to search for potential targets of miR-24. B miRNA-mRNA network using the Cytospace software was constructed for miR-24. C Relative TAOK1 expression level in SMSC, SMSC + H2O2 treatment, SMSC + senolytics treatment, SMSC organoids, SMSC organoids + H2O2 treatment, SMSC + senolytics treatment. (n = 6 for each) *p < 0.05,**p < 0.01 compared to the first column group, #p < 0.05 compared to the 2nd column group. D Sequence of wide-type (WT) and mutant (Mut) TAOK1 binding sites for miR-24 (left) and conservation level of miR-24 sequence among species (right). E Luciferase reporter assay analysis results (n = 3 for each) to confirm the direct interaction between miR-24 and TAOK1 binding sites. *P < 0.05 compared to the mimics control group, #p < 0.05 compared to the miR-24 mimics group, &P < 0.05 compared to the inhibitor control group. F Fluorescence micrograph of Cy3 (red)-labeled miR-24 mimic internalized by GFP(green)-labeled SMSCs and SMSC organoids. G relative TAOK1 expression with qRT-PCR in SMSCs and SMSC organoids transfected with miR-24 mimics or inhibitor. (n = 3 for each) *P < 0.05 compared to the mimics control group, #p < 0.05 compared to the miR-24 mimics group, &P < 0.05 compared to the inhibitor control group. H Significantly enriched pathways for target genes of miRNAs enriched within SMSC in Kyoto Encyclopedia of Genes and Genomes (KEGG) pathways. I Heatmap of clustering gene expression profiles with q-PCR in SMSCs and SMSC organoids transfected with miR-24 mimics or inhibitor and TAOK1 siRNA. (n = 3 for each).
Fig. 4
Fig. 4
Generating miR-24 transfected SMSC organoids for anti-senescence and pro-chondrogenesis. A Fabrication of senescence-targeted miR-24 μS/SMSC organoid hydrogel for potential applications in chondrogenesis and further cartilage repair treatment. B SMSCs self-assembled to attain a spheroid shape in the four-week cultivation in the SMSC organoids. Immunofluorescence staining of p16INK4a (red) and HMGB1 (green) in SMSC organoids, SMSC organoids + H2O2 treatment and SMSC organoids + miR-24 transfection after 4 weeks. C 2D cultivation of SMSC. Immunofluorescence staining of p16INK4a (red) and HMGB1 (green) in SMSC, SMSC + H2O2 treatment and SMSC + miR-24 transfection. D Immunofluorescence staining of chondrogenic marker SOX9 (red) and ACAN (green) in SMSC organoids, SMSC organoids + H2O2 treatment and SMSC organoids + miR-24 transfection. E Immunofluorescence staining of chondrogenic marker SOX9 (red) and ACAN (green) in SMSC, SMSC + H2O2 treatment and SMSC + miR-24 transfection. F Heatmap of clustering gene expression profiles with q-PCR in SMSCs and SMSC organoids transfected with miR-24 mimics and H2O2 treatment. (n = 3 for each) G Quantification of deposited GAGs, collagen I and collagen II in SMSCs and SMSC organoids transfected with miR-24 mimics and H2O2 treatment. (n = 6 for each) *p < 0.05,**p < 0.01 compared to the first column group, #p < 0.05 compared to the 2nd column group.
Fig. 5
Fig. 5
Characterization of senescence-targeted MSOH hydrogel for cartilage repair in vitro. A Schematic illustration of the study design with 3D cultured SMSC organoids for cartilage damage treatment by intra-articular injection in rat. B before transplantation, miR-24 hydrogel was cross-linked by the addition of thrombin to further maintain the shape fidelity of the hydrogel. (left) The cross-linked hydrogel demonstrated good shape fidelity and (medium, right) good distribution of organoids. Organoids were indicated with yellow dotted circles, and organoid was embedded in the hydrogel indicated with grey arrows. (medium: higher resolution image of the partial area in the left image; right: SEM images of miR-24-conjugated hydrogel μs.) C Dynamic thermal rheological observations of the cross-linkage of MSOH. The temperature dependence of the storage and loss modulus was determined by oscillatory shear deformation with temperature ranging from 15 to 45 °C (heating rate 1.45 °C min-1) at constant frequency (1 Hz) and constant shear strain (γ = 0.05, 1.88 mrad). D Mechanical spectra of different component and cross-linked hydrogel measure at 17 °C. Storage and loss modulus were recorded in a constant strain mode with a deformation of 0.05 maintained over the frequency range of 0.01–10 Hz (rad/s) at 17 °C E Degeneration rate of organoid-laden hydrogel in vitro and in vivo. F 3D-reconstructed images of organoid-laden hydrogel, showing good cell viability with live/dead assay using Calcein-AM/PI double staining kit (green, live cells; red, dead cells) under a confocal microscope. G Immunofluorescence staining chondrogenic marker gene ACAN (green) in organoid-laden hydrogel.
Fig. 6
Fig. 6
MSOH repaired Cartilage defect and protected long-term joint function in vivo. A Histological assessment of joint cartilage with HE (2nd row), safranin-O (3rd row), immunohistochemical staining for collagen II (4th row) and immunofluorescent staining for ACAN (5th row. red, ACAN; blue, DAPI) in different groups. B Examination of intra-articular inflammatory response in the joint fluid was conducted with quantification of IL-1 concentration using ELISA kit. *p < 0.05,**p < 0.01, ***p < 0.001 and NS not significant compared to sham group at the correspondent time point. C Examination of intra-articular inflammatory response in the joint fluid was conducted with quantification of TNF-α concentration using ELISA kit. *p < 0.05,**p < 0.01, ***p < 0.001 and NS not significant compared to sham group at the correspondent time point. D Examination of intra-articular inflammatory response in the joint fluid was conducted with quantification of IL-6 concentration using ELISA kit. *p < 0.05,**p < 0.01, ***p < 0.001 and NS not significant compared to sham group at the correspondent time point. E Histological grading of repaired cartilage in different groups over 24 weeks. *P < 0.05, **p < 0.01 compared to the Gel only group, #p < 0.05 compared to the Organoid-Gel group. F Articular cartilage in organoid-gel and MOG-gel groups showed declined Mankin scores and G higher ICRS histological score compared to the sham and gel-only group in the femoral condyle (FC) and tibial plateau (TP) over the 24 weeks in vivo. F Mankin histological score of articular cartilage in the femoral condyle (FC) and tibial plateau (TP) in different groups with scaffold implantation compared to the native cartilage with no implantation surgery. *P < 0.05, **p < 0.01 and ***p < 0.001 compared to the Sham group, #p < 0.05 compared to the Organoid-Gel group, &P < 0.05 compared to the Gel-only group. G ICRS histological score of articular cartilage in the femoral condyle (FC) and tibial plateau (TP) in different groups with scaffold implantation compared to the native cartilage with no implantation surgery. *P < 0.05, **p < 0.01 and ***p < 0.001 compared to the Sham group, #p < 0.05 compared to the Organoid-Gel group, &P < 0.05 compared to the Gel-only group.
Fig. 7
Fig. 7
Implanted MSOH repaired cartilage defect and reversed cellular senescence by regulating miR-24/TAOK1 signaling axis A Heatmap of clustering gene expression profiles with microarray in gel-only group compared to MOG-Gel group. (n = 3 for each group) B Volcano plot of RNA expression profiles of MOG-gel group and gel-only group. C Significantly enriched pathways for MOG-gel group in Gene Ontology (GO) pathways. D Significantly enriched pathways for MOG-gel group in Kyoto Encyclopedia of Genes and Genomes (KEGG) pathways. E Heatmap of clustering gene expression profiles with q-PCR in MOG-gel group and gel-only group. (n = 3 for each) F Immunofluorescence staining of HMGB1, P16INK4a and miR-24 (FISH) of cartilage tissue in different groups. (green, HMGB1; red, p16INK4a; blue, DAPI; pink, miR-24) G Percent of HMGB1 positive cell in cartilage sample from different groups. (n = 6 for each) *P < 0.05, **p < 0.01 compared to the Sham group, #p < 0.05 compared to the Organoid-Gel group, &P < 0.05 compared to the Gel-only group. H Percent of p16INK4a positive cell in cartilage sample from different groups. (n = 6 for each) I SA-β-Gal staining of cartilage sample from different groups. *P < 0.05, **p < 0.01 compared to the Sham group, #p < 0.05 compared to the Organoid-Gel group, &P < 0.05 compared to the Gel-only group. J Percent of SA-β-Gal positive cell in cartilage sample from different groups. (n = 6 for each) K fluorescent in situ hybridization (FISH) of miR-24 in cartilage tissue from different groups. (red, miR-24; blue, DAPI) *P < 0.05, **p < 0.01 compared to the Sham group, #p < 0.05 compared to the Organoid-Gel group, &P < 0.05 compared to the Gel-only group.
Fig. 8
Fig. 8
Single-cell transcriptomic analysis of MOG Gel-derived cartilage compared to Gel only-derived cartilage. A. The t-distributed stochastic neighbor embedding (t-SNE) plot of the five identified main chondrocyte clusters in Gel only-derived and MOG Gel-derived cartilage samples. B. Relative proportion of each cluster across three cartilage samples as indicated. C. The frequency of each cluster in the Gel only -derived and MOG Gel-derived cartilages. D. Frequency of each of five chondrocyte clusters in the Gel only -derived and MOG Gel-derived cartilages. E. tSNE plots of the expression levels of chondrocyte marker genes (ACAN, SOX9, COL2A1 and COMP)and osteoblast marker genes (COL1A1 and COL1A2). F. Violin plots demonstrating the normalized gene expression levels of preferentially expressed and representative chondrogenic and osteoblastic marker genes among the 15 clusters. G. Heatmap revealing the scaled expression of preferentially and differentially expressed genes for each cluster. H. The Kyoto Encyclopedia of Genes and Genomes (KEGG) enrichment analysis showing differentially enriched signaling pathways in MOG Gel-derived cartilage compared to Gel only-derived cartilage. The representative pathway terms were marked with frames of red dotted line. I–N. Gene set enrichment analysis (GSEA) revealing the enrichment of representative function terms in OG Gel-derived cartilage compared to Gel only-derived cartilage. NES, normalized enrichment score; P, P value.
Fig. 9
Fig. 9
Transcriptional Heterogeneity of subclustered chondrocytes in MOG Gel-derived cartilage compared to Gel only-derived cartilage. A. Visualization of t-SNE colored subclusters within chondrocytes in single-cell transcriptomic analysis. B. Relative proportion of each subcluster across two cartilage samples as indicated. C. The frequency of each subcluster in the Gel only-derived and MOG Gel-derived cartilages. D-I. GSEA showing the representative function among each subcluster. NES, normalized enrichment score. J. Heatmap showing the highly expressed genes in the seven chondrocyte subclusters. K. The heatmap of Kyoto Encyclopedia of Genes and Genomes (KEGG) analysis showing differentially enriched signaling pathways among the seven chondrocyte subclusters. The representative pathway terms were marked with frames of red dotted line.

Similar articles

Cited by

References

    1. Sharma L. Osteoarthritis year in review 2015: clinical. Osteoarthritis Cartilage. 2016;24:36–48. - PMC - PubMed
    1. Sun Y., et al. Chondrogenic primed extracellular vesicles activate miR-455/SOX11/FOXO axis for cartilage regeneration and osteoarthritis treatment. NPJ. Regen. Med. 2022;7:53. - PMC - PubMed
    1. Parker C., et al. Osteochondral allograft transplantation for knee cartilage and osteochondral defects: a review of indications, technique, rehabilitation, and outcomes. JBJS Rev. 2019;7(6):e7. - PubMed
    1. Ajay K., et al. High tibial osteotomies for the treatment of osteoarthritis of the knee. JBJS Rev. 2022;10(1) e21.00127. - PubMed
    1. Jason M J., Lindsay K., Michael B. Medial unicompartmental arthroplasty of the knee. J. Am. Acad. Orthop. Surg. 2019;27(5):166–176. - PubMed

LinkOut - more resources