. 2024 May 24:15:1362904.
doi: 10.3389/fimmu.2024.1362904. eCollection 2024.

Simultaneous targeting of Tim3 and A2a receptors modulates MSLN-CAR T cell antitumor function in a human cervical tumor xenograft model

Affiliations

Simultaneous targeting of Tim3 and A2a receptors modulates MSLN-CAR T cell antitumor function in a human cervical tumor xenograft model

Tahereh Soltantoyeh et al. Front Immunol. .

Abstract

Introduction: Chimeric antigen receptor (CAR) T cell therapy has transformed the treatment of hematological malignancies. However, its efficacy in solid tumors is limited by the immunosuppressive tumor microenvironment that compromises CAR T cell antitumor function in clinical settings. To overcome this challenge, researchers have investigated the potential of inhibiting specific immune checkpoint receptors, including A2aR (Adenosine A2 Receptor) and Tim3 (T cell immunoglobulin and mucin domain-containing protein 3), to enhance CAR T cell function. In this study, we evaluated the impact of genetic targeting of Tim3 and A2a receptors on the antitumor function of human mesothelin-specific CAR T cells (MSLN-CAR) in vitro and in vivo.

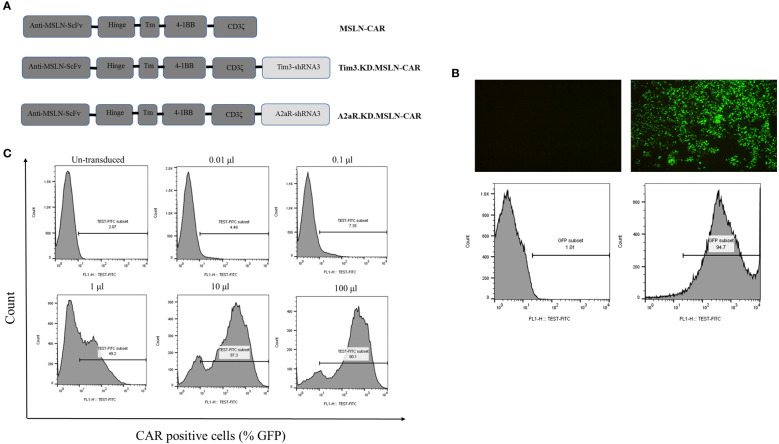
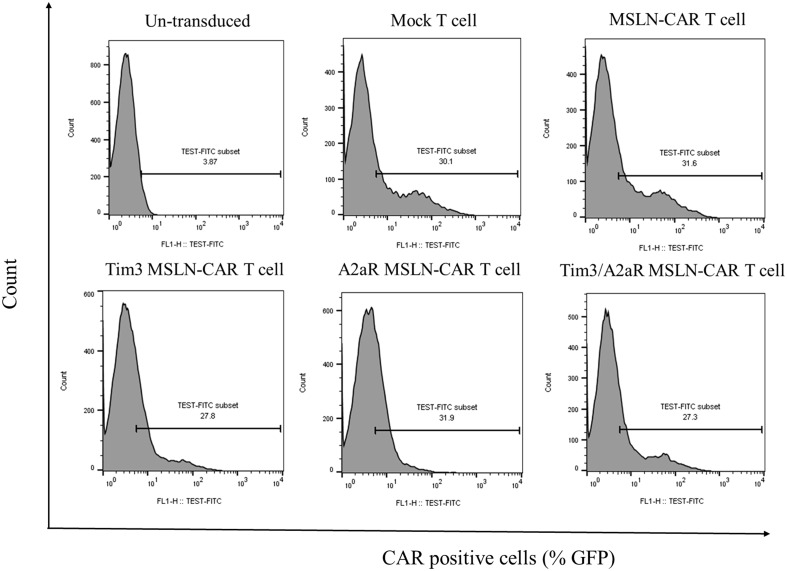
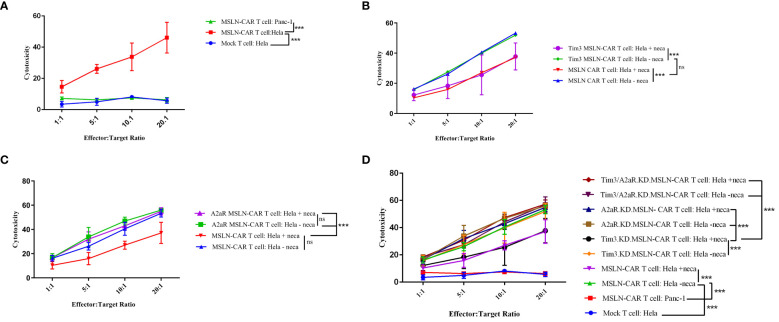
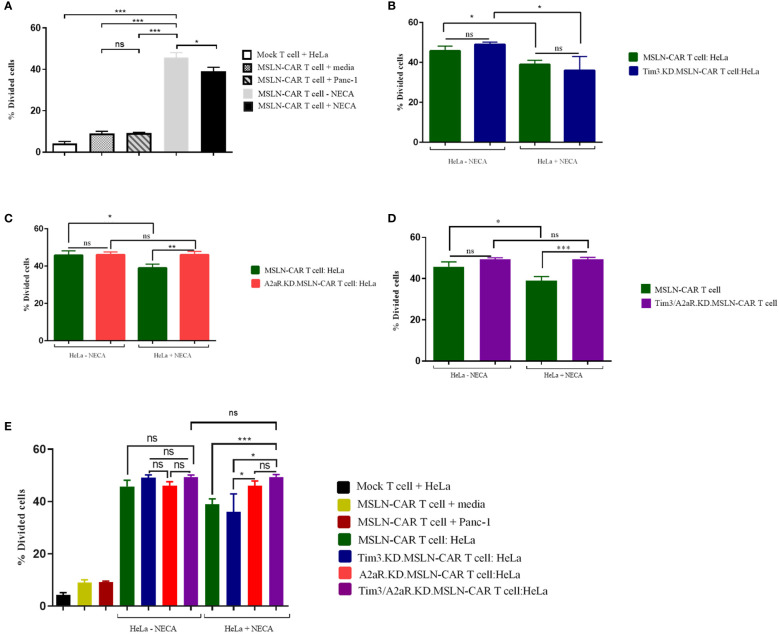
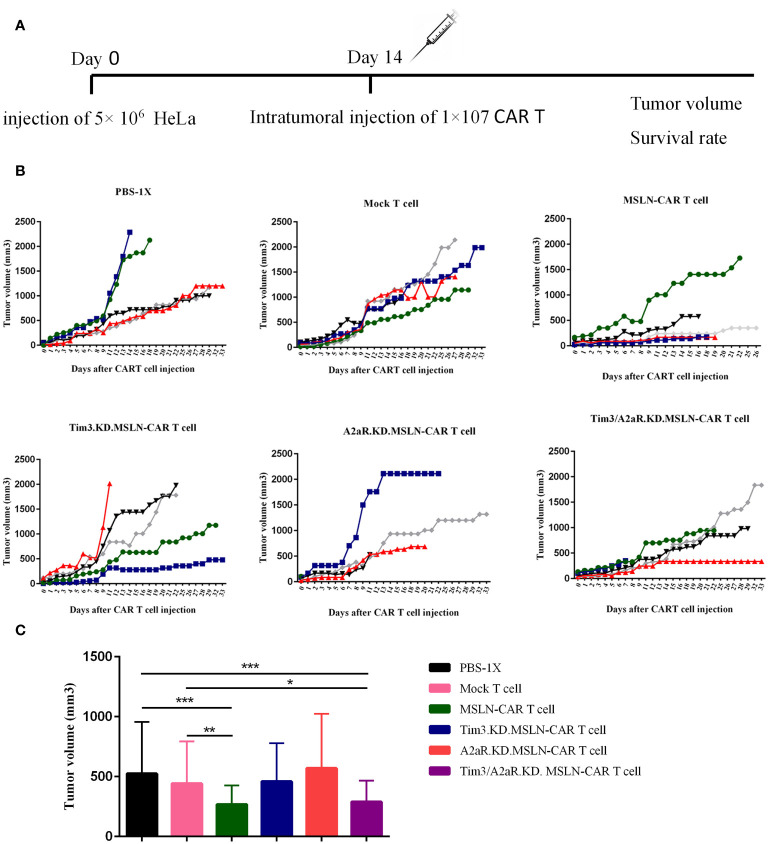
Methods: Second-generation anti-mesothelin CAR T cells were produced using standard cellular and molecular techniques. A2aR-knockdown and/or Tim3- knockdown anti-mesothelin-CAR T cells were generated using shRNA-mediated gene silencing. The antitumor function of CAR T cells was evaluated by measuring cytokine production, proliferation, and cytotoxicity in vitro through coculture with cervical cancer cells (HeLa cell line). To evaluate in vivo antitumor efficacy of manufactured CAR T cells, tumor growth and mouse survival were monitored in a human cervical cancer xenograft model.

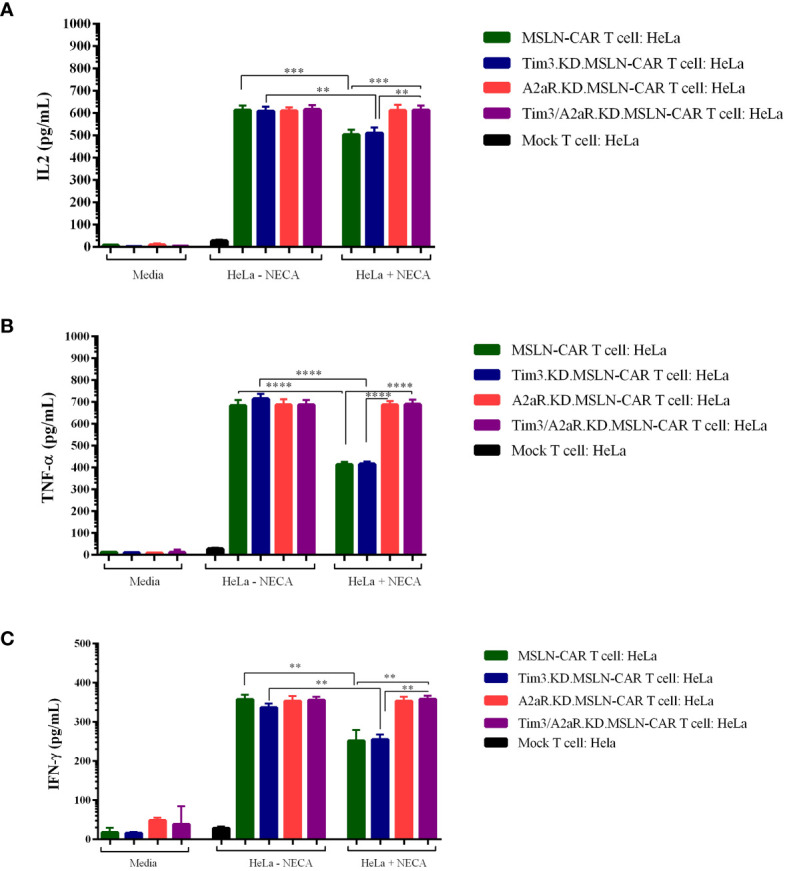
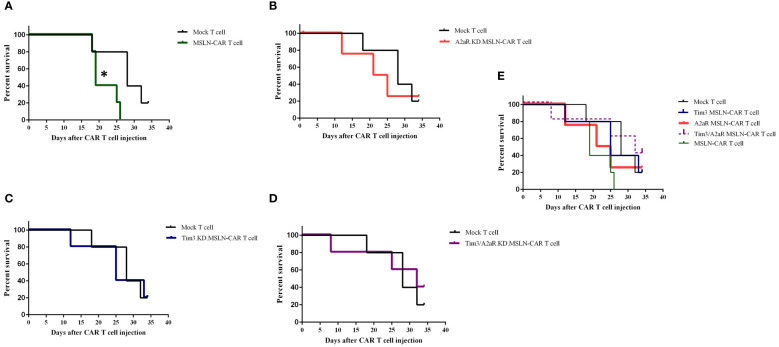
Results: In vitro experiments demonstrated that knockdown of A2aR alone or in combination with Tim3 significantly improved CAR T cell proliferation, cytokine production, and cytotoxicity in presence of tumor cells in an antigen-specific manner. Furthermore, in the humanized xenograft model, both double knockdown CAR T cells and control CAR T cells could effectively control tumor growth. However, single knockdown CAR T cells were associated with reduced survival in mice.

Conclusion: These findings highlight the potential of concomitant genetic targeting of Tim3 and A2a receptors to augment the efficacy of CAR T cell therapy in solid tumors. Nevertheless, caution should be exercised in light of our observation of decreased survival in mice treated with single knockdown MSLN-CAR T cells, emphasizing the need for careful efficacy considerations.

Keywords: A2aR; CAR T cell therapy; Tim3; genetic targeting; shRNA; solid tumors; xenograft.


Conflict of interest statement

The authors declare that the research was conducted in the absence of any commercial or financial relationships that could be construed as a potential conflict of interest. The author(s) declared that they were an editorial board member of Frontiers, at the time of submission. This had no impact on the peer review process and the final decision.

Figures

Figure 1
Figure 1
Lentiviral vector production and titration. Schematic representation of three second-generation CAR constructs (A). MSLN-CAR contains an anti-mesothelin (MSLN) scFv, human CD8α-derived hinge, 4–1BB-derived transmembrane (TM) domain, and two intracellular domains, including 4–1BB and CD3ζ. A2aR.KD and Tim3.KD.MSLN-CAR constructs include an anti-A2aR or Tim3 shRNA sequence after the CD3ζ sequence. ShRNA sequences were designed to target the A2aR and Tim3 genes. Fluorescence microscopy images and histogram plots show the percentage of HEK293T cells transfected with lentiviral vectors containing GFP (right) compared to untransfected HEK293T cells (left) (B). Flow cytometry histograms show the titration of concentrated virus-containing media (VCM) on 1×10⁶ Jurkat cells/well (C). The percentage of CAR-expressing Jurkat cells (GFP%) three days after transduction with 0.01, 0.1, 1, 10, and 100 μL of VCM is shown.
Figure 2
Figure 2
Generation of different types of MSLN-CAR T cells. Flow cytometry histogram plots show the percentage of CAR-positive T cells generated from one donor 4 days after transduction of anti-CD3/CD28-activated T cells with the indicated volume of lentiviral vectors at an MOI of ~5. Untransduced T cells refer to T cells that did not undergo transduction with lentiviral vectors. Mock T cells were transduced with a pCDH-CMV-MCS-EF1 vector without the MSLN-CAR sequence. MSLN-CAR T cells refer to T cells transduced with a lentivector containing the anti-mesothelin CAR. Tim3.KD.MSLN-CAR T cells refer to T cells containing both MSLN-CAR and Tim3 shRNA. A2aR.KD.MSLN-CAR T cells refer to T cells containing both MSLN-CAR and A2aR shRNA. Tim3/A2aR.KD.MSLN-CAR T cells were cotransduced with half of the indicated volume of lentivectors containing MSLN-CAR and Tim3 shRNA and MSLN-CAR and A2aR shRNA.
Figure 3
Figure 3
Antigen-dependent cytotoxicity of MSLN-CAR T cells. Line plots comparing the average percentage of dead HeLa target cells coincubated with MSLN-CAR T cells, Tim3.KD.MSLN-CAR T cells, A2aR.KD.MSLN-CAR T cells, Tim3/A2aR.KD.MSLN-CAR T cells and mock T cells at four different effector-to-target ratios (1:1, 5:1, 10:1, and 20:1) in the absence or presence of 1 μM NECA for 4 hours (A-D). The cells were stained with propidium iodide (PI) dye. Data are representative of two independent experiments, each performed in duplicate. Two-way ANOVA followed by Tukey’s post hoc test was used for statistical analysis. P< 0.05 was considered statistically significant. (***P< 0.001). NECA: 5′-(N-ethylcarboxamido) adenosine; SD: standard deviation; MSLN-CAR T cells: fully human anti-mesothelin CAR T cells; Tim3.KD.MSLN-CAR T cells: MSLN-CAR T cells containing Tim3 shRNA; A2aR.KD.MSLN-CAR T cells: MSLN-CAR T cells containing A2aR shRNA; Tim3/A2aR.KD.MSLN-CAR T cells: MSLN-CAR T cells containing both Tim3 and A2aR shRNA; Mock T cells: T cells containing an empty vector.
Figure 4
Figure 4
Proliferation potency of MSLN-CAR T cells in the presence of antigen and adenosine. 2 × 10⁵ CAR T cells from four groups, including MSLN-CAR T cells, Tim3.KD.MSLN-CAR T cells, A2aR.KD.MSLN-CAR T cells, and Tim3/A2aR.KD.MSLN-CAR T cells were labeled with CFSE dye and cocultured with mitomycin C-treated HeLa cells at a 1:1 ratio for 72 hours in the absence or presence of 1 μM NECA. Mock T cells containing an empty vector were used as control cells. The bar graphs show the percentage of divided cells between MSLN-CAR T cells (in presence and absence of Neca) and mock T cells against media and mesothelin positive (HeLa) and negative (Panc-1) cancer cells (A). Antigen specific proliferation of MSLN-CAR T cells and Tim3.KD.MSLN-CAR T cells in presence and absence of Neca (B). Antigen specific proliferation of MSLN-CAR T cells and A2aR.KD.MSLN-CAR T cells in presence and absence of Neca (C). Antigen specific proliferation of MSLN-CAR T cells and Tim3/A2aR.KD.MSLN-CAR T cells in presence and absence of Neca (D), and among all groups (E). The data are presented as the mean ± standard deviation (SD). Mean comparisons were performed using Brown-Forsythe and Welch ANOVA followed by Dunnett T3’s post hoc test. Statistical significance was set at P< 0.05. The results represent two independent experiments (*P< 0.05, **P< 0.01, and ***P< 0.001). NECA, 5′-(N-ethylcarboxamido) adenosine; SD, standard deviation; MSLN-CAR T cells, fully human anti-mesothelin CAR T cells; Tim3.KD.MSLN-CARs, T cells containing MSLN-CAR and Tim3 shRNA; A2aR.KD.MSLN-CARs, T cells containing MSLN-CAR and A2aR shRNA; Tim3/A2aR.KD.MSLN-CARs, T cells containing MSLN-CAR and both Tim3 and A2aR shRNA; Mock T, T cells containing an empty vector.
Figure 5
Figure 5
Cytokine production of different types of MSLN-CAR T cells. Fully human anti-mesothelin CAR T cells (MSLN-CAR T cells), Tim3 knockdown MSLN-CAR T cells (Tim3.KD.MSLN-CAR T cells), A2aR knockdown MSLN-CAR T cells (A2aR.KD.MSLN-CAR T cells), Tim3 and A2aR knockdown MSLN-CAR T cells (Tim3/A2aR.KD.MSLN-CAR T cells), and mock T cells containing empty vector were cocultured with HeLa target cells at a 1:1 ratio or media in the absence or presence of 1 μM NECA (5′-Nethylcarboxamido adenosine). After 48 hours, the supernatant was harvested, and the concentrations of IL2 (A), TNFα (B), and IFN-γ (C) cytokines were measured using ELISA. Data are presented as the mean ± standard deviation (SD) from two independent experiments. Mean comparisons were performed using one-way ANOVA followed by Tukey's post hoc test, with P< 0.05 considered statistically significant (**P< 0.01, ***P< 0.001, and ****P< 0.0001). MSLN-CAR T cells: fully human anti-mesothelin CAR T cells; Tim3.KD.MSLN-CARs: MSLN-CAR T cells containing Tim3 shRNA; A2aR.KD.MSLN-CARs: MSLN-CAR T cells containing A2aR shRNA; Tim3/A2aR.KD.MSLN-CARs: MSLN-CAR T cells containing both Tim3 and A2aR shRNA; Mock T cells: T cells containing empty vector.
Figure 6
Figure 6
The effect of CAR T cells on tumor growth. The effect of CAR T cells on tumor growth was evaluated in six groups of C57BL/6-nude mice (n=5) treated with 1x10⁷ different CAR T cells, including MSLN-CAR T cells, Tim3.KD.MSLN-CAR T cells, A2aR.KD.MSLN-CAR T cells, and Tim3/A2aR.KD.MSLN-CAR T cells. PBS-1X and Mock T cells were used as control groups. Tumor volume was measured on day 0 (the time of intervention) and every 24–48 hours (A). Line plots depict the rate of tumor growth over time for each of the five mice in each group (B). Each color represents the tumor growth trend curve for one mouse. The bar graph displays the tumor volume for each group (C). Data are presented as the mean ± SD. Mean comparisons were performed using two-way ANOVA followed by Tukey's post hoc test. A P value less than 0.05 was considered statistically significant (*P< 0.05, **P< 0.01, ***P< 0.001). The results are representative of two independent experiments. The CAR T cells used in the study were fully human anti-mesothelin CAR T cells (MSLN-CAR T cells), T cells containing MSLN-CAR and Tim3 shRNA (Tim3.KD.MSLN-CAR T cells), T cells containing MSLN-CAR and A2aR shRNA (A2aR.KD.MSLN-CAR T cells), T cells containing MSLN-CAR and both Tim3 and A2aR shRNA (Tim3/A2aR.KD.MSLN-CAR T cells), and mock T cells containing an empty vector. The PBS-1x group received phosphate-buffered saline.
Figure 7
Figure 7
Impact of CAR T cell therapy on survival rates in C57BL/6-nude mice. Six groups of mice (n = 5) were treated with different CAR T cell therapies, including MSLN-CAR T cells and Tim3.KD.MSLN-CAR T cells, A2aR.KD.MSLN-CAR T cells, and Tim3/A2aR.KD.MSLN-CAR T cells, as well as control groups treated with PBS-1X and mock T cells. Kaplan-Meier plots show the comparison of percent survival between the mock T cell group and MSLN-CAR T cells (A), A2aR.KD.MSLN-CAR T cells (B), Tim3.KD.MSLN-CAR T cells (C), Tim3/A2aR.KD.MSLN-CAR T cells (D), and all groups combined (E). The number of days the mice survived the intervention (day 0) was recorded, and the endpoint was defined as a tumor volume of 2000 mm3. The survival data were analyzed using a log-rank test. In the Kaplan-Meier plot for the MSLN-CAR T group, the symbol * indicates that mouse deaths occurred when tumor sizes ranged from 100–300 mm3.

Similar articles

Cited by

References

    1. Martinez M, Moon EK. CAR T cells for solid tumors: new strategies for finding, infiltrating, and surviving in the tumor microenvironment. Front Immunol. (2019) 10:128. doi: 10.3389/fimmu.2019.00128 - DOI - PMC - PubMed
    1. Mirzaei HR, Rodriguez A, Shepphird J, Brown CE, Badie B. Chimeric antigen receptors T cell therapy in solid tumor: challenges and clinical applications. Front Immunol. (2017) 8:1850. doi: 10.3389/fimmu.2017.01850 - DOI - PMC - PubMed
    1. Davern M, Donlon NE, O’Connell F, Gaughan C, O’Donovan C, McGrath J, et al. . Nutrient deprivation and hypoxia alter T cell immune checkpoint expression: potential impact for immunotherapy. J Cancer Res Clin Oncol. (2022) 149(8):5377–95. doi: 10.1007/s00432-022-04440-0 - DOI - PMC - PubMed
    1. Seifert M, Benmebarek MR, Briukhovetska D, Märkl F, Dörr J, Cadilha BL, et al. . Impact of the selective A2(A)R and A2(B)R dual antagonist AB928/etrumadenant on CAR T cell function. Br J Cancer. (2022) 127:2175–85. doi: 10.1038/s41416-022-02013-z - DOI - PMC - PubMed
    1. Ohta A, Sitkovsky M. Extracellular adenosine-mediated modulation of regulatory T cells. Front Immunol. (2014) 5:304. doi: 10.3389/fimmu.2014.00304 - DOI - PMC - PubMed

MeSH terms