. 2024 May 19;14(8):3082-3103.
doi: 10.7150/thno.95611. eCollection 2024.

Well-defined alginate oligosaccharides ameliorate joint pain and inflammation in a mouse model of gouty arthritis

Affiliations

Well-defined alginate oligosaccharides ameliorate joint pain and inflammation in a mouse model of gouty arthritis

Chengyu Yin et al. Theranostics. .

Abstract

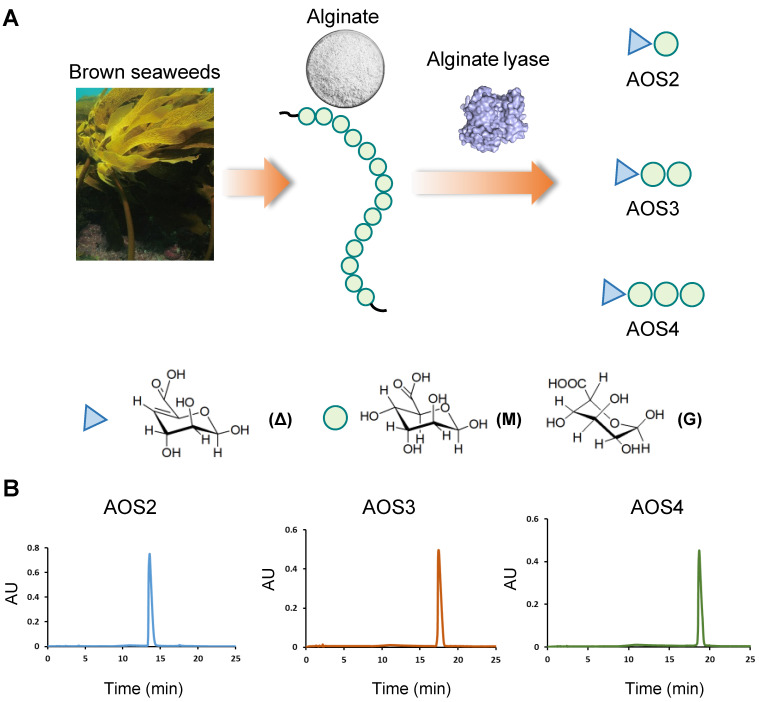
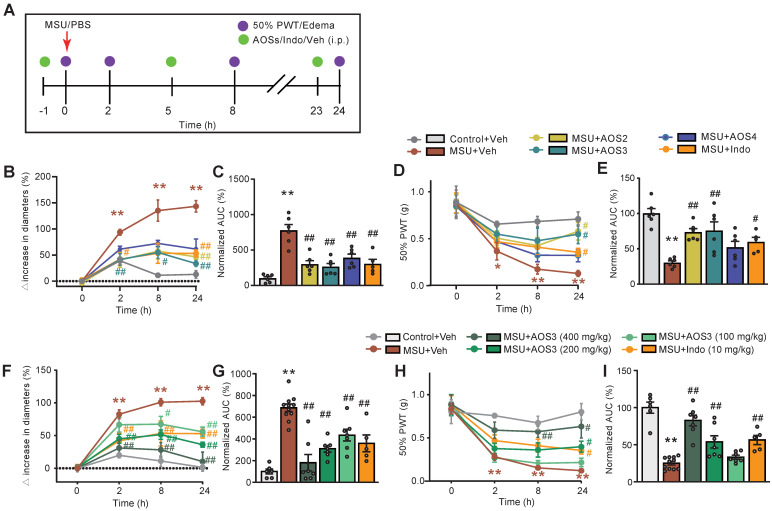
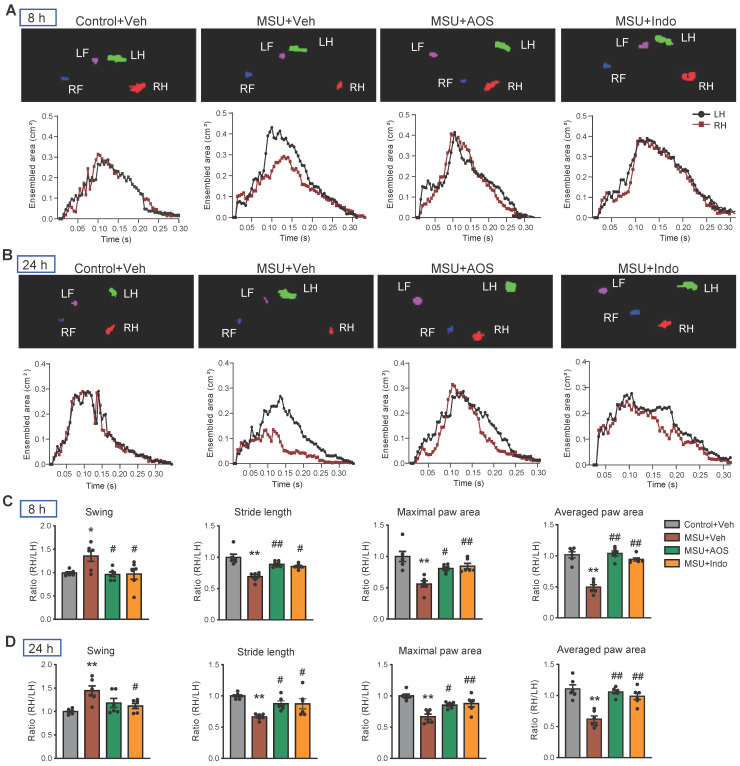
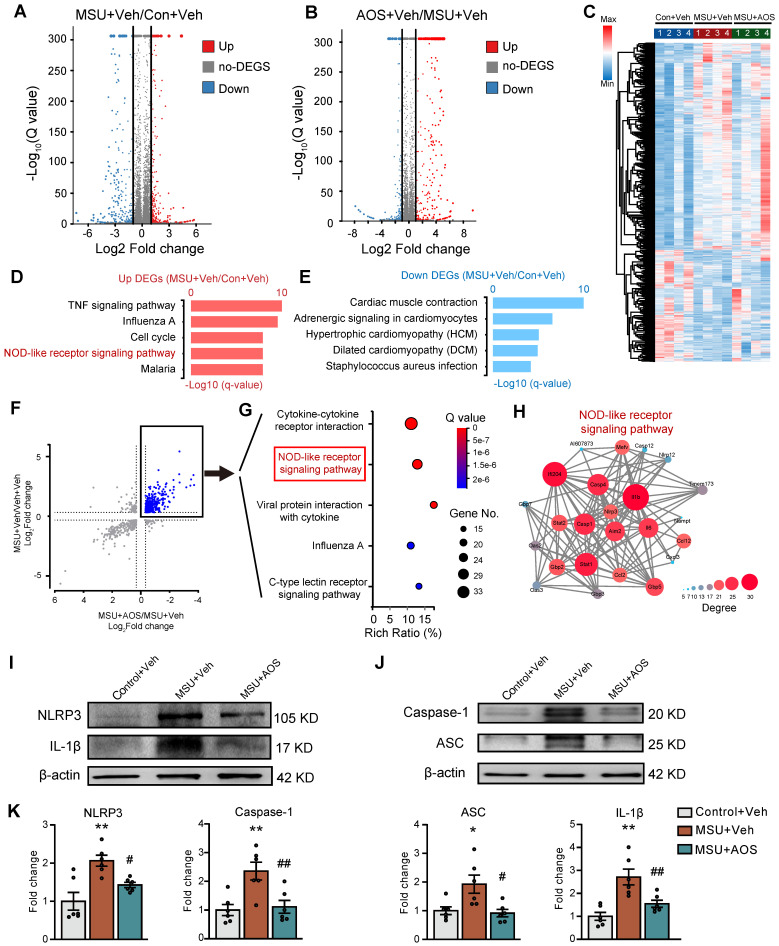
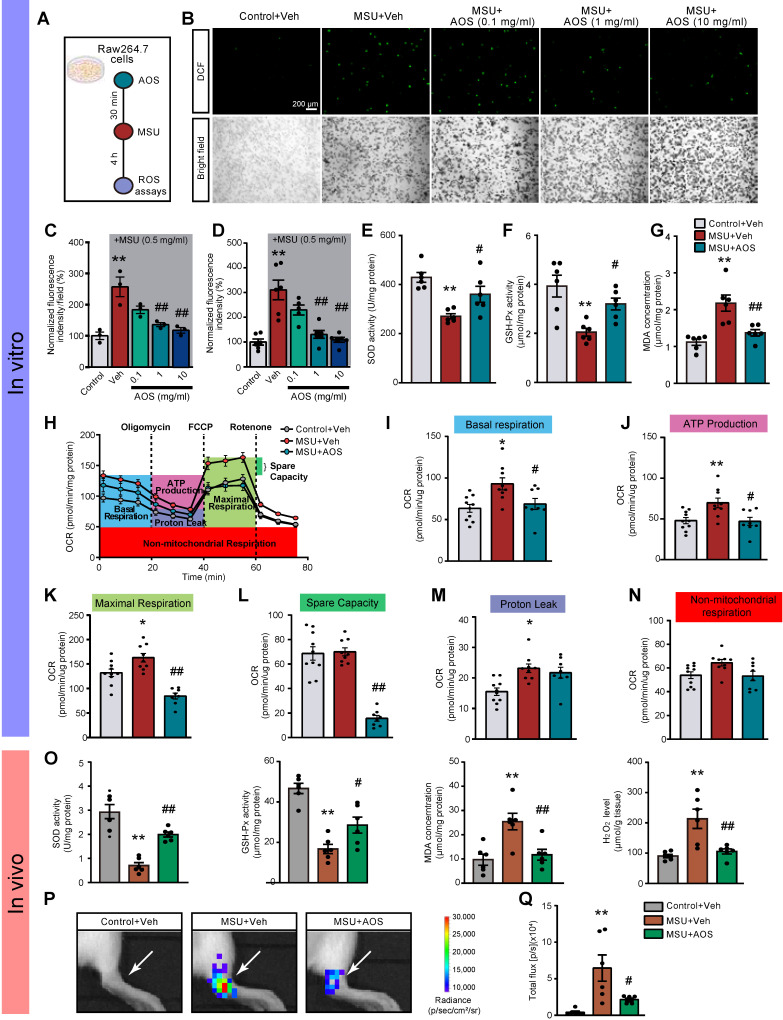
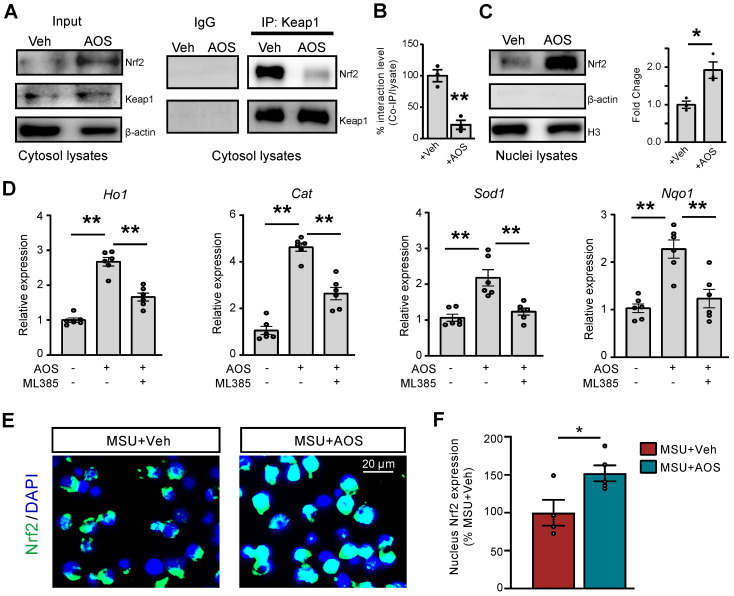
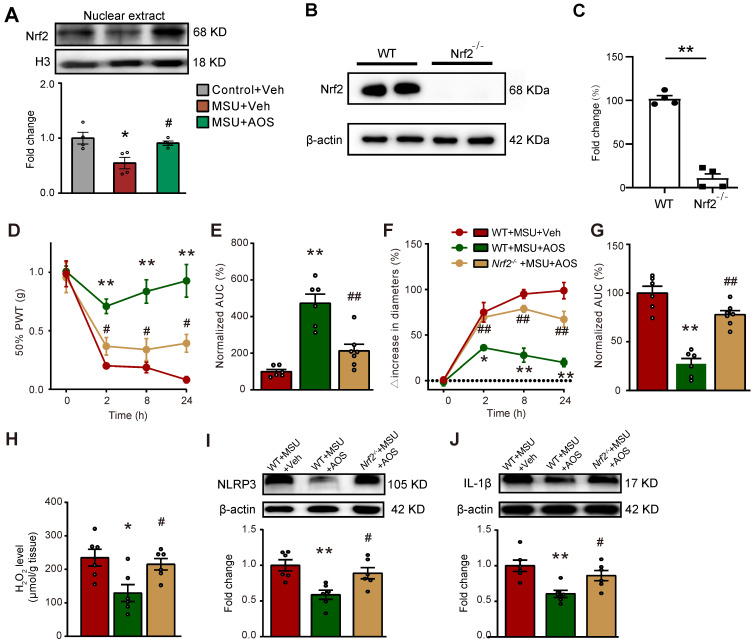
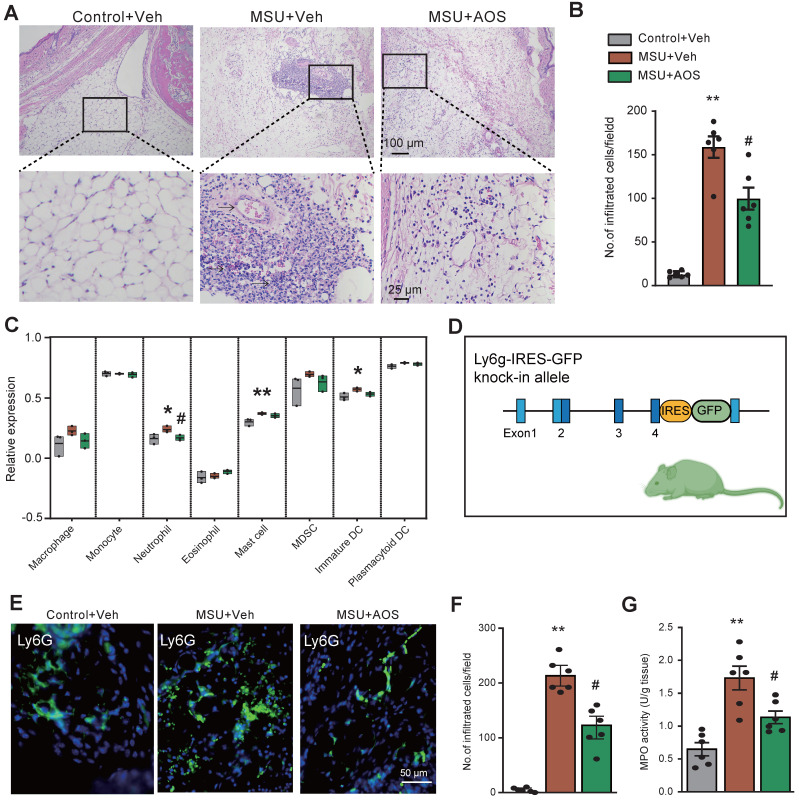
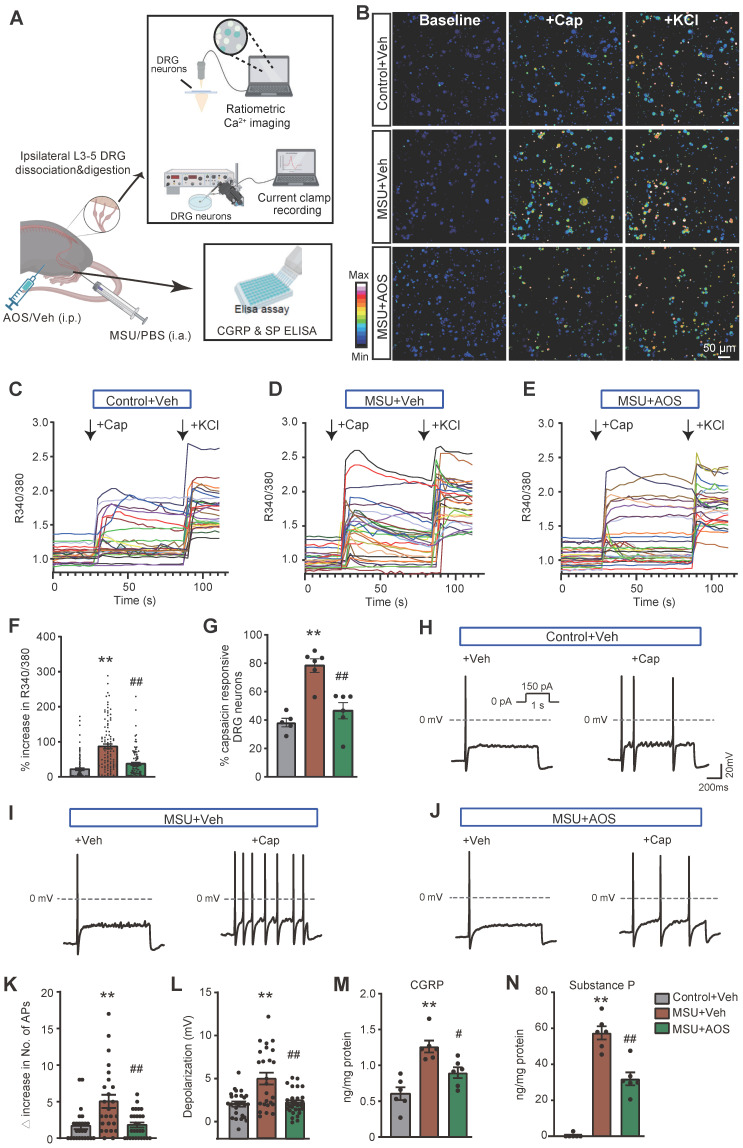
Background: Gouty arthritis causes severe pain and inflammation. Alginate oligosaccharides (AOSs) are natural products derived from alginate and have anti-inflammatory properties. We explored the potential effects of AOSs with different degrees of polymerization (Dp) on gouty arthritis and associated mechanisms. Methods: We established a mouse model of gouty arthritis by injecting monosodium urate (MSU) into ankle joint. Nocifensive behavior, gait and ankle swelling were used to study AOS's effects. Biochemical assays, in vivo imaging, live cell Ca2+ imaging, electrophysiology, RNA-sequencing, etc. were used for mechanism exploration. Results: AOS2 (Dp=2), AOS3 (Dp=3) and AOS4 (Dp=4) all inhibited ankle swelling, whereas AOS2&3 produced the most obvious analgesia on model mice. AOS3, which was picked for further evaluation, produced dose-dependent ameliorative effects on model mice. AOS3 reversed gait impairments but did not alter locomotor activity. AOS3 inhibited NLRP3 inflammasome activation and inflammatory cytokine up-regulation in ankle joint. AOS3 ameliorated MSU-induced oxidative stress and reactive oxygen species (ROS) production both in vivo and in vitro and reversed the impaired mitochondrial bioenergetics. AOS3 activated the Nrf2 pathway and promoted Nrf2 disassociation from Keap1-bound complex and Nrf2 nuclear translocation, thus facilitating antioxidant gene expression via Nrf2-dependent mechanism. Nrf2 gene deficiency abolished AOS3's ameliorative effects on pain, inflammation and oxidative stress in ankle joints of model mice. AOS3 reduced TRPV1 functional enhancement in DRG neurons and constrained neuroactive peptide release. Conclusions: AOS3 ameliorates gouty arthritis via activating Nrf2-dependent antioxidant signaling, resulting in suppression of ROS-mediated NLRP3 inflammasome activation and TRPV1 enhancement. AOS3 may be novel therapeutics for gouty arthritis.

Keywords: Inflammation; NLRP3; Neuropeptide; Oligosaccharides; ROS; TRPV1.


Conflict of interest statement

Competing Interests: Dr. Zhende Liu is one of the inventors on patent applications related to this work filed by Haitang (Jiangsu) Biotechnology Co, Ltd (ZL 202110831844.0 and PCT/CN2021/107883). All other authors declare that they have no competing interests.

Figures

Figure 1
Figure 1
Characterization of AOSs used in this study. (A) Schematic picture showing that AOSs used in this study were prepared by alginate lyases degradation of alginates. Alginate lyases depolymerize alginate through a β-elimination reaction leading to the formation of unsaturated residues, 4-deoxy-L-erythro-hex-4-enopyranosyluronic residues (symbolized by Δ), at the nonreducing end of the products. Circle indicated the M or G unit in alginate. (B) HPLC analysis showing that AOS2-4 (AOS with Dp2-4) were homogenized with specific Dp.
Figure 2
Figure 2
Evaluation of the effects of AOSs on ankle edema and mechanical allodynia of a mouse model of gouty arthritis. (A) Schematic protocol for experiments: PBS (20 μl) or MSU (0.5 mg/20 μl) was applied via intraarticular injection to ankle joint to establish control or gouty arthritis model, respectively. Different compositions (AOS2, AOS3 or AOS4, in 200 mg/kg dosage each), or different dosage (100, 200 or 400 mg/kg) of AOS3, indomethacin (Indo, 10 mg/kg) or corresponding vehicle was injected intraperitoneally (i.p.) at 1 h before and 5, and 23 h after model establishment. Mechanical allodynia and ankle edema were measured at time points as indicated. (B) Time courses of the effects of indomethacin (Indo) and different dosages of AOS3 on ankle edema. (C) Normalized AUC of panel B. (D) Time courses of the effects of indomethacin and different doses of AOS3 on mechanical allodynia of the hind paw. (E) Normalized AUC of panel D. (F) Time courses showing the effect of treatment with different compositions of AOS or indomethacin on ankle edema of MSU-treated mice. (G) Normalized AUC analysis of the curves shown in panel F. (H) Time courses showing the effect of treatment with different compositions of AOS or indomethacin on mechanical allodynia of MSU-treated mice. (I) Normalized AUC analysis of the curves shown in panel H. **p<0.01, *p<0.05 vs. Control+Veh group. #p<0.05, ##p<0.01 vs. MSU + Veh group. n=5-11 mice/group. One-way ANOVA followed by Tukey's post hoc test was used in panel C, E, G&I. Two-way ANOVA followed by Tukey's post hoc test was used in panel B, D, F&H.
Figure 3
Figure 3
AOS3 treatment improved gait impairments that were exhibited by gouty arthritis model mice. (A&B) Representative pictures showing the mice under gait analysis at 8 (A) and 24 h (B) after model establishment. Top panel shows instant recording of paw images of the mice, whereas the bottom panel shows representative data for ensembled paw area of the left hind (LH) vs. right hind (RH) of mice from Control+Veh, MSU+Veh, MSU+AOS and MSU+Indomethacin groups at 8 h (A) or 24 h (B) time points. (C&D) Summary of swing ratio (RH/LH), stride length ratio (RH/LH) and paw area ratio (RH/LH) of 4 groups of mice at 8 (C) and 24 h (D) time points. n=6-7 mice group. *p<0.05, **p<0.01 vs. Control+Veh. #p<0.05, ##p<0.01 vs. MSU+Veh group. One-way ANOVA followed by Tukey's post hoc test was used in panel C&D.
Figure 4
Figure 4
Exploration of potential molecular targets of AOS3 in ankle joint tissues of gouty arthritis model mice by means of RNA-Seq and the validations. (A&B) Volcano plots showing DEGs derived from comparisons between MSU+Veh vs. Control+Veh or AOS+Veh vs. MSU+Veh groups of mice. Red and blue dots show up- and down-regulated DEGs, respectively. Gray dots indicate non-DEGs. (C) Heat map with hierarchical clustered analysis showing the DEGs identified from panel A&B. (D&E) Bar charts showing the top 5 enriched pathways identified by Gene Ontology (GO) analysis of up- or down-regulated DEGs derived from MSU+Veh vs. Control+Veh group. (F) Scattered plot showing the DEGs that were overlapped between MSU+Veh/ Control+Veh group and AOS+Veh vs. MSU+Veh group. (G) Bubble plots showing the top 5 significant pathways of the DEGs (colored in blue in panel F and outlined by black box) identified by KEGG. (H) Construction of PPI network of DEGs allocated to NOD-like receptor signaling pathway as in panel G (outlined by the red box). Deeper color and larger circle indicate more protein-protein interactions and vice versa. n=4 mice/group for RNA-Seq. (I&J) Representative immunoblots of NLRP3, ASC, cleaved IL1β, cleaved Caspase1 in Control+Veh, MSU+Veh and MSU+AOS groups of mice. β-actin was used as loading control. (K) Column charts showing the quantifications of NLRP3, cleaved IL-1β, ASC and cleaved Caspase1 protein levels in ankle joint tissues of three groups. n=6 mice/group. *p<0.05, **p<0.01 vs. Control+Veh group. #p<0.05, ##p<0.01 vs. MSU+Veh group. One-way ANOVA followed by Tukey's post hoc test was used in panel K.
Figure 5
Figure 5
AOS3 reduces MSU-induced ROS production and improves mitochondrial bioenergetics dysfunction. (A) Schematic in vitro experiments protocol using murine macrophage cell line RAW264.7 cells. (B) Representative photographs showing cellular oxidative stress indicated by DCF fluorescence in control condition and stimulated by MSU (0.5 mg/ml) in RAW264.7 cells captured with a fluorescence microscope. Upper panel: DCF fluorescence. Lower panel: bright field (BF) image. Cells were treated with vehicle (PBS) or AOS3 (0.1, 1 or 10 mg/ml) 30 min before MSU application. Scale bar indicates 200 μm. (C) Summary of DCF fluorescence intensity in Control, MSU+Veh and MSU groups treated with different dosages of AOS (0.1, 1 or 10 mg/ml) as shown in panel B. The control group value was taken as 100% and all other groups were normalized thereafter. n=3 tests/group. (D) Summary of DCF fluorescence intensity in Control, MSU+Veh and MSU groups treated with different dosages of AOS (0.1, 1 or 10 mg/ml) determined by the microplate reader. n=5-6 tests/group. (E-G) Summary of determinations of SOD activities (E), GSH-Px activities (F), and MDA concentrations (G) in Raw264.7 cells treated with vehicle or AOS (1 mg/ml). n=5-6 tests/group. (H) Overlaid time courses showing the determination of OCR in Raw264.7 cells of Control+Veh, MSU+Veh and MSU+AOS groups. Different color-labeled region denotes corresponding OCR parameters. (I-N) Analysis of parameters involved in mitochondrial bioenergetics, including basal respiration (I), ATP production (J), maximal respiration (K), spare respiratory capacity (L) proton leak (M), and non-mitochondrial respiration (N). n=8-10 tests/group. (O) Summarized data showing in vivo studies determining SOD activity, GSH-Px activity, and MDA content as well as H2O2 level in ankle joint tissues 24 h after vehicle/MSU injection. (P) In vivo imaging of ROS levels of the ankle joints by means of L-012 in live animals. (Q) Summary of total chemiluminescent fluxes of L-012 in the ankle joints. n=6 mice/group. *p<0.05, **p<0.01 vs. Control+Veh. #p<0.05, ##p<0.01vs. MSU+Veh group. One-way ANOVA followed by Tukey's post hoc test was used.
Figure 6
Figure 6
AOS3 activates Nrf2-related antioxidant signaling cascade in vitro. (A) Representative Co-IP assay showing Keap1-bound Nrf2 expression in cytosol lysates of Raw264.7 cells treated with vehicle or AOS3 (1 mg/ml). IgG was used as a negative control. (B) Summary of Keap1-Nrf2 interaction level determined by Co-IP assay as in panel A. +Veh group was normalized as 100%. n=3 tests/group. (C) Nrf2 protein in nuclear fraction lysates. (D) Gene expression of Ho1, Cat, Sod1 and Nqo1 in RAW264.7 cells with vehicle, AOS3 or AOS3+ML385 treatment. n=6 tests/group. (E) Representative immunocytochemical images of subcellular localization of Nrf2 in Raw264.7 cells treated with vehicle or AOS in the presence of MSU. Blue: DAPI. Green: Nrf2. (F) Summarized data shows quantification of Nrf2 in the nucleus. n=4-5 tests/group. **p<0.01, *p<0.05. Unpaired Student's t test was used for panels B, C&F. One-way ANOVA followed by Tukey's post hoc test was used for panel D.
Figure 7
Figure 7
AOS3 ameliorates mechanical pain and ankle edema of gouty arthritis model mice via Nrf2-dependent mechanism. (A) The expression of Nrf2 in nuclear fraction lysates of ankle joint tissues of Control+Veh, MSU+Veh and MSU+AOS group of mice determined by Western blotting. *p<0.05 vs. Control+Veh group. #p<0.05 vs. MSU+Veh group. (B) Western blotting examining Nrf2 expression in ankle joint tissues of wildtype (WT) and Nrf2-/- mice. **p<0.01 vs. WT group. (C) Overlaid time courses showing 50% PWT changes in 3 groups of mice. AOS3 (200 mg/kg, i.p.) or vehicle (PBS) was administered at time points as in Figure 1A. (D) Normalized AUC analysis of curves in panel C. (E) Overlaid time courses showing ankle joint diameter changes in 3 groups of mice. (F) Normalized AUC analysis of curves in panel E. (G) Biochemical assays of H2O2 level in WT+MSU+Veh, WT+MSU+AOS and Nrf2-/-+MSU+AOS groups of mice. (H&I) Western blots examining NLRP3 and IL-1β expressions in ankle joint tissues. *p<0.05, **p<0.01 vs. WT+MSU+Veh group. #p<0.05, ##p<0.01 vs. WT+ MSU+AOS group. n = 4-6 mice/group. Two-way ANOVA followed by Tukey's post hoc test was used for panel D&F. Unpaired Student's t test was used for panel C. One-way ANOVA followed by Tukey's post hoc test was used for others.
Figure 8
Figure 8
AOS3 treatment reduces inflammatory cell infiltrations in ankle joints of gouty arthritis model mice. (A) Representative pictures showing H&E staining of ankle tissues from Control+Veh, MSU+Veh and MSU+AOS groups of mice. Bottom panel shows the enlarged field depicted by black boxes on the top. (B) Summary of the number of inflammatory cells infiltrated per observation field. (C) The amount of cell abundance in ankle joint calculated by ssGSEA score of each cluster based on marker genes using RNA-Seq dataset in Figure 4. (D) The strategy of generating Ly6G-IRES-GFP knock-in mouse line. (E) Representative pictures showing fluorescence of Ly6G-GFP+ neutrophils in ankle tissue sections of Ly6G-IRES-GFP knock-in mouse from Control+Veh, MSU+Veh and MSU+AOS group. (F) Summary of the number of Ly6g-GFP+ cells per observation field. Scale bar indicated 50 μm. (G) Summary data showing MPO activity assay. n=6 mice/group. *p<0.01, **p<0.01 vs. Control+Veh. #p<0.05, ##p<0.01 vs. MSU+Veh group. One-way ANOVA followed by Tukey's post hoc test was used for panels B, F&G.
Figure 9
Figure 9
AOS3 reduces the enhanced TRPV1 channel activity in DRG neurons and reduced neuropeptide release in the inflamed ankle joints of gouty arthritis model mice (A) Cartoon showing the procedure for Ca2+ imaging and current clamp on dissociated DRG neurons and ELISA test on ankle joint tissues. (B) Pseudo-color images from Fura-2-based ratiometric Ca2+ imaging showing the Ca2+ responses in DRG neurons in response to TRPV1 specific agonist capsaicin (Cap, 300 nM) in the Control+Veh, MSU+Veh, and MSU+AOS groups. KCl (50 mM) was perfused at the end to determine all active DRG neurons. Scale bar indicates 50 μm. (C-E) Overlaid Ca2+ imaging traces of DRG neurons isolated from three groups. DRG neurons were perfused with capsaicin, followed with KCl. The arrows indicate the time point of drug application. (F) Summary of Δ increase in peak Ca2+ transients triggered by capsaicin of 3 groups. n=100 neurons/group. (G) Summarized percentage of capsaicin responsive DRG neurons in each observation field from 3 groups of mice. n=5-6 tests/group. (H-J) Representative action potentials (APs) elicited by application of capsaicin (100 nM) in 3 groups recorded by current clamp mode. (K) Summary of the Δ increase in the No. of APs elicited by capsaicin (100 nM) in DRG neurons of 3 groups. 25, 25 and 28 neurons were included in Control+Veh, MSU+Veh, and MSU+AOS groups, respectively. (L) Summary of membrane potential depolarization triggered by applying capsaicin (100 nM) in DRG neurons of 3 groups. 25, 25 and 28 neurons were included in Control+Veh, MSU+Veh, and MSU+AOS groups, respectively. (M&N) ELISA test of CGRP and SP levels in ankle joint tissues. n = 5-6 tests/group. **p<0.01 vs. Control+Veh. #p<0.05, ##p<0.01vs. MSU+Veh group. One-way ANOVA followed by Tukey's post hoc test was used for analysis.

Similar articles

Cited by

References

    1. Dalbeth N, Choi HK, Joosten LAB, Khanna PP, Matsuo H, Perez-Ruiz F. et al. Gout. Nat Rev Dis Primers. 2019;5:69. - PubMed
    1. Dalbeth N, Haskard DO. Mechanisms of inflammation in gout. Rheumatology (Oxford) 2005;44:1090–6. - PubMed
    1. Topiwala A, Mankia K, Bell S, Webb A, Ebmeier KP, Howard I. et al. Association of gout with brain reserve and vulnerability to neurodegenerative disease. Nat Commun. 2023;14:2844. - PMC - PubMed
    1. Terkeltaub R. Update on gout: new therapeutic strategies and options. Nat Rev Rheumatol. 2010;6:30–8. - PubMed
    1. Dehlin M, Jacobsson L, Roddy E. Global epidemiology of gout: prevalence, incidence, treatment patterns and risk factors. Nat Rev Rheumatol. 2020;16:380–90. - PubMed

Publication types

MeSH terms