. 2024 May 19;14(8):3104-3126.
doi: 10.7150/thno.96163. eCollection 2024.

Single-cell analyses reveal evolution mimicry during the specification of breast cancer subtype

Affiliations

Single-cell analyses reveal evolution mimicry during the specification of breast cancer subtype

Zhi-Jie Gao et al. Theranostics. .

Abstract

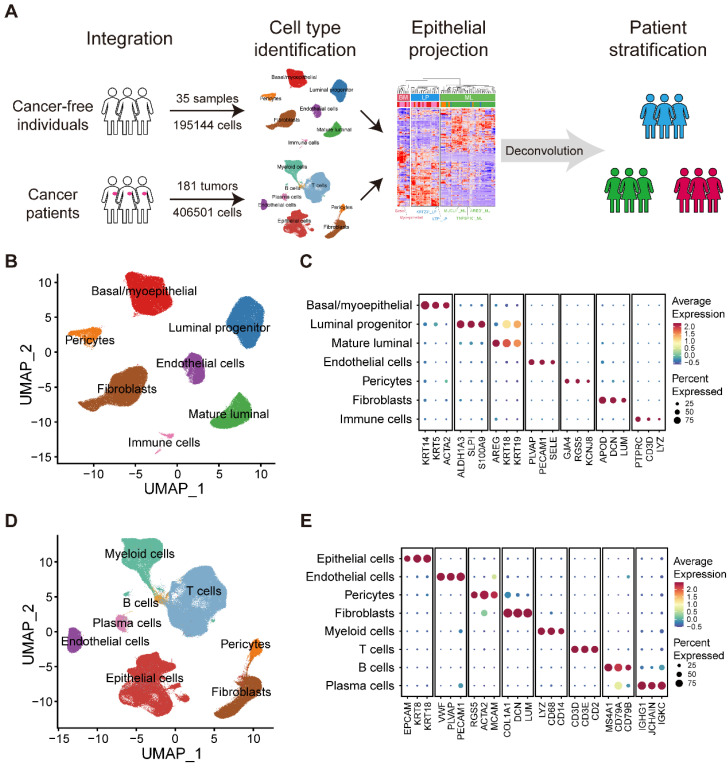
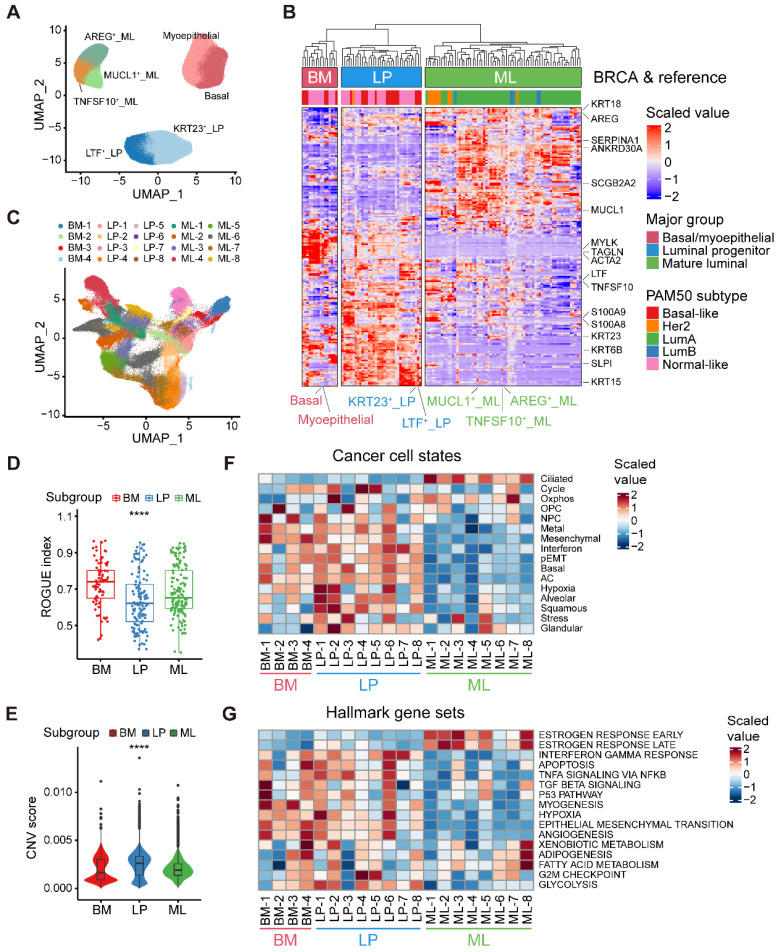
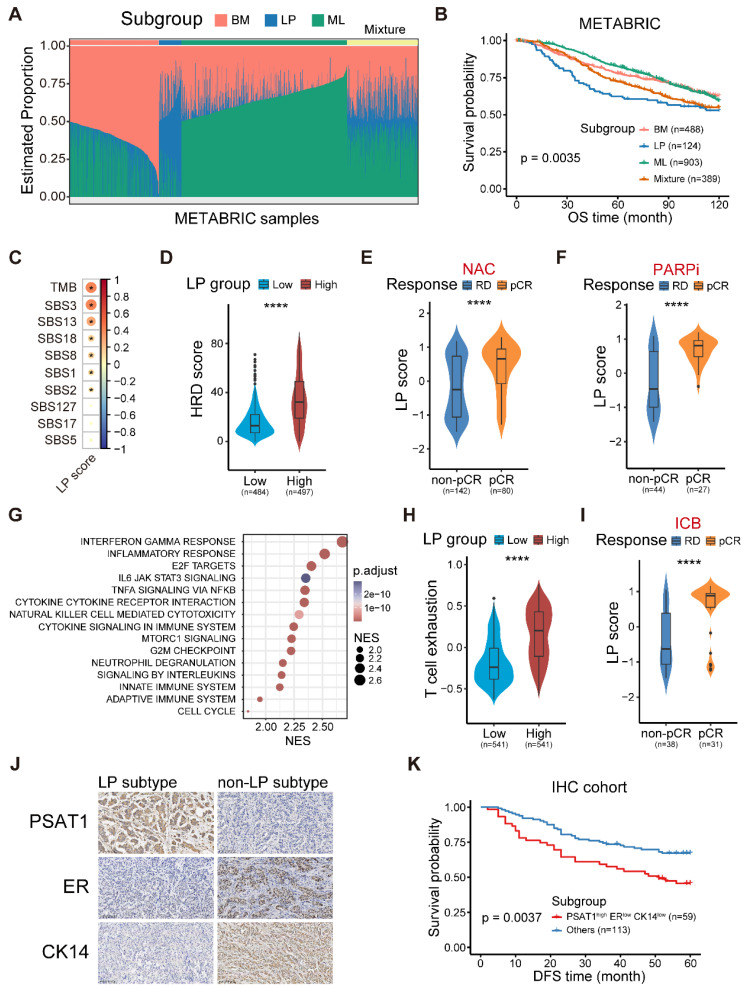
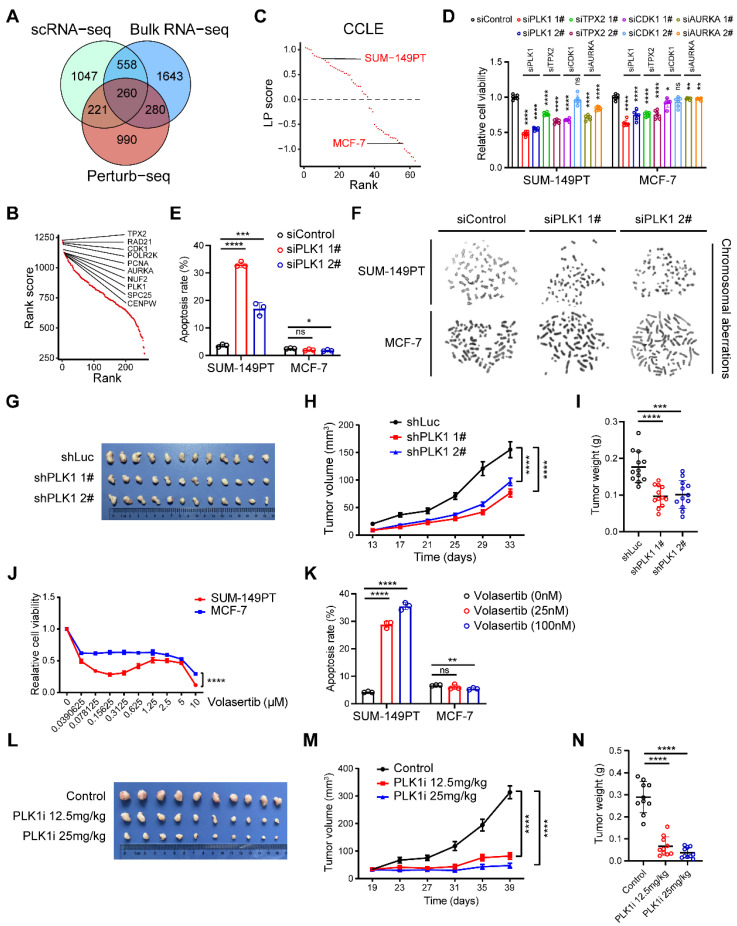
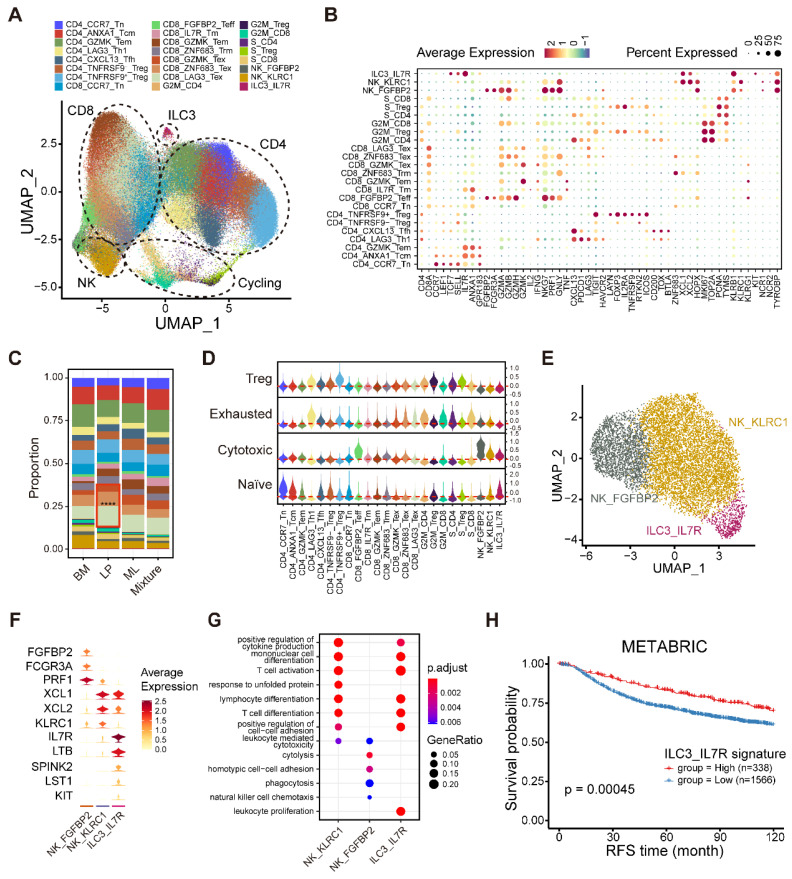
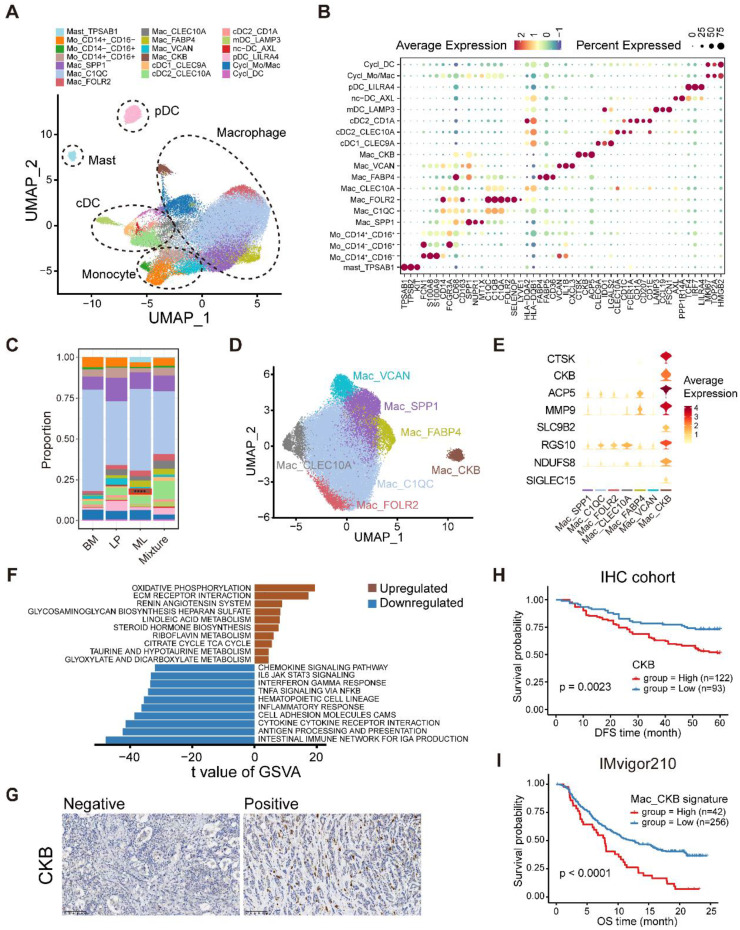
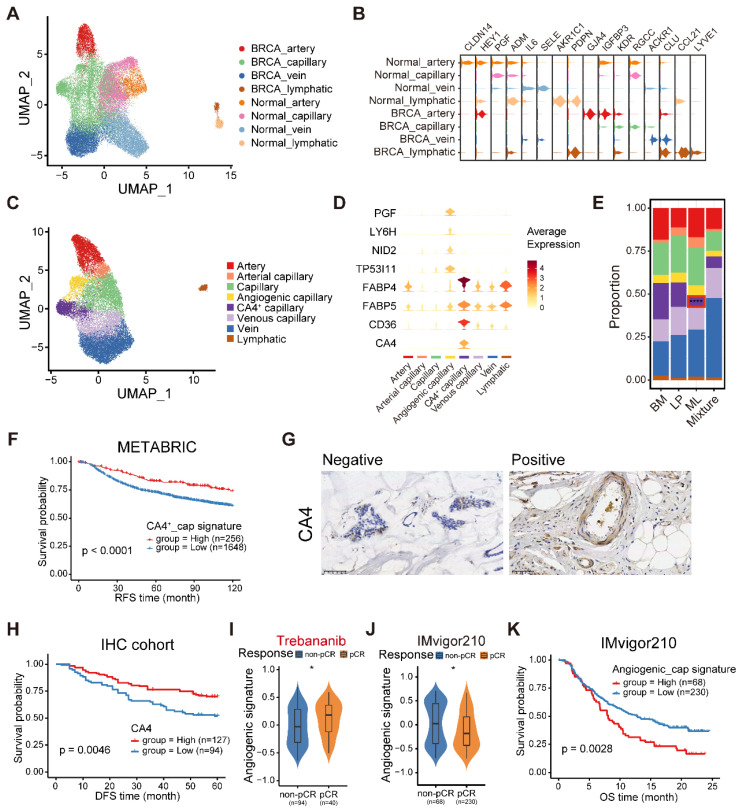
Background: The stem or progenitor antecedents confer developmental plasticity and unique cell identities to cancer cells via genetic and epigenetic programs. A comprehensive characterization and mapping of the cell-of-origin of breast cancer using novel technologies to unveil novel subtype-specific therapeutic targets is still absent. Methods: We integrated 195,144 high-quality cells from normal breast tissues and 406,501 high-quality cells from primary breast cancer samples to create a large-scale single-cell atlas of human normal and cancerous breasts. Potential heterogeneous origin of malignant cells was explored by contrasting cancer cells against reference normal epithelial cells. Multi-omics analyses and both in vitro and in vivo experiments were performed to screen and validate potential subtype-specific treatment targets. Novel biomarkers of identified immune and stromal cell subpopulations were validated by immunohistochemistry in our cohort. Results: Tumor stratification based on cancer cell-of-origin patterns correlated with clinical outcomes, genomic aberrations and diverse microenvironment constitutions. We found that the luminal progenitor (LP) subtype was robustly associated with poor prognosis, genomic instability and dysfunctional immune microenvironment. However, the LP subtype patients were sensitive to neoadjuvant chemotherapy (NAC), PARP inhibitors (PARPi) and immunotherapy. The LP subtype-specific target PLK1 was investigated by both in vitro and in vivo experiments. Besides, large-scale single-cell profiling of breast cancer inspired us to identify a range of clinically relevant immune and stromal cell subpopulations, including subsets of innate lymphoid cells (ILCs), macrophages and endothelial cells. Conclusion: The present single-cell study revealed the cellular repertoire and cell-of-origin patterns of breast cancer. Combining single-cell and bulk transcriptome data, we elucidated the evolution mimicry from normal to malignant subtypes and expounded the LP subtype with vital clinical implications. Novel immune and stromal cell subpopulations of breast cancer identified in our study could be potential therapeutic targets. Taken together, Our findings lay the foundation for the precise prognostic and therapeutic stratification of breast cancer.

Keywords: breast cancer; molecular subtype; single-cell RNA-seq; tumor cell-of-origin; tumor microenvironment.


Conflict of interest statement

Competing Interests: The authors have declared that no competing interest exists.

Figures

Figure 1
Figure 1
Large-scale integrated cellular landscape of human normal and cancerous breasts. (A) Schematic diagram of the study design and analysis. (B) Integrated analysis of 195,144 cells from 35 normal breast tissues. (C) Bubble heatmap showing expression levels of selected signature genes in normal breast tissues. Dot size indicates fraction of expressing cells, colored based on average normalized expression levels. (D) Integrated analysis of 406,501 cells from 181 primary breast tumors. (E) Bubble heatmap showing expression levels of selected signature genes in breast tumors. Dot size indicates fraction of expressing cells, colored based on average normalized expression levels.
Figure 2
Figure 2
Alignment of breast cancer cells to normal breast epithelial cell subtypes. (A) UMAP plot showing the major lineages of epithelial cells in normal breast tissues. (B) Clustering of 115 breast tumor pseudobulk profiles combined with seven reference normal mammary epithelial pseudobulk profiles showing three major lineages based on the expression of common signature genes. (C) UMAP plot showing 20 breast tumor subpopulations within three major lineages of breast cancer cells. (D) Boxplot showing cell purity for breast cancer cells within three major lineages. Kruskal-Wallis test. (E) Violin plot showing distributions of CNV scores among breast cancer cells from three major lineages. Kruskal-Wallis test. (F) Heatmap showing different expression patterns of 16 recurrent cancer cell gene modules among 20 breast tumor subpopulations. (G) Heatmap showing different expression patterns of hallmark gene sets among 20 breast tumor subpopulations.
Figure 3
Figure 3
The molecular and clinical characteristics of LP subtype breast cancer. (A) Stacked bar plot showing the deconvolution result of breast tumors from the METABRIC cohort. Colors of the bars denote three cell lineages as shown in the legend. The y axis stands for the proportion of each cell lineage in a given bulk tumor sample. Within the x axis, each column represents one tumor case. The annotation bar above denotes the molecular subtypes of bulk tumors that are defined by the dominant cell lineage within each tumor, where yellow represents the mixture of multiple cell lineages. (B) Kaplan-Meier plot showing worse clinical outcome in LP subtype patients within the METABRIC cohort. P value is calculated using the log-rank test. (C) Spearman correlation between LP score and diverse mutational signatures. Correlations with P < 0.05 are marked with an asterisk. (D) Violin plot comparing the HRD score between LP-low and LP-high breast tumors in TCGA. Unpaired two-sided Wilcoxon test. (E) Violin plot comparing the expression level of LP score of breast tumors with different responses to NAC treatment. Unpaired two-sided Wilcoxon test. (F) Violin plot comparing the expression level of LP score of breast tumors with different responses to PARP inhibitor treatment in the I-SPY2 cohort. Unpaired two-sided Wilcoxon test. (G) Bubble heatmap showing up-regulated pathways enriched in breast tumors with high LP proportion via GSEA. Dot size indicates the normalized enrichment score (NES), colored based on the adjusted P value. (H) Violin plot comparing the T cell exhausted signature score between LP-low and LP-high breast tumors in TCGA. Unpaired two-sided Wilcoxon test. (I) Violin plot comparing the expression level of LP score of breast cancer patients with different responses to anti-PD1 treatment. Unpaired two-sided Wilcoxon test. (J) Immunohistochemistry of breast tissue microarray for PSAT1, ER and CK14. (K) LP subtype of breast cancer patients with PSAT1high/ERlow/CK14low were associated with poor DFS. P value is calculated using the log-rank test.
Figure 4
Figure 4
Identification of potential therapeutic targets in the LP subtype breast cancer. (A) Venn diagram illustrating unique and shared genes driving chromosomal instability within LP subtype breast cancer identified by scRNA-seq, bulk RNA-seq and Perturb-seq data. (B) Scatter plot showing the rank scores of 260 common genes identified by scRNA-seq, bulk RNA-seq and Perturb-seq data. The top 10 genes are highlighted. (C) Scatter plot showing the LP scores of diverse breast cancer cell lines in CCLE. The SUM-149PT and MCF-7 cell lines are highlighted. (D) Levels of relative cell viability of selected candidate genes (PLK1, TPX2, CDK1 and AURKA) knockdown in the SUM-149PT and MCF-7 cells. (E) Levels of apoptosis rate of SUM-149PT and MCF-7 cells with PLK1 knockdown. (F) Representative images of Giemsa staining of PLK1 knockdown and control vector in the SUM-149PT and MCF-7 cells. (G) The picture of SUM-149PT tumors with PLK1 knockdown and control vector. (H) Tumor growth curves of mice that were injected with SUM-149PT cells with PLK1 knockdown and control vector. (I) Weight distributions of SUM-149PT tumors with PLK1 knockdown and control vector are shown. (J) The curve showing the relative cell viability of SUM-149PT and MCF-7 cells following treatment with volasertib at various doses. (K) Levels of apoptosis rate of SUM-149PT and MCF-7 cells following treatment with volasertib at high and low doses. (L) The picture of SUM-149PT tumors following treatment with volasertib at high and low doses and control vector. (M) Tumor growth curves of mice that were injected with SUM-149PT tumors following treatment with volasertib at high and low doses and control vector. (N) Weight distributions of SUM-149PT tumors following treatment with volasertib at high and low doses and control vector.
Figure 5
Figure 5
Integrated analyses of lymphocytes, NK cells and ILCs. (A) UMAP plot showing diverse subsets of T cells and ILCs. (B) Bubble heatmap showing expression levels of selected signature genes in T cells and ILCs. Dot size indicates fraction of expressing cells, colored based on average normalized expression levels. (C) Bar chart showing the relative proportion of major T/ILC cell types in different molecular subtypes. (D) Violin plot showing representative naïve, cytotoxic, exhausted and Treg signatures in diverse T/ILC subsets. Dashed red line denotes the median module score. (E) UMAP plot showing three main subsets of NK/ILC cells. (F) Violin plot showing expression levels of selected signature genes in NK/ILC cells. (G) GO enrichment analysis using the top 50 significantly expressed genes of each NK/ILC subset. (H) Kaplan-Meier plot showing better clinical outcome in breast cancer patients with higher composition of ILC3_IL7R subset within the METABRIC cohort. P value is calculated using the log-rank test.
Figure 6
Figure 6
Myeloid cell heterogeneity in breast cancer. (A) UMAP plot showing diverse subsets of myeloid cells. (B) Bubble heatmap showing expression levels of selected signature genes in myeloid cells. Dot size indicates fraction of expressing cells, colored based on average normalized expression levels. (C) Bar chart showing the relative proportion of major myeloid cell types in different molecular subtypes. (D) UMAP plot showing seven main subsets of macrophages. (E) Violin plot showing expression levels of selected signature genes in macrophages. (F) Bar plot showing different pathways enriched in CKB+ macrophages scored per cell by GSVA. t values are calculated with limma regression. (G) Immunohistochemistry of breast tissue microarray for CKB. (H) Kaplan-Meier plot showing worse clinical outcome in breast cancer patients with higher expression of CKB within our IHC cohort. P value is calculated using the log-rank test. (I) Kaplan-Meier plot showing worse clinical outcome in patients receiving anti-PD1 treatment with higher composition of CKB+ macrophage subset in the IMvigor210 dataset. P value is calculated using the log-rank test.
Figure 7
Figure 7
The endothelial cellular landscape in normal and cancerous breast tissues. (A) UMAP plot showing diverse subsets of ECs from normal and cancerous breast tissues. (B) Violin plot showing expression levels of selected signature genes in ECs from normal and cancerous breast tissues. (C) UMAP plot showing diverse subsets of breast cancer ECs. (D) Violin plot showing expression levels of selected signature genes in breast cancer ECs. (E) Bar chart showing the relative proportion of major breast cancer EC types in different molecular subtypes. (F) Kaplan-Meier plot showing better clinical outcome in breast cancer patients with higher composition of CA4+ capillary subset within the METABRIC cohort. P value is calculated using the log-rank test. (G) Immunohistochemistry of breast tissue microarray for CA4. (H) Kaplan-Meier plot showing worse clinical outcome in breast cancer patients with higher expression of CA4 within our IHC cohort. P value is calculated using the log-rank test. (I) Violin plot comparing the expression level of angiogenic capillary cell marker genes in breast cancer patients with different responses to antiangiogenic treatment in the I-SPY2 cohort. Unpaired two-sided Wilcoxon test. (J) Violin plot comparing the expression composition of angiogenic capillary subset in breast cancer patients with different responses to anti-PD1 treatment. Unpaired two-sided Wilcoxon test. (K) Kaplan-Meier plot showing worse clinical outcome in patients receiving anti-PD1 treatment with higher composition of angiogenic capillary subset in the IMvigor210 dataset. P value is calculated using the log-rank test.

References

    1. Wu SZ, Al-Eryani G, Roden DL, Junankar S, Harvey K, Andersson A. et al. A single-cell and spatially resolved atlas of human breast cancers. Nat Genet. 2021;53:1334–1347. - PMC - PubMed
    1. Liu SQ, Gao ZJ, Wu J, Zheng HM, Li B, Sun S. et al. Single-cell and spatially resolved analysis uncovers cell heterogeneity of breast cancer. J Hematol Oncol. 2022;15:19. - PMC - PubMed
    1. Prat A, Perou CM. Mammary development meets cancer genomics. Nat Med. 2009;15:842–4. - PubMed
    1. Parker JS, Mullins M, Cheang MCU, Leung S, Voduc D, Vickery T. et al. Supervised Risk Predictor of Breast Cancer Based on Intrinsic Subtypes. J Clin Oncol. 2009;27:1160–7. - PMC - PubMed
    1. Thennavan A, Beca F, Xia Y, Garcia-Recio S, Allison K, Collins LC. et al. Molecular analysis of TCGA breast cancer histologic types. Cell Genomics. 2021;1:100067. - PMC - PubMed

Publication types

Substances