

Ephrin type-A receptor 2-antisense RNA1/2 promote proliferation and migration of MDA-MB-231 cells through EPHA2-dependent Ras signaling pathway mediated by MAPK8/JNK1, MAPK9/JNK2-NFATC2/NFAT1 and JUND
- PMID: 38855323
- PMCID: PMC11157115
- DOI: 10.3389/fmolb.2024.1402354
Ephrin type-A receptor 2-antisense RNA1/2 promote proliferation and migration of MDA-MB-231 cells through EPHA2-dependent Ras signaling pathway mediated by MAPK8/JNK1, MAPK9/JNK2-NFATC2/NFAT1 and JUND
Abstract
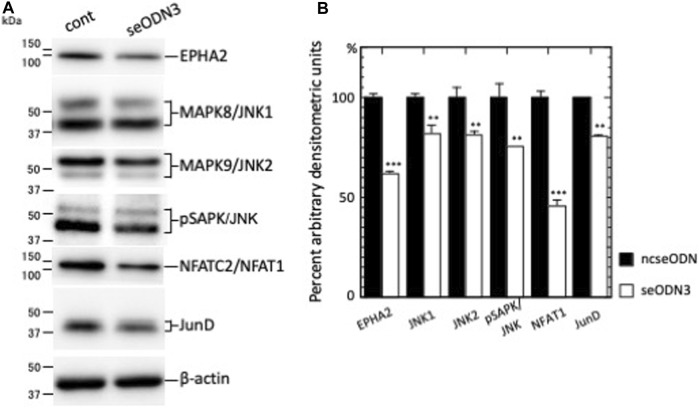
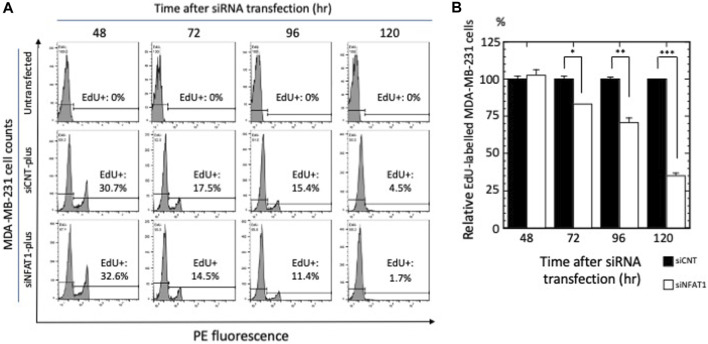
Ephrin type-A receptor 2 (EPHA2) is a receptor tyrosine kinase that is overexpressed in a variety of cancers, including breast cancer. EPHA2 expression may be causally related to tumorigenesis; therefore, it is important to understand how EPHA2 expression is regulated. We previously reported that EPHA2 antisense RNA (EPHA2-AS), a natural antisense transcript, is an important modulator of EPHA2 mRNA levels and hence production of EPHA2 protein. EPHA2-AS encodes two splice variants, EPHA2-AS1 and EPHA2-AS2. The two variants are constitutively expressed in a concordant manner with EPHA2 mRNA in human breast adenocarcinoma cell lines and in patient samples, with the highest levels detected in the basal-like/triple-negative molecular subtype of breast cancer cells. In this study, we investigated the mechanism of EPHA2-AS1/2 in triple-negative breast cancer using MDA-MB-231 cells. We performed RNA-seq transcriptome analyses of MDA-MB-231 cells treated with AHCC®, which suppressed expression of EPHA2-AS1/2 and EPHA2 mRNA, and EPHA2-AS1/2-silenced MDA-MB-231 cells. Bioinformatics analyses identified 545 overlapping differentially expressed genes that were significantly up- or down-regulated by these treatments. Subsequent functional enrichment analyses of the overlapping genes in combination with in vitro assays indicated that EPHA2-AS1/2 may promote the proliferation and migration of MDA-MB-231 cells through the EPHA2-dependent Ras signaling pathways mediated by MAPK8/JNK1, MAPK9/JNK2-NFATC2/NFAT1 (proliferation and migration) and JUND (migration). These results thus suggest that EPHA2-AS1/2 may represent a potential molecular target for triple-negative breast cancer treatment.
Keywords: EPHA2; EPHA2-AS1/2; JUND; MAPK8/JNK1; MAPK9/JNK2; NFATC2/NFAT1; migration; proliferation.
Copyright © 2024 Odaka, Sakamoto, Kumagai, Okuma, Nishizawa and Kimura.
Conflict of interest statement
The authors declare that the research was conducted in the absence of any commercial or financial relationships that could be construed as a potential conflict of interest. The author(s) declared that they were an editorial board member of Frontiers, at the time of submission. This had no impact on the peer review process and the final decision.
Figures


Similar articles
-
EPHA2 antisense RNA modulates EPHA2 mRNA levels in basal-like/triple-negative breast cancer cells.Biochimie. 2020 Dec;179:169-180. doi: 10.1016/j.biochi.2020.10.002. Epub 2020 Oct 3. Biochimie. 2020. PMID: 33022313
-
Long noncoding RNA AFAP1-AS1 promotes tumor progression and invasion by regulating the miR-2110/Sp1 axis in triple-negative breast cancer.Cell Death Dis. 2021 Jun 18;12(7):627. doi: 10.1038/s41419-021-03917-z. Cell Death Dis. 2021. PMID: 34145213 Free PMC article.
-
The receptor tyrosine kinase EphA2 is a direct target gene of hypermethylated in cancer 1 (HIC1).J Biol Chem. 2012 Feb 17;287(8):5366-78. doi: 10.1074/jbc.M111.329466. Epub 2011 Dec 19. J Biol Chem. 2012. PMID: 22184117 Free PMC article.
-
The natural antisense transcript HAS2-AS1 regulates breast cancer cells aggressiveness independently from hyaluronan metabolism.Matrix Biol. 2022 May;109:140-161. doi: 10.1016/j.matbio.2022.03.009. Epub 2022 Apr 6. Matrix Biol. 2022. PMID: 35395387
-
EphA2: A promising therapeutic target in breast cancer.J Genet Genomics. 2021 Apr 20;48(4):261-267. doi: 10.1016/j.jgg.2021.02.011. Epub 2021 Mar 29. J Genet Genomics. 2021. PMID: 33962882 Review.
Cited by
-
The neuroscience in breast cancer: Current insights and clinical opportunities.Heliyon. 2025 Jan 27;11(3):e42293. doi: 10.1016/j.heliyon.2025.e42293. eCollection 2025 Feb 15. Heliyon. 2025. PMID: 39975839 Free PMC article. Review.
References
-
- Brantley-Sieders D. M., Zhuang G., Hicks D., Fang W. B., Hwang Y., Cates J. M., et al. (2008). The receptor tyrosine kinase EphA2 promotes mammary adenocarcinoma tumorigenesis and metastatic progression in mice by amplifying ErbB2 signaling. J. Clin. Invest. 118, 64–78. 10.1172/jci33154 - DOI - PMC - PubMed
LinkOut - more resources
Full Text Sources
Research Materials
Miscellaneous