

Application of Chest CT Imaging Feature Model in Distinguishing Squamous Cell Carcinoma and Adenocarcinoma of the Lung
- PMID: 38855330
- PMCID: PMC11162187
- DOI: 10.2147/CMAR.S462951
Application of Chest CT Imaging Feature Model in Distinguishing Squamous Cell Carcinoma and Adenocarcinoma of the Lung
Abstract
Purpose: In situations where pathological acquisition is difficult, there is a lack of consensus on distinguishing between adenocarcinoma and squamous cell carcinoma from imaging images, and each doctor can only make judgments based on their own experience. This study aims to extract imaging features of chest CT, extract sensitive factors through logistic univariate and multivariate analysis, and model to distinguish between lung squamous cell carcinoma and lung adenocarcinoma.
Methods: We downloaded chest CT scans with clear diagnosis of adenocarcinoma and squamous cell carcinoma from The Cancer Imaging Archive (TCIA), extracted 19 imaging features by a radiologist and a thoracic surgeon, including location, spicule, lobulation, cavity, vacuolar sign, necrosis, pleural traction sign, vascular bundle sign, air bronchogram sign, calcification, enhancement degree, distance from pulmonary hilum, atelectasis, pulmonary hilum and bronchial lymph nodes, mediastinal lymph nodes, interlobular septal thickening, pulmonary metastasis, adjacent structures invasion, pleural effusion. Firstly, we apply the glm function of R language to perform logistic univariate analysis on all variables to select variables with P < 0.1. Then, perform logistic multivariate analysis on the selected variables to obtain a predictive model. Next, use the roc function in R language to calculate the AUC value and draw the ROC curve, use the val.prob function in R language to draw the Calibrat curve, and use the rmda package in R language to draw the DCA curve and clinical impact curve. At the same time, 45 patients diagnosed with lung squamous cell carcinoma and lung adenocarcinoma through surgery or biopsy in the Radiotherapy Department and Thoracic Surgery Department of our hospital from 2023 to 2024 were included in the validation group. The chest CT features were jointly determined and recorded by the two doctors mentioned above and included in the validation group. The included image feature data are complete and does not require preprocessing, so directly entering statistical calculations. Perform ROC curves, calibration curves, DCA, and clinical impact curves in the validation group to further validate the predictive model. If the predictive model performs well in the validation group, further draw a nomogram to demonstrate.
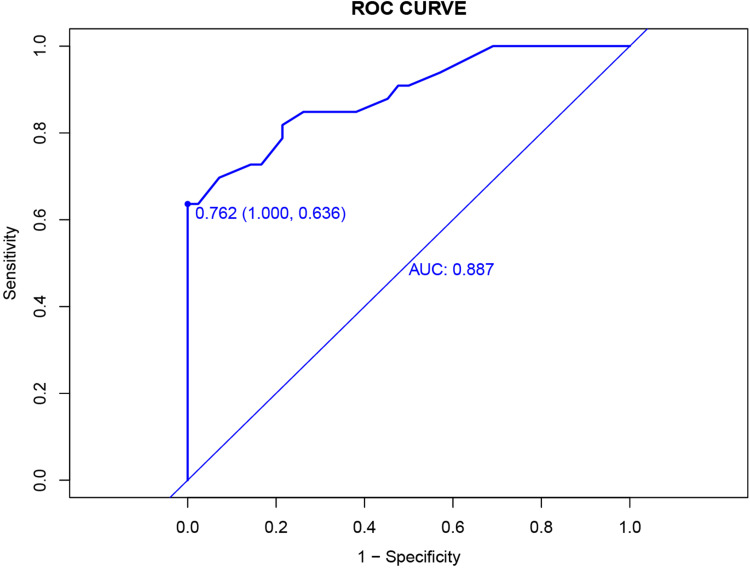
Results: This study extracted 19 imaging features from the chest CT scans of 75 patients downloaded from TCIA and finally selected 18 complete data for analysis. First, univariate analysis and multivariate analysis were performed, and a total of 5 variables were obtained: spicule, necrosis, air bronchogram Sign, atelectasis, pulmonary hilum and bronchial lymph nodes. After conducting modeling analysis with AUC = 0.887, a validation group was established using clinical cases from our hospital, Draw ROC curve with AUC = 0.865 in the validation group, evaluate the accuracy of the model through Calibrate calibration curve, evaluate the reliability of the model in clinical practice through DCA curve, and further evaluate the practicality of the model in clinical practice through clinical impact curve.
Conclusion: It is possible to extract influential features from ordinary chest CT scans to determine lung adenocarcinoma and squamous cell carcinoma. The model we have set up performs well in terms of discrimination, accuracy, reliability, and practicality.
Keywords: LSCC; LUAD; image features; lung cancer; predict.
© 2024 Liu et al.
Conflict of interest statement
The authors declare that there is no conflict of interests.
Figures


Similar articles
-
The influence of image selection and segmentation on the extraction of lung cancer imaging radiomics features using 3D-Slicer software.BMC Cancer. 2025 Apr 17;25(1):728. doi: 10.1186/s12885-025-14094-z. BMC Cancer. 2025. PMID: 40247266 Free PMC article.
-
[Standard technical specifications for methacholine chloride (Methacholine) bronchial challenge test (2023)].Zhonghua Jie He He Hu Xi Za Zhi. 2024 Feb 12;47(2):101-119. doi: 10.3760/cma.j.cn112147-20231019-00247. Zhonghua Jie He He Hu Xi Za Zhi. 2024. PMID: 38309959 Chinese.
-
[Multivariate Analysis of Solid Pulmonary Nodules Smaller than 1 cm in Distinguishing Lung Cancer from Intrapulmonary Lymph Nodes].Zhongguo Fei Ai Za Zhi. 2021 Feb 20;24(2):94-98. doi: 10.3779/j.issn.1009-3419.2021.102.05. Epub 2021 Jan 29. Zhongguo Fei Ai Za Zhi. 2021. PMID: 33508896 Free PMC article. Chinese.
-
Development and validation of a radiomic nomogram based on pretherapy dual-energy CT for distinguishing adenocarcinoma from squamous cell carcinoma of the lung.Front Oncol. 2022 Nov 23;12:949111. doi: 10.3389/fonc.2022.949111. eCollection 2022. Front Oncol. 2022. PMID: 36505773 Free PMC article.
-
Construction and validation of a clinical differentiation model between peripheral lung cancer and solitary pulmonary tuberculosis.Lung Cancer. 2024 Jul;193:107851. doi: 10.1016/j.lungcan.2024.107851. Epub 2024 Jun 8. Lung Cancer. 2024. PMID: 38905954
Cited by
-
Development and validation of a Nomogram to predict postoperative flap necrosis risk in breast cancer patients undergoing modified radical mastectomy.Am J Cancer Res. 2025 Mar 15;15(3):1291-1306. doi: 10.62347/DYFF7059. eCollection 2025. Am J Cancer Res. 2025. PMID: 40226471 Free PMC article.
-
The influence of image selection and segmentation on the extraction of lung cancer imaging radiomics features using 3D-Slicer software.BMC Cancer. 2025 Apr 17;25(1):728. doi: 10.1186/s12885-025-14094-z. BMC Cancer. 2025. PMID: 40247266 Free PMC article.
-
Development and validation of a nomogram model for predicting lymph node metastasis in early non-small-cell lung cancer.Am J Cancer Res. 2025 Jan 15;15(1):299-310. doi: 10.62347/JBKV3746. eCollection 2025. Am J Cancer Res. 2025. PMID: 39949938 Free PMC article.
-
Integrative machine learning and bioinformatics analysis to identify cellular senescence-related genes and potential therapeutic targets in ulcerative colitis and colorectal cancer.Front Bioinform. 2025 Jul 28;5:1599098. doi: 10.3389/fbinf.2025.1599098. eCollection 2025. Front Bioinform. 2025. PMID: 40791849 Free PMC article.
-
Construction of a prognostic risk model for clear cell renal cell carcinomas based on centrosome amplification-related genes.Mol Genet Genomics. 2025 Mar 13;300(1):30. doi: 10.1007/s00438-025-02237-7. Mol Genet Genomics. 2025. PMID: 40075035 Free PMC article.
References
-
- The National Comprehensive Cancer Network. Non-small cell lung cancer; 2024. Available from: https://www.nccn.org/guidelines/guidelines-detail?category=1&id=1450. Accessed May 28, 2024.
-
- Han R, Arjal R, Dong J, et al. Three dimensional texture analysis of noncontrast chest CT in differentiating solitary solid lung squamous cell carcinoma from adenocarcinoma and correlation to immunohistochemical markers. Thoracic Cancer. 2020;11(11):3099–3106. doi:10.1111/1759-7714.13592 - DOI - PMC - PubMed
LinkOut - more resources
Full Text Sources
