

Chapter 2: My Hearing Aid Isn't Working Like It Used to…
- PMID: 38855342
- PMCID: PMC11161216
- DOI: 10.1055/s-0044-1786523
Chapter 2: My Hearing Aid Isn't Working Like It Used to…
Abstract
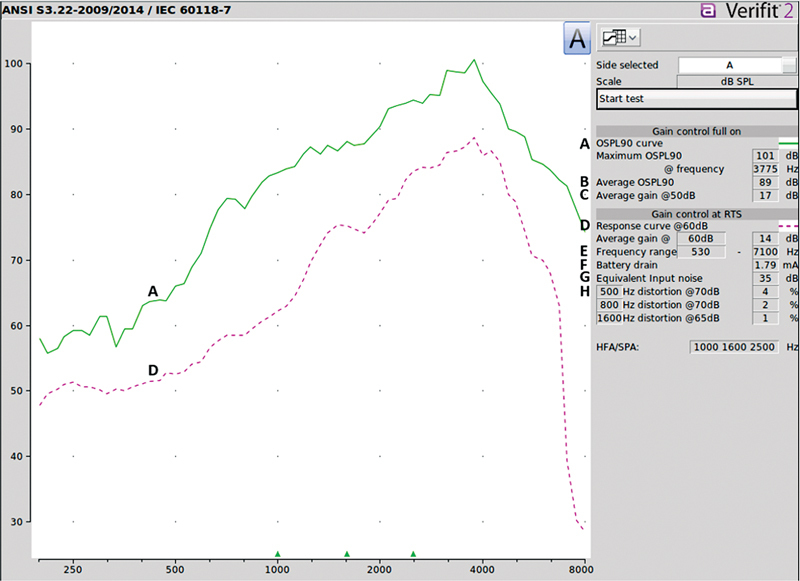
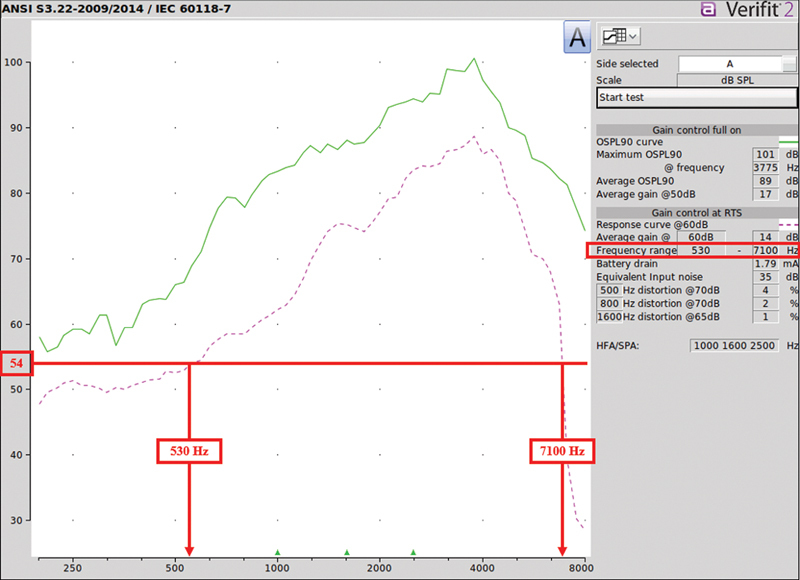
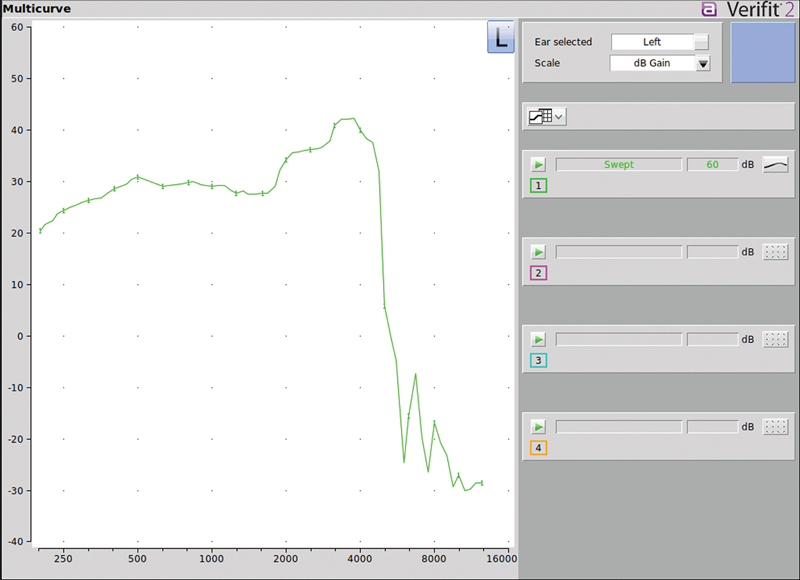
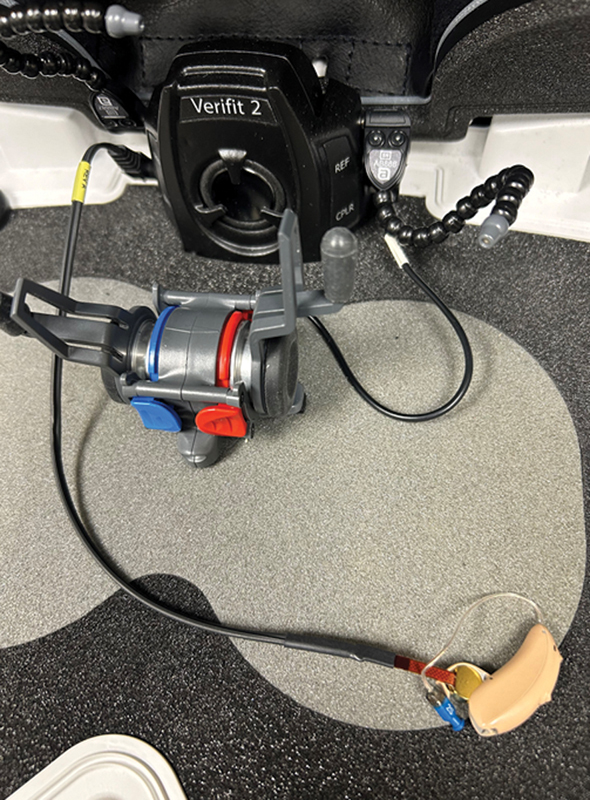
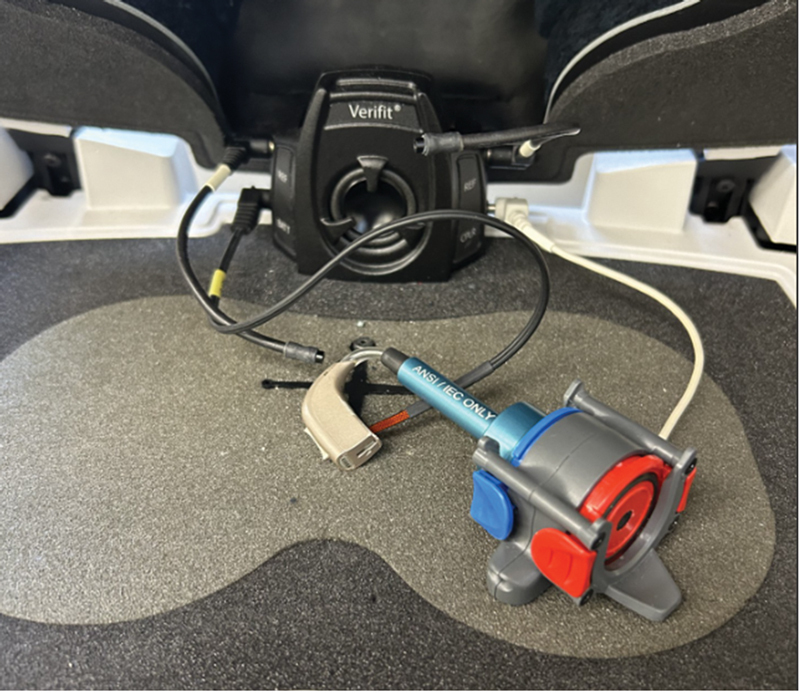
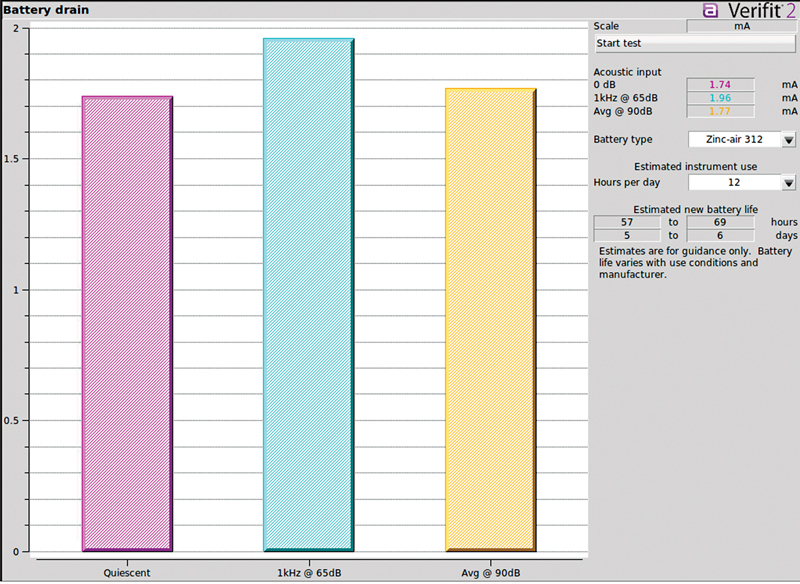
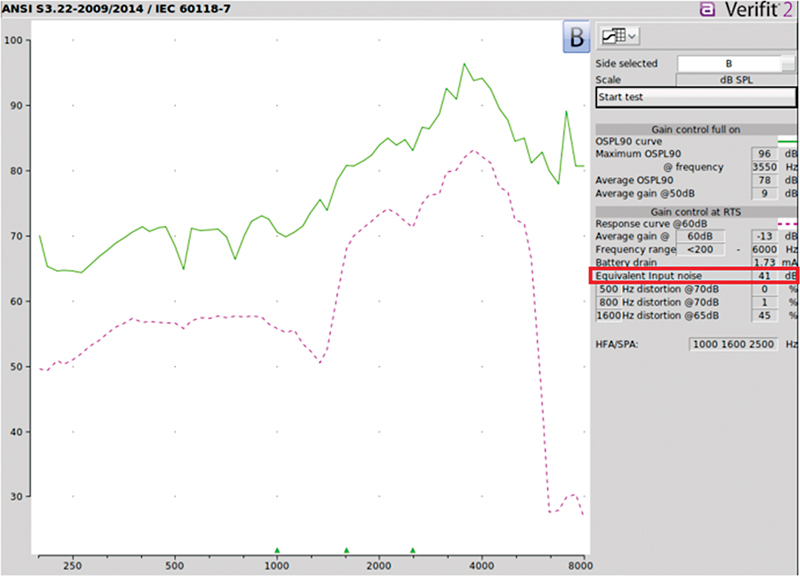
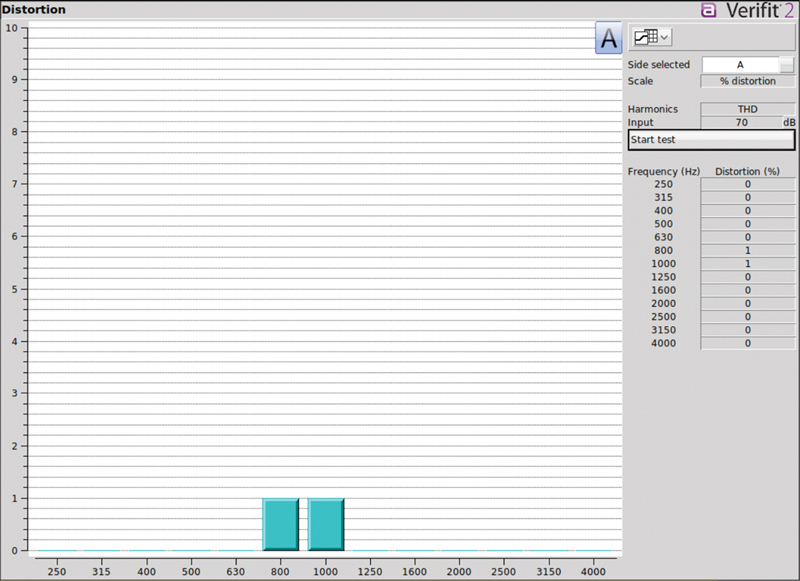
This chapter will take you through specific patient complaints and the test box measures you can use to address these complaints. These measurements give you data that aid in your decision making about what is wrong, if anything, with the hearing aid and how you might address the problem. Before we discuss specific patient complaints and problems, let us review the American National Standard Institute (ANSI) guidelines for hearing aid testing in a test box.
Keywords: ANSI Hearing Aid Standard; battery drain; hearing aid gain; hearing aid troubleshooting; total harmonic distortion.
The Author(s). This is an open access article published by Thieme under the terms of the Creative Commons Attribution-NonDerivative-NonCommercial License, permitting copying and reproduction so long as the original work is given appropriate credit. Contents may not be used for commercial purposes, or adapted, remixed, transformed or built upon. ( https://creativecommons.org/licenses/by-nc-nd/4.0/ ).
Conflict of interest statement
Conflict of Interest None declared.
Figures

Similar articles
-
Chapter 3: Setting the Hearing Aid Response and Verifying Signal Processing and Features in the Test Box.Semin Hear. 2024 May 17;45(2):172-204. doi: 10.1055/s-0044-1786522. eCollection 2024 May. Semin Hear. 2024. PMID: 38855347 Free PMC article. Review.
-
Chapter 1: Introduction and Getting Ready for Hearing Aid Test Box Measures.Semin Hear. 2024 May 13;45(2):145-152. doi: 10.1055/s-0044-1786504. eCollection 2024 May. Semin Hear. 2024. PMID: 38855344 Free PMC article. Review.
-
Probe microphone measurements: 20 years of progress.Trends Amplif. 2001 Jun;5(2):35-68. doi: 10.1177/108471380100500202. Trends Amplif. 2001. PMID: 25425897 Free PMC article.
-
Do Modern Hearing Aids Meet ANSI Standards?J Am Acad Audiol. 2016 Sep;27(8):619-27. doi: 10.3766/jaaa.15027. J Am Acad Audiol. 2016. PMID: 27564440
-
High-frequency audibility: the effects of audiometric configuration, stimulus type, and device.J Am Acad Audiol. 2015 Feb;26(2):128-37. doi: 10.3766/jaaa.26.2.3. J Am Acad Audiol. 2015. PMID: 25690773 Free PMC article.
References
-
- American National Standards Institute/Acoustical Society of America (2020). Specification of Hearing aid Characteristics (S3.22–2014 [R2020])Accessed April 10, 2024 at:https://webstore.ansi.org/standards/asa/ansiasas3222014r2020
-
- Dillon H. Turramurra, Australia: Boomerang Press; 2001. Hearing Aids.