

The Pan-Cancer Analysis Uncovers the Prognostic and Immunotherapeutic Significance of CD19 as an Immune Marker in Tumor
- PMID: 38855424
- PMCID: PMC11162214
- DOI: 10.2147/IJGM.S459914
The Pan-Cancer Analysis Uncovers the Prognostic and Immunotherapeutic Significance of CD19 as an Immune Marker in Tumor
Abstract
Background: The specific cytotoxic effects of anti-CD19 chimeric antigen receptor (CAR) T-cell therapy have led to impressive outcomes in individuals previously treated for B-cell malignancies. However, the specific biological role of CD19(+) target cells, which exert antitumor immunity against some solid tumors, remains to be elucidated.
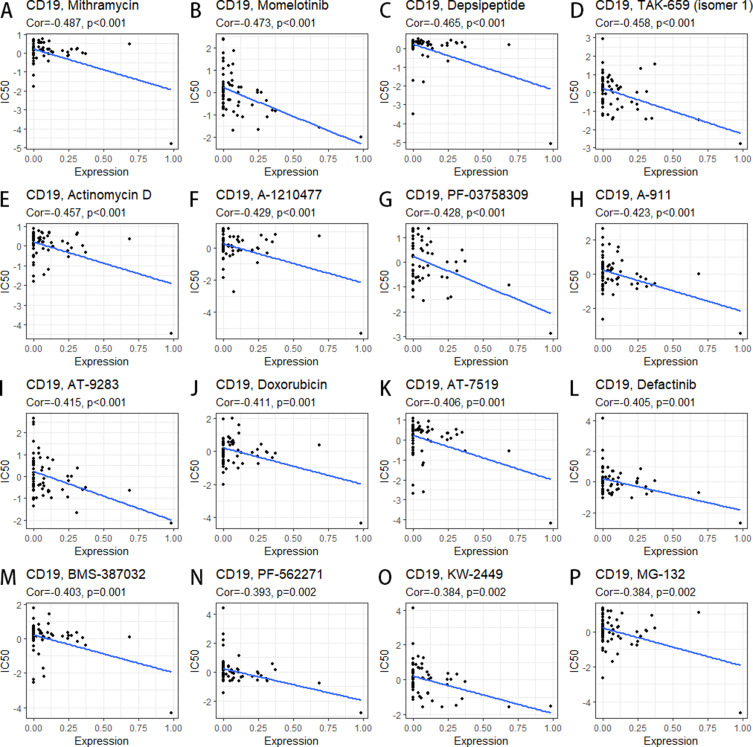
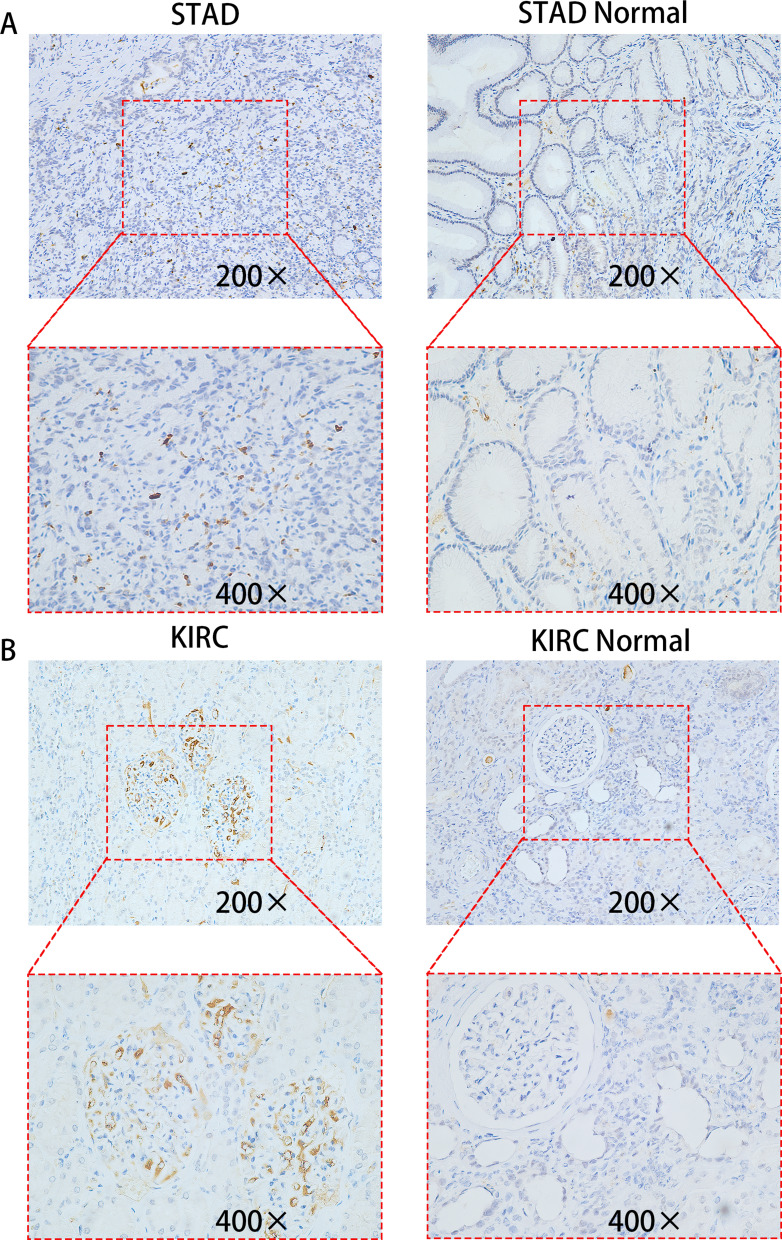
Methods: We collected information regarding the level of CD19 mRNA and protein expression from various databases including The Cancer Genome Atlas (TCGA), Tumor Immune Estimation Resource (TIMER), Genotype-Tissue Expression (GTEx), and Human Protein Atlas (HPA) for both tumor and normal samples. To evaluate the patient's prognosis according to CD19 expression, a Kaplan-Meier (KM) analysis and univariate Cox regression were performed. Furthermore, using the Estimation of Stromal and Immune Cells in Malignant Tumor Tissues Using the Expression Data (ESTIMATE) algorithm, we estimated the ratio of immune cells infiltrating malignant tumor tissues. Afterward, the GSCALite repository was employed to evaluate the vulnerability of tumors expressing CD19 to drugs used in chemotherapy. To validate the results in clinical samples of certain cancer types, immunohistochemistry was then performed.
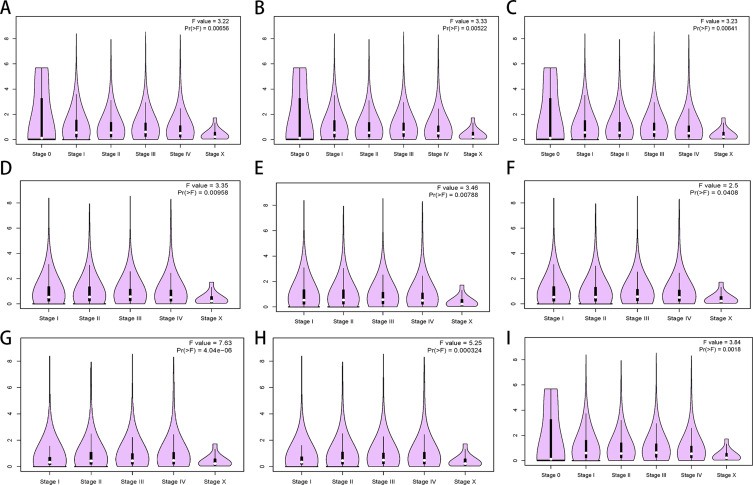
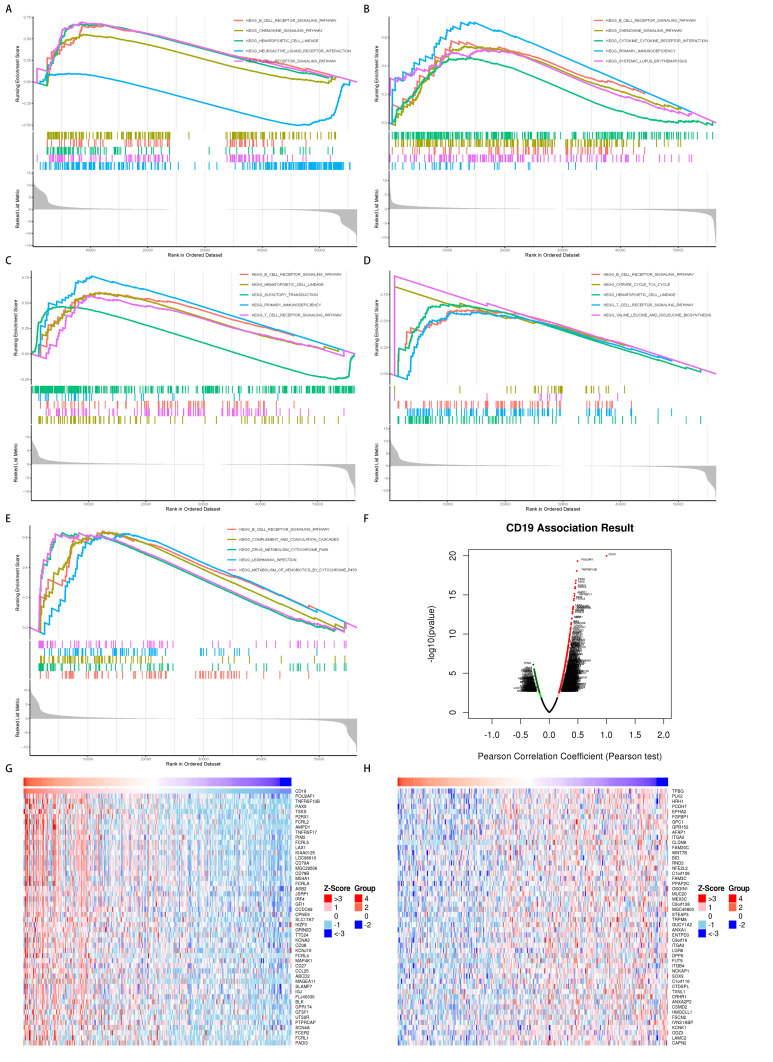
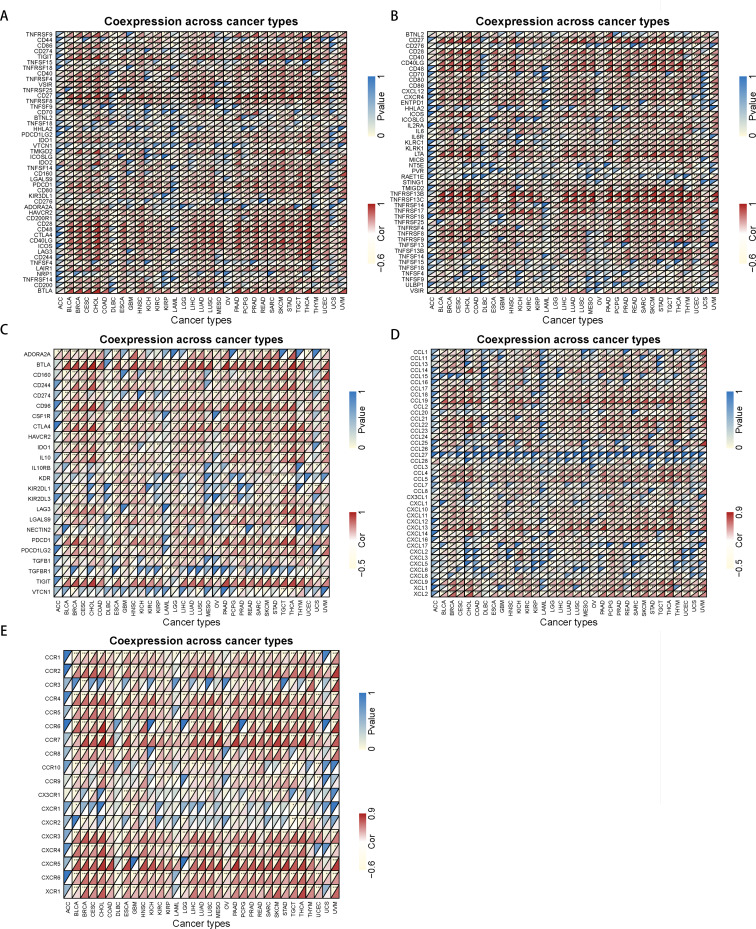
Results: Most tumor types exhibited CD19 expression differently, apart from colon adenocarcinoma (COAD). The early diagnostic value of CD19 has been demonstrated in 9 different tumor types, and the overexpression of CD19 has the potential to extend the survival duration of patients. Multiple tumors showed a positive correlation between CD19 expression and tumor mutation burden (TMB), microsatellite instability (MSI), and ESTIMATE score. Furthermore, a direct association was discovered between the expression of CD19 and the infiltration of immune cells, particularly in cases of breast invasive carcinoma (BRCA). Moreover, CD19 is highly sensitive to a variety of chemotherapy drugs.
Conclusion: The study reveals the potential of CD19 as both a predictive biomarker and a target for different cancer immunotherapies.
Keywords: CD19; biomarker; immune infiltration; pan-cancer; prognosis.
© 2024 Wei et al.
Conflict of interest statement
The authors report no conflicts of interest in this work.
Figures


Similar articles
-
Pan-Cancer Analysis of PARP1 Alterations as Biomarkers in the Prediction of Immunotherapeutic Effects and the Association of Its Expression Levels and Immunotherapy Signatures.Front Immunol. 2021 Aug 31;12:721030. doi: 10.3389/fimmu.2021.721030. eCollection 2021. Front Immunol. 2021. PMID: 34531868 Free PMC article.
-
Identification of SHCBP1 as a potential biomarker involving diagnosis, prognosis, and tumor immune microenvironment across multiple cancers.Comput Struct Biotechnol J. 2022 Jun 18;20:3106-3119. doi: 10.1016/j.csbj.2022.06.039. eCollection 2022. Comput Struct Biotechnol J. 2022. PMID: 35782736 Free PMC article.
-
Siglec-9, a Putative Immune Checkpoint Marker for Cancer Progression Across Multiple Cancer Types.Front Mol Biosci. 2022 Mar 17;9:743515. doi: 10.3389/fmolb.2022.743515. eCollection 2022. Front Mol Biosci. 2022. PMID: 35372497 Free PMC article.
-
Contemplating the prognostic and therapeutic potential of CD19: a comprehensive analysis across diverse cancer types.Am J Transl Res. 2024 Nov 15;16(11):6365-6383. doi: 10.62347/KJGS9928. eCollection 2024. Am J Transl Res. 2024. PMID: 39678610 Free PMC article.
-
Clinical and immunological characteristics of TGM3 in pan-cancer: A potential prognostic biomarker.Front Genet. 2023 Jan 6;13:993438. doi: 10.3389/fgene.2022.993438. eCollection 2022. Front Genet. 2023. PMID: 36685895 Free PMC article.
Cited by
-
Nanotherapeutic strategies exploiting biological traits of cancer stem cells.Bioact Mater. 2025 Apr 3;50:61-94. doi: 10.1016/j.bioactmat.2025.03.016. eCollection 2025 Aug. Bioact Mater. 2025. PMID: 40242505 Free PMC article. Review.
References
LinkOut - more resources
Full Text Sources
