. 2024 May 23:12:1270698.
doi: 10.3389/fpubh.2024.1270698. eCollection 2024.

Mendelian randomization shows causal effects of birth weight and childhood body mass index on the risk of frailty

Affiliations

Mendelian randomization shows causal effects of birth weight and childhood body mass index on the risk of frailty

Junhao Cui et al. Front Public Health. .

Abstract

Background: The association between birth weight and childhood body mass index (BMI) and frailty has been extensively studied, but it is currently unclear whether this relationship is causal.

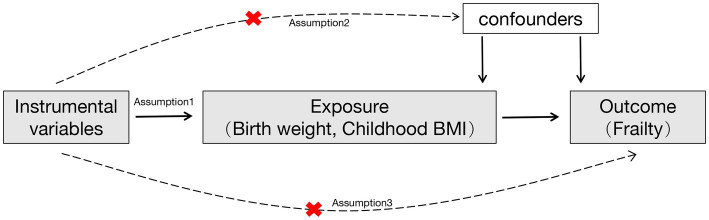
Methods: We utilized a two-sample Mendelian randomization (MR) methodology to investigate the causal effects of birth weight and childhood BMI on the risk of frailty. Instrumental variables (p < 5E-08) strongly associated with own birth weight (N = 298,142 infants), offspring birth weight (N = 210,267 mothers), and childhood BMI (N = 39,620) were identified from large-scale genomic data from genome-wide association studies (GWAS). The frailty status was assessed using the frailty index, which was derived from comprehensive geriatric assessments of older adults within the UK Biobank and the TwinGene database (N = 175,226).

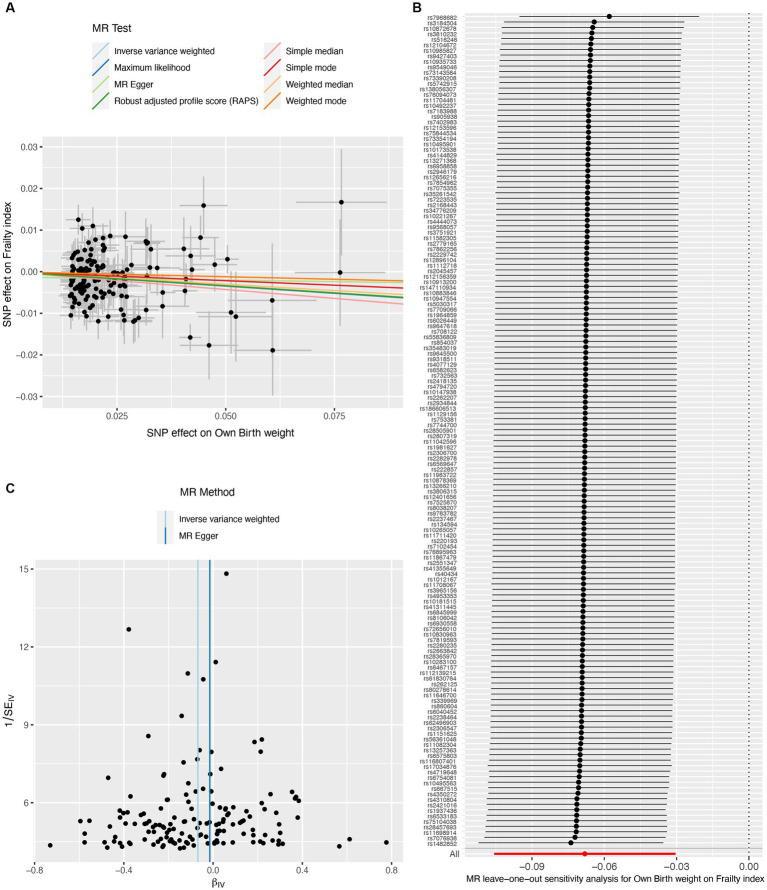
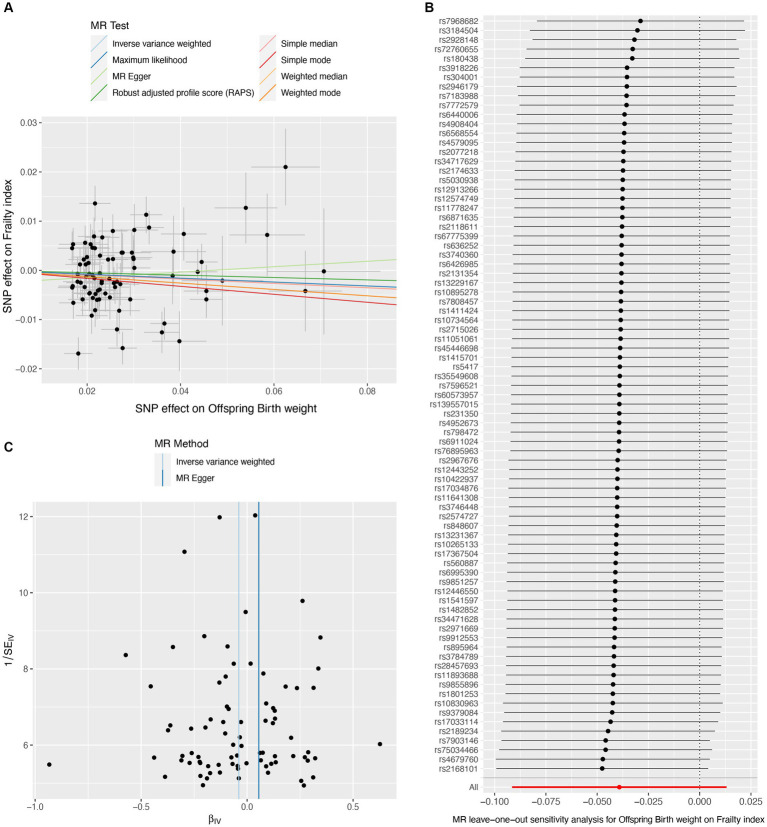
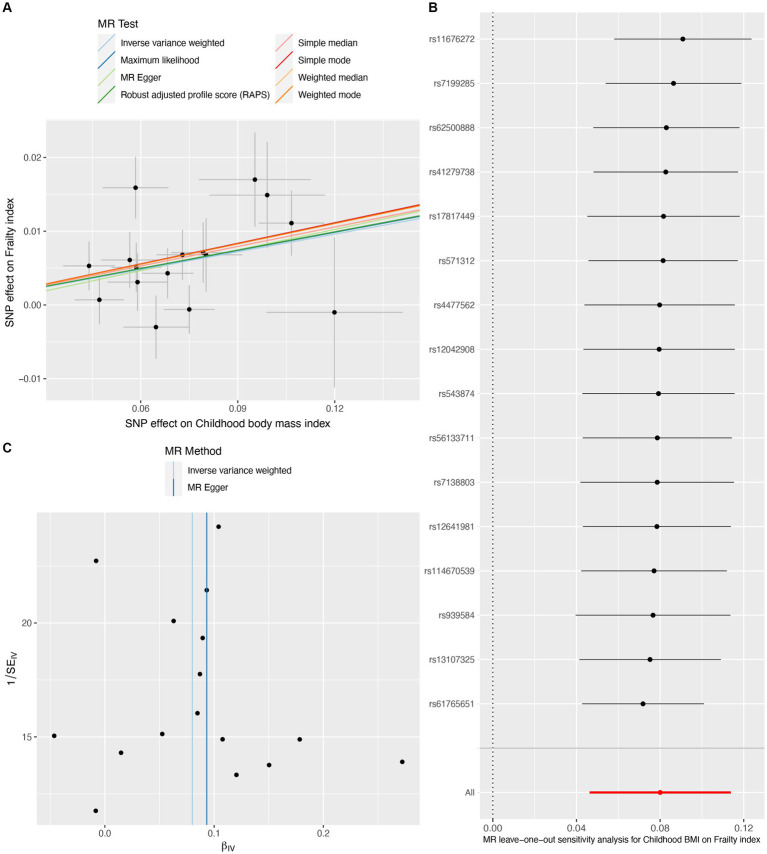
Results: Genetically predicted one standard deviation (SD) increase in own birth weight, but not offspring birth weight (maternal-specific), was linked to a decreased frailty index (β per SD increase = -0.068, 95%CI = -0.106 to -0.030, p = 3.92E-04). Conversely, genetically predicted one SD increase in childhood BMI was associated with an elevated frailty index (β per SD increase = 0.080, 95%CI = 0.046 to 0.114, p = 3.43E-06) with good statistical power (99.8%). The findings remained consistent across sensitivity analyses and showed no horizontal pleiotropy (p > 0.05).

Conclusion: This MR study provides evidence supporting a causal relationship between lower birth weight, higher childhood BMI, and an increased risk of frailty.

Keywords: Mendelian randomization; birth weight; body mass index; childhood; frailty.


Conflict of interest statement

The authors declare that the research was conducted in the absence of any commercial or financial relationships that could be construed as a potential conflict of interest.

Figures

Figure 1
Figure 1
A flowchart of the study design. Red cross indicated that the instrumental variables were not associated with confounders and the outcome.
Figure 2
Figure 2
Causal estimates of own birth weight (fetal effect) on frailty index. The scatter plot displayed the causal effects of each single nucleotide polymorphism (SNP) on fetal birth weight and frailty index (A). Leave-one-out plot for the causal relationship between fetal birth weight and frailty index (B). The funnel plot showed the symmetry of the instrumental variables (C). MR, Mendelian randomization.
Figure 3
Figure 3
Causal estimates of offspring birth weight (maternal effect) on frailty index. The scatter plot displayed the causal effects of each single nucleotide polymorphism (SNP) on fetal birth weight and frailty index (A). Leave-one-out plot for the causal relationship between fetal birth weight and frailty index (B). The funnel plot showed the symmetry of the instrumental variables (C). MR, Mendelian randomization.
Figure 4
Figure 4
Causal estimates of childhood body mass index on frailty index. The scatter plot showed the causal effects of each single nucleotide polymorphism (SNP) on BMI and frailty index (A). Leave-one-out plot for the causal relationship between childhood BMI and frailty index (B). The funnel plot displayed the symmetry of the instrumental variables (C). MR, Mendelian randomization; BMI, body mass index.

Similar articles

Cited by

References

    1. Leme D, Alves E, Fattori A. Relationships between social, physical, and psychological factors in older persons: frailty as an outcome in network analysis. J Am Med Dir Assoc. (2020) 21:1309–1315.e4. doi: 10.1016/j.jamda.2020.02.005, PMID: - DOI - PubMed
    1. Hoogendijk EO, Afilalo J, Ensrud KE, Kowal P, Onder G, Fried LP. Frailty: implications for clinical practice and public health. Lancet. (2019) 394:1365–75. doi: 10.1016/S0140-6736(19)31786-6 - DOI - PubMed
    1. O'Caoimh R, Sezgin D, O'Donovan MR, Molloy DW, Clegg A, Rockwood K, et al. . Prevalence of frailty in 62 countries across the world: a systematic review and meta-analysis of population-level studies. Age Ageing. (2021) 50:96–104. doi: 10.1093/ageing/afaa219, PMID: - DOI - PubMed
    1. Haapanen MJ, Perälä MM, Salonen MK, Kajantie E, Simonen M, Pohjolainen P, et al. . Early life determinants of frailty in old age: the Helsinki birth cohort study. Age Ageing. (2018) 47:569–75. doi: 10.1093/ageing/afy052, PMID: - DOI - PubMed
    1. Haapanen MJ, Perälä MM, Osmond C, Salonen MK, Kajantie E, Rantanen T, et al. . Infant and childhood growth and frailty in old age: the Helsinki birth cohort study. Aging Clin Exp Res. (2019) 31:717–21. doi: 10.1007/s40520-018-1011-0, PMID: - DOI - PMC - PubMed