

This is a preprint.
Categorization of 33 computational methods to detect spatially variable genes from spatially resolved transcriptomics data
- PMID: 38855546
- PMCID: PMC11160866
Categorization of 33 computational methods to detect spatially variable genes from spatially resolved transcriptomics data
Update in
-
Categorization of 34 computational methods to detect spatially variable genes from spatially resolved transcriptomics data.Nat Commun. 2025 Jan 29;16(1):1141. doi: 10.1038/s41467-025-56080-w. Nat Commun. 2025. PMID: 39880807 Free PMC article. Review.
Abstract
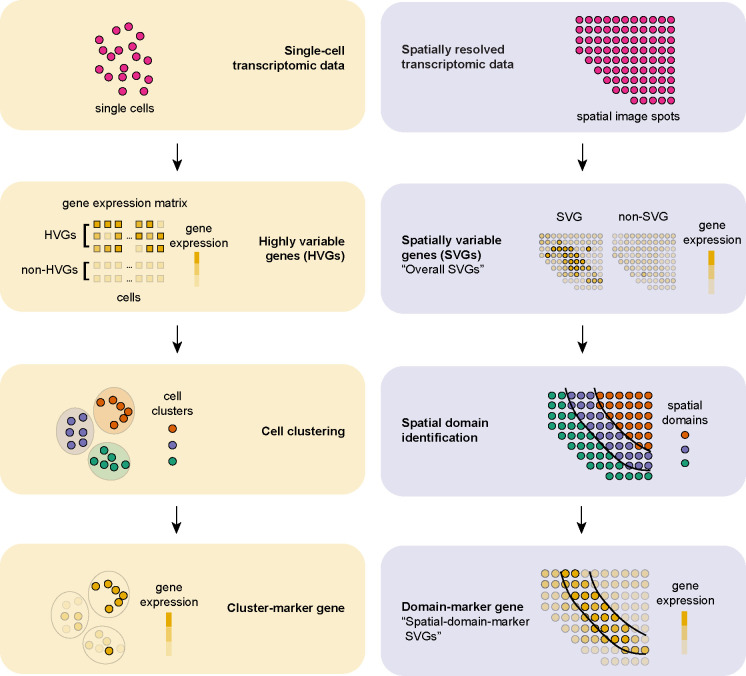
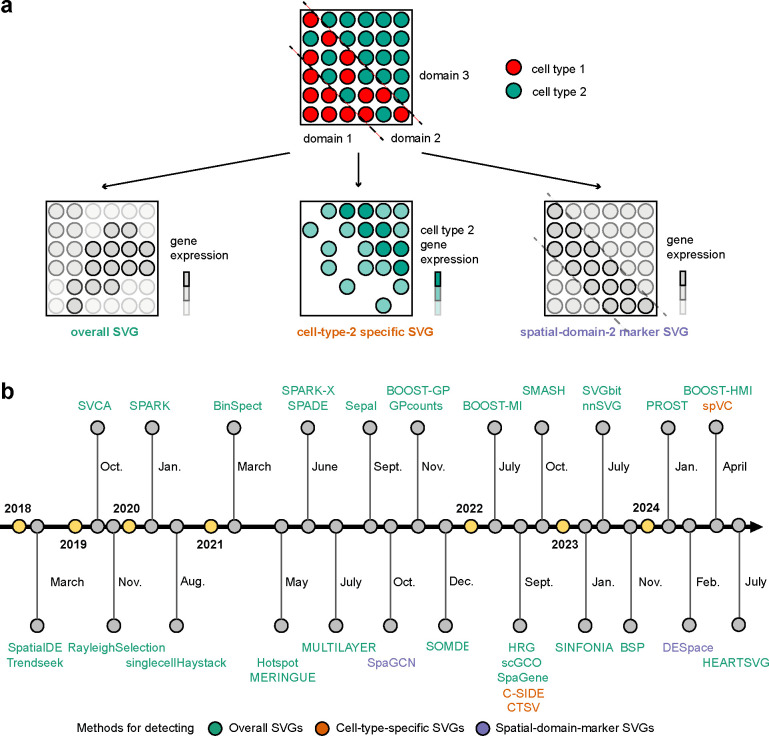
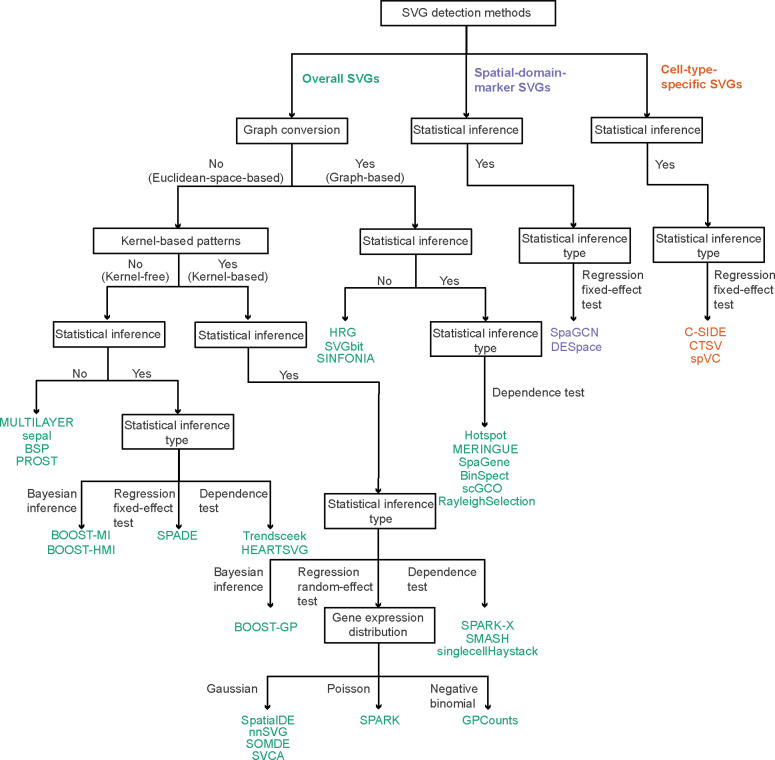
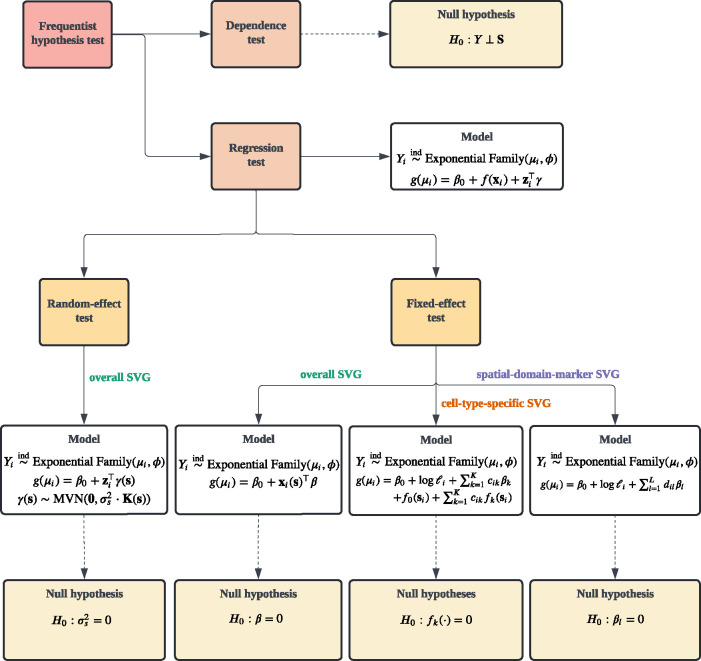
In the analysis of spatially resolved transcriptomics data, detecting spatially variable genes (SVGs) is crucial. Numerous computational methods exist, but varying SVG definitions and methodologies lead to incomparable results. We review 33 state-of-the-art methods, categorizing SVGs into three types: overall, cell-type-specific, and spatial-domain-marker SVGs. Our review explains the intuitions underlying these methods, summarizes their applications, and categorizes the hypothesis tests they use in the trade-off between generality and specificity for SVG detection. We discuss challenges in SVG detection and propose future directions for improvement. Our review offers insights for method developers and users, advocating for category-specific benchmarking.
Conflict of interest statement
Competing interests The authors declare no competing interests.
Figures
Similar articles
-
Categorization of 34 computational methods to detect spatially variable genes from spatially resolved transcriptomics data.Nat Commun. 2025 Jan 29;16(1):1141. doi: 10.1038/s41467-025-56080-w. Nat Commun. 2025. PMID: 39880807 Free PMC article. Review.
-
Benchmarking computational methods for detecting spatial domains and domain-specific spatially variable genes from spatial transcriptomics data.Nucleic Acids Res. 2025 Apr 10;53(7):gkaf303. doi: 10.1093/nar/gkaf303. Nucleic Acids Res. 2025. PMID: 40240000 Free PMC article.
-
SPACE: Spatially variable gene clustering adjusting for cell type effect for improved spatial domain detection.bioRxiv [Preprint]. 2024 Aug 25:2024.08.23.609477. doi: 10.1101/2024.08.23.609477. bioRxiv. 2024. PMID: 39229093 Free PMC article. Preprint.
-
Evaluating spatially variable gene detection methods for spatial transcriptomics data.Genome Biol. 2024 Jan 15;25(1):18. doi: 10.1186/s13059-023-03145-y. Genome Biol. 2024. PMID: 38225676 Free PMC article.
-
Recent advances in spatially variable gene detection in spatial transcriptomics.Comput Struct Biotechnol J. 2024 Feb 2;23:883-891. doi: 10.1016/j.csbj.2024.01.016. eCollection 2024 Dec. Comput Struct Biotechnol J. 2024. PMID: 38370977 Free PMC article. Review.
References
-
- Marx Vivien. Method of the year: spatially resolved transcriptomics. Nature methods, 18(1):9–14, 2021. - PubMed
-
- Ke R, Mignardi M, Pacureanu A, Svedlund J, Botling J, Wahlby C, and Nilsson M. In situ sequencing for RNA analysis in preserved tissue and cells. Nat Methods, 10:857–60, Sep 2013. - PubMed
Publication types
Grants and funding
LinkOut - more resources
Full Text Sources