

Rapid and accurate identification of stem cell differentiation stages via SERS and convolutional neural networks
- PMID: 38855654
- PMCID: PMC11161375
- DOI: 10.1364/BOE.519093
Rapid and accurate identification of stem cell differentiation stages via SERS and convolutional neural networks
Abstract
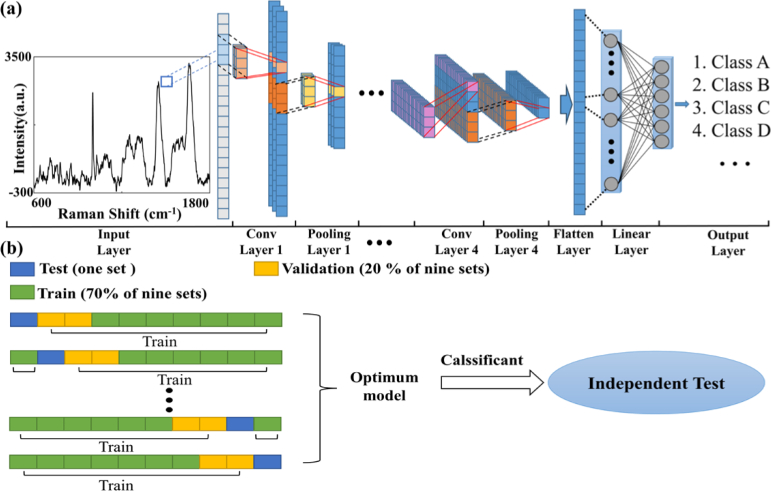
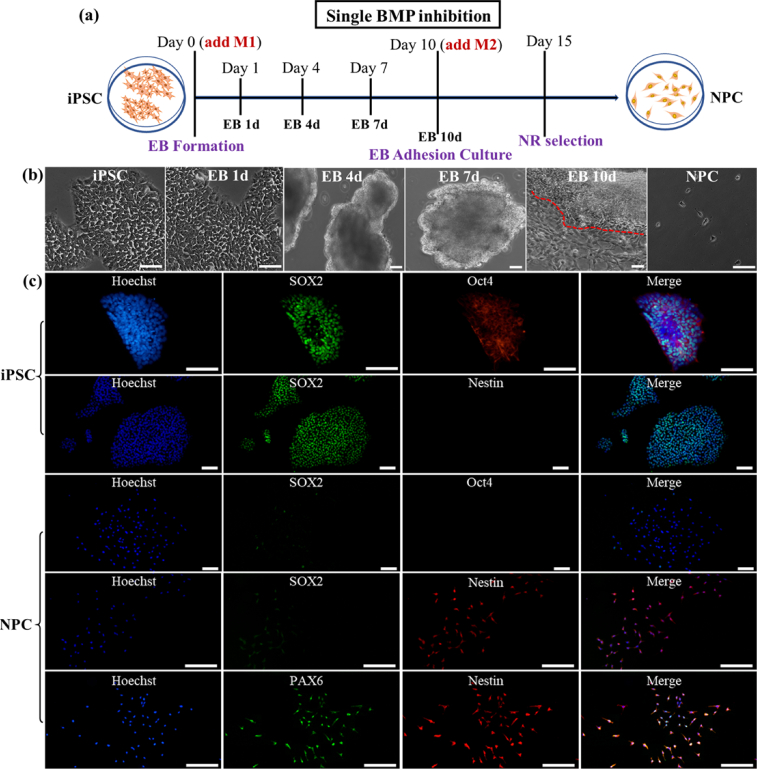
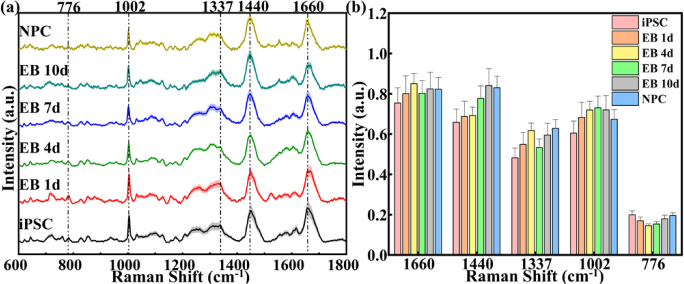
Monitoring the transition of cell states during induced pluripotent stem cell (iPSC) differentiation is crucial for clinical medicine and basic research. However, both identification category and prediction accuracy need further improvement. Here, we propose a method combining surface-enhanced Raman spectroscopy (SERS) with convolutional neural networks (CNN) to precisely identify and distinguish cell states during stem cell differentiation. First, mitochondria-targeted probes were synthesized by combining AuNRs and mitochondrial localization signal (MLS) peptides to obtain effective and stable SERS spectra signals at various stages of cell differentiation. Then, the SERS spectra served as input datasets, and their distinctive features were learned and distinguished by CNN. As a result, rapid and accurate identification of six different cell states, including the embryoid body (EB) stage, was successfully achieved throughout the stem cell differentiation process with an impressive prediction accuracy of 98.5%. Furthermore, the impact of different spectral feature peaks on the identification results was investigated, which provides a valuable reference for selecting appropriate spectral bands to identify cell states. This is also beneficial for shortening the spectral acquisition region to enhance spectral acquisition speed. These results suggest the potential for SERS-CNN models in quality monitoring of stem cells, advancing the practical applications of stem cells.
© 2024 Optica Publishing Group.
Conflict of interest statement
The authors declare no conflicts of interest related to this work.
Figures


Similar articles
-
SERS-ATB: A comprehensive database server for antibiotic SERS spectral visualization and deep-learning identification.Environ Pollut. 2025 May 15;373:126083. doi: 10.1016/j.envpol.2025.126083. Epub 2025 Mar 18. Environ Pollut. 2025. PMID: 40113206
-
Identification of Bacterial Pathogens at Genus and Species Levels through Combination of Raman Spectrometry and Deep-Learning Algorithms.Microbiol Spectr. 2022 Dec 21;10(6):e0258022. doi: 10.1128/spectrum.02580-22. Epub 2022 Oct 31. Microbiol Spectr. 2022. PMID: 36314973 Free PMC article.
-
Serum analysis based on SERS combined with 2D convolutional neural network and Gramian angular field for breast cancer screening.Spectrochim Acta A Mol Biomol Spectrosc. 2024 May 5;312:124054. doi: 10.1016/j.saa.2024.124054. Epub 2024 Feb 19. Spectrochim Acta A Mol Biomol Spectrosc. 2024. PMID: 38382221
-
Industrial wastewater source tracing: The initiative of SERS spectral signature aided by a one-dimensional convolutional neural network.Water Res. 2023 Apr 1;232:119662. doi: 10.1016/j.watres.2023.119662. Epub 2023 Jan 23. Water Res. 2023. PMID: 36738556
-
Recent Advances in Monitoring Stem Cell Status and Differentiation Using Nano-Biosensing Technologies.Nanomaterials (Basel). 2022 Aug 25;12(17):2934. doi: 10.3390/nano12172934. Nanomaterials (Basel). 2022. PMID: 36079970 Free PMC article. Review.
Cited by
-
Adaptive Raman spectral unmixing method based on Voigt peak compensation for quantitative analysis of cellular biochemical components.Biomed Opt Express. 2025 Feb 28;16(3):1284-1298. doi: 10.1364/BOE.553461. eCollection 2025 Mar 1. Biomed Opt Express. 2025. PMID: 40109542 Free PMC article.
References
LinkOut - more resources
Full Text Sources
Research Materials
Miscellaneous