

Collagen organization and structure in FBLN5-/- mice using label-free microscopy: implications for pelvic organ prolapse
- PMID: 38855688
- PMCID: PMC11161343
- DOI: 10.1364/BOE.518976
Collagen organization and structure in FBLN5-/- mice using label-free microscopy: implications for pelvic organ prolapse
Abstract
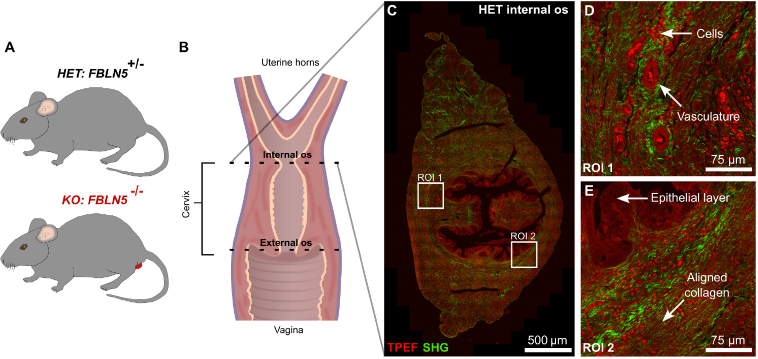
Pelvic organ prolapse (POP) is a gynecological disorder described by the descent of superior pelvic organs into or out of the vagina as a consequence of disrupted muscles and tissue. A thorough understanding of the etiology of POP is limited by the availability of clinically relevant samples, restricting longitudinal POP studies on soft-tissue biomechanics and structure to POP-induced models such as fibulin-5 knockout (FBLN5-/- ) mice. Despite being a principal constituent in the extracellular matrix, little is known about structural perturbations to collagen networks in the FBLN5-/- mouse cervix. We identify significantly different collagen network populations in normal and prolapsed cervical cross-sections using two label-free, nonlinear microscopy techniques. Collagen in the prolapsed mouse cervix tends to be more isotropic, and displays reduced alignment persistence via 2-D Fourier transform analysis of images acquired using second harmonic generation microscopy. Furthermore, coherent Raman hyperspectral imaging revealed elevated disorder in the secondary structure of collagen in prolapsed tissues. Our results underscore the need for in situ multimodal monitoring of collagen organization to improve POP predictive capabilities.
© 2024 Optica Publishing Group.
Conflict of interest statement
The authors declare no conflicts of interest.
Figures


Update of
-
Collagen organization and structure in FLBN5-/- mice using label-free microscopy: implications for pelvic organ prolapse.bioRxiv [Preprint]. 2024 Feb 1:2024.01.31.578106. doi: 10.1101/2024.01.31.578106. bioRxiv. 2024. Update in: Biomed Opt Express. 2024 Apr 05;15(5):2863-2875. doi: 10.1364/BOE.518976. PMID: 38352586 Free PMC article. Updated. Preprint.
Similar articles
-
Collagen organization and structure in FLBN5-/- mice using label-free microscopy: implications for pelvic organ prolapse.bioRxiv [Preprint]. 2024 Feb 1:2024.01.31.578106. doi: 10.1101/2024.01.31.578106. bioRxiv. 2024. Update in: Biomed Opt Express. 2024 Apr 05;15(5):2863-2875. doi: 10.1364/BOE.518976. PMID: 38352586 Free PMC article. Updated. Preprint.
-
Differential gene expression of extracellular-matrix-related proteins in the vaginal apical compartment of women with pelvic organ prolapse.Int Urogynecol J. 2019 Mar;30(3):439-446. doi: 10.1007/s00192-018-3637-z. Epub 2018 Mar 29. Int Urogynecol J. 2019. PMID: 29600404
-
Extracellular matrix proteases contribute to progression of pelvic organ prolapse in mice and humans.J Clin Invest. 2011 May;121(5):2048-59. doi: 10.1172/JCI45636. Epub 2011 Apr 25. J Clin Invest. 2011. PMID: 21519142 Free PMC article.
-
Role of Fibroblasts and Myofibroblasts on the Pathogenesis and Treatment of Pelvic Organ Prolapse.Biomolecules. 2022 Jan 6;12(1):94. doi: 10.3390/biom12010094. Biomolecules. 2022. PMID: 35053242 Free PMC article. Review.
-
International Urogynecological Consultation (IUC): pathophysiology of pelvic organ prolapse (POP).Int Urogynecol J. 2022 Jul;33(7):1699-1710. doi: 10.1007/s00192-022-05081-0. Epub 2022 Mar 10. Int Urogynecol J. 2022. PMID: 35267063 Review.
Cited by
-
Decoupling Phase Separation and Fibrillization Preserves Activity of Biomolecular Condensates.Res Sq [Preprint]. 2025 Apr 29:rs.3.rs-6405673. doi: 10.21203/rs.3.rs-6405673/v1. Res Sq. 2025. PMID: 40343340 Free PMC article. Preprint.
-
Decoupling Phase Separation and Fibrillization Preserves Activity of Biomolecular Condensates.bioRxiv [Preprint]. 2025 Mar 19:2025.03.18.643977. doi: 10.1101/2025.03.18.643977. bioRxiv. 2025. PMID: 40166274 Free PMC article. Preprint.
-
COL3A1 Gene Polymorphism and Its Impact on Female Pelvic Organ Prolapse.Med Sci Monit. 2025 Jan 16;31:e946367. doi: 10.12659/MSM.946367. Med Sci Monit. 2025. PMID: 39815606 Free PMC article. Review.
References
Grants and funding
LinkOut - more resources
Full Text Sources
Miscellaneous