

Characterization of the preweaned Holstein calf fecal microbiota prior to, during, and following resolution of uncomplicated gastrointestinal disease
- PMID: 38855768
- PMCID: PMC11157069
- DOI: 10.3389/fmicb.2024.1388489
Characterization of the preweaned Holstein calf fecal microbiota prior to, during, and following resolution of uncomplicated gastrointestinal disease
Abstract
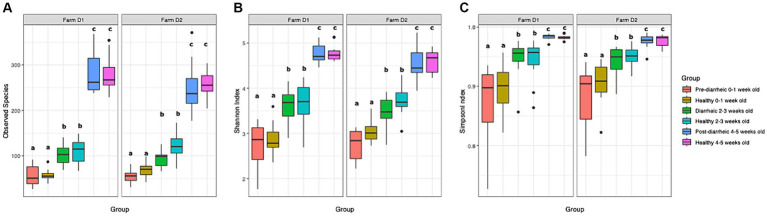
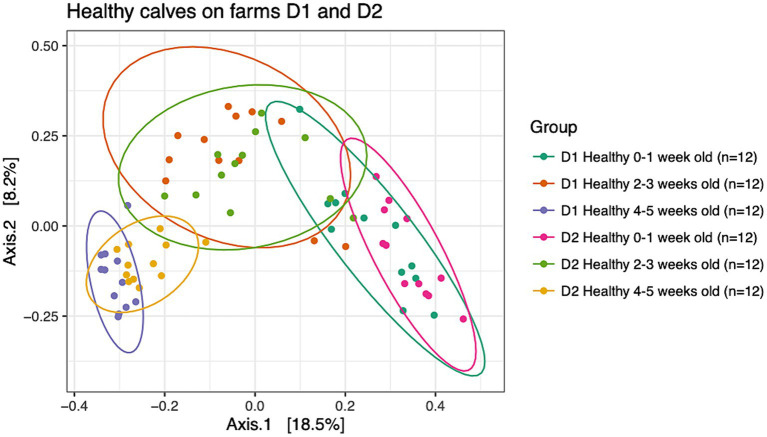
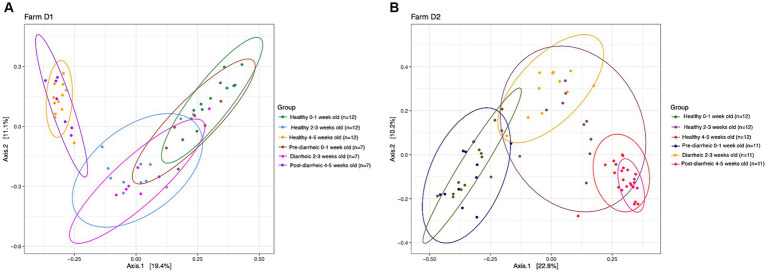
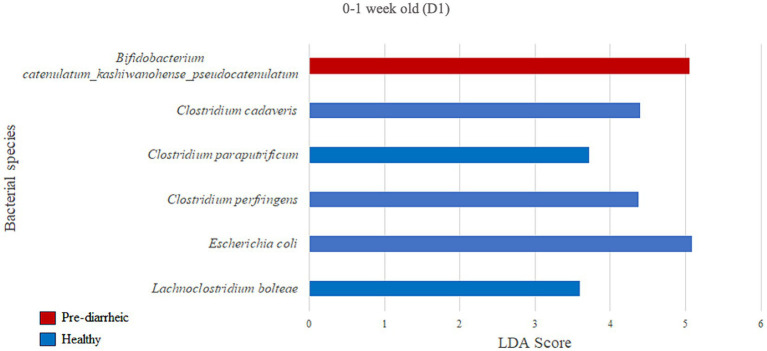
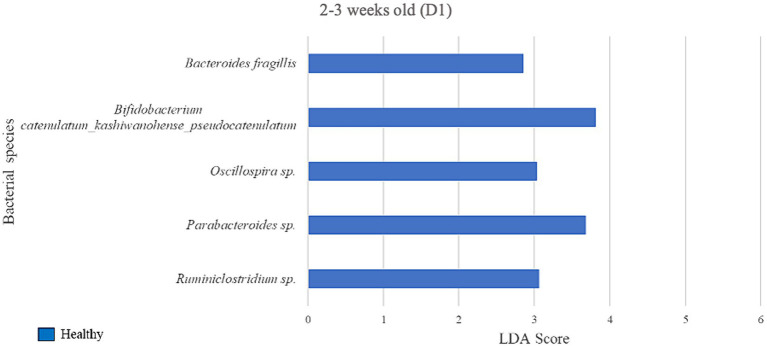
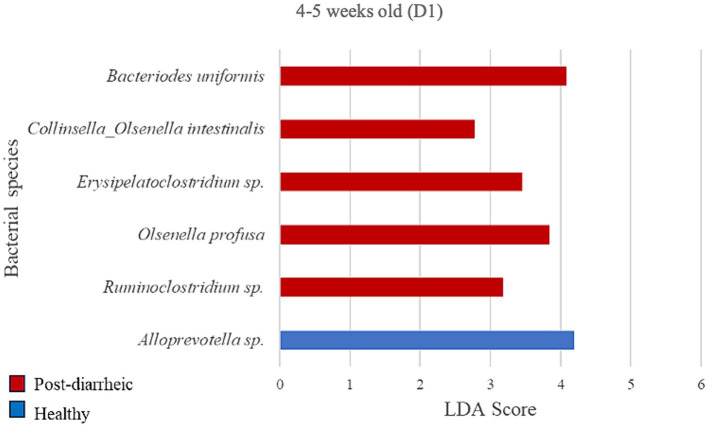
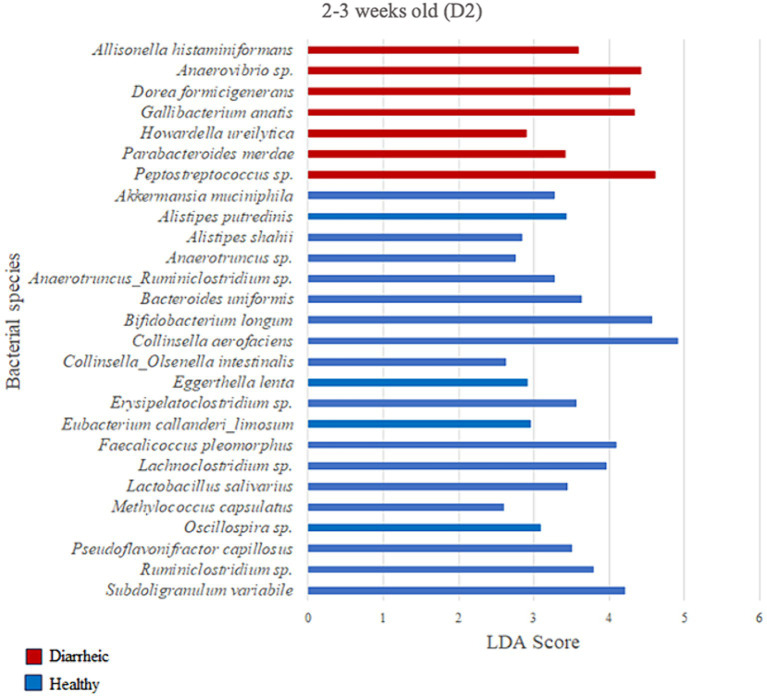
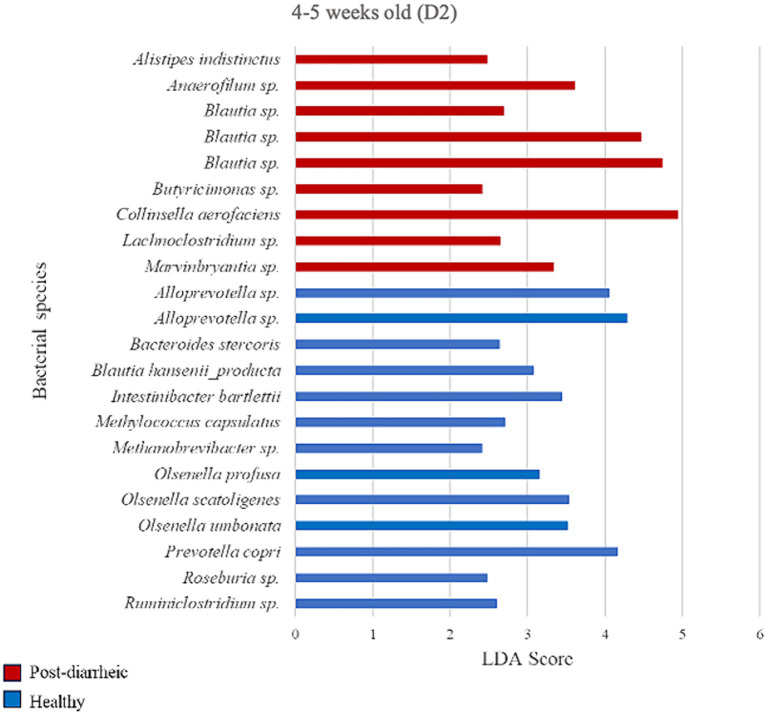
Little is known about shifts in the fecal microbiome of dairy calves preceding and following the incidence of gastrointestinal disease. The objective of this cohort study was to describe the fecal microbiome of preweaned dairy calves before, during, and after gastrointestinal disease. A total of 111 Holstein dairy calves were enrolled on 2 dairies (D1 and D2) and followed until 5 weeks old. Health assessments were performed weekly and fecal samples were collected every other week. Of the 111 calves, 12 calves from D1 and 12 calves from D2 were retrospectively defined as healthy, and 7 calves from D1 and 11 calves from D2 were defined as diarrheic. Samples from these calves were sequenced targeting the 16S rRNA gene and compared based on health status within age groups and farms: healthy (0-1 week old) vs. pre-diarrheic (0-1 week old), healthy (2-3 weeks old) vs. diarrheic (2-3 weeks old), and healthy (4-5 weeks old) vs. post-diarrheic (4-5 weeks old) calves. Healthy and diarrheic samples clustered together based on age rather than health status on both farms. Based on linear discriminant analysis, a few species were identified to be differently enriched when comparing health status within age groups and farm. Among them, Bifidobacterium sp. was differently enriched in pre-diarrheic calves at D1 (0-1 week old) whereas healthy calves of the same age group and farm showed a higher abundance of Escherichia coli. Bifidobacterium sp. was identified as a biomarker of fecal samples from healthy calves (2-3 weeks old) on D1 when compared with diarrheic calves of the same age group and farm. Feces from diarrheic calves on D2 (2-3 weeks old) were characterized by taxa from Peptostreptococcus and Anaerovibrio genera whereas fecal samples of age-matched healthy calves were characterized by Collinsella aerofaciens and Bifidobacterium longum. After resolution of uncomplicated diarrhea (4-5 weeks old), Collinsella aerofaciens was more abundant in D2 calves whereas Bacteriodes uniformis was more abundant in D1 calves. Taken together, these findings suggest that the age of the preweaned calf is the major driver of changes to fecal microbiome composition and diversity even in the face of uncomplicated gastrointestinal disease.
Keywords: calf diarrhea; case definitions; gastrointestinal microbiota; gut health; microbiome.
Copyright © 2024 Claus-Walker, Slanzon, Elder, Hinnant, Mandella, Parrish, Trombetta and McConnel.
Conflict of interest statement
The authors declare that the research was conducted in the absence of any commercial or financial relationships that could be construed as a potential conflict of interest.
Figures
Similar articles
-
Short communication: Comparison of the fecal bacterial communities in diarrheic and nondiarrheic dairy calves from multiple farms in southeastern Pennsylvania.J Dairy Sci. 2021 Jun;104(6):7225-7232. doi: 10.3168/jds.2020-19108. Epub 2021 Mar 2. J Dairy Sci. 2021. PMID: 33663859
-
Characterization of fecal branched-chain fatty acid profiles and their associations with fecal microbiota in diarrheic and healthy dairy calves.J Dairy Sci. 2021 Feb;104(2):2290-2301. doi: 10.3168/jds.2020-18825. Epub 2020 Dec 23. J Dairy Sci. 2021. PMID: 33358167
-
Characterization of the Fecal Bacterial Microbiota of Healthy and Diarrheic Dairy Calves.J Vet Intern Med. 2017 May;31(3):928-939. doi: 10.1111/jvim.14695. Epub 2017 Apr 7. J Vet Intern Med. 2017. PMID: 28390070 Free PMC article.
-
Fecal microbiota of diarrheic calves: Before, during, and after recovering from disease.J Vet Intern Med. 2024 Nov-Dec;38(6):3358-3366. doi: 10.1111/jvim.17201. Epub 2024 Sep 28. J Vet Intern Med. 2024. PMID: 39340403 Free PMC article.
-
Neonatal Calf Diarrhea and Gastrointestinal Microbiota: Etiologic Agents and Microbiota Manipulation for Treatment and Prevention of Diarrhea.Vet Sci. 2024 Feb 29;11(3):108. doi: 10.3390/vetsci11030108. Vet Sci. 2024. PMID: 38535842 Free PMC article. Review.
Cited by
-
Associations of Neonatal Dairy Calf Faecal Microbiota with Inflammatory Markers and Future Performance.Animals (Basel). 2024 Aug 31;14(17):2533. doi: 10.3390/ani14172533. Animals (Basel). 2024. PMID: 39272317 Free PMC article.
References
-
- Abecia L., Ramos-Morales E., Martínez-Fernandez G., Arco A., Martín-García A. I., Newbold C. J., et al. . (2014). Feeding management in early life influences microbial colonisation and fermentation in the rumen of newborn goat kids. Anim. Prod. Sci. 54, 1449–1454. doi: 10.1071/AN14337 - DOI
LinkOut - more resources
Full Text Sources