

Irisin prevents trabecular bone damage and tumor invasion in a mouse model of multiple myeloma
- PMID: 38855797
- PMCID: PMC11162589
- DOI: 10.1093/jbmrpl/ziae066
Irisin prevents trabecular bone damage and tumor invasion in a mouse model of multiple myeloma
Abstract
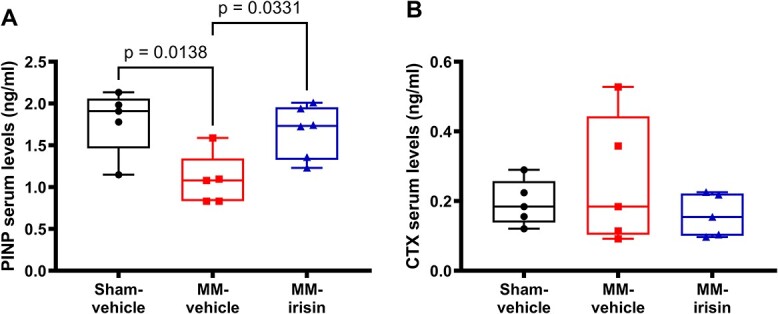
Bone disease associated with multiple myeloma (MM) is characterized by osteolytic lesions and pathological fractures, which remain a therapeutic priority despite new drugs improving MM patient survival. Antiresorptive molecules represent the main option for the treatment of MM-associated bone disease (MMBD), whereas osteoanabolic molecules are under investigation. Among these latter, we here focused on the myokine irisin, which is able to enhance bone mass in healthy mice, prevent bone loss in osteoporotic mouse models, and accelerate fracture healing in mice. Therefore, we investigated irisin effect on MMBD in a mouse model of MM induced by intratibial injection of myeloma cells followed by weekly administration of 100 μg/kg of recombinant irisin for 5 wk. By micro-Ct analysis, we demonstrated that irisin improves MM-induced trabecular bone damage by partially preventing the reduction of femur Trabecular Bone Volume/Total Volume (P = .0028), Trabecular Number (P = .0076), Trabecular Fractal Dimension (P = .0044), and increasing Trabecular Separation (P = .0003) in MM mice. In cortical bone, irisin downregulates the expression of Sclerostin, a bone formation inhibitor, and RankL, a pro-osteoclastogenic molecule, while in BM it upregulates Opg, an anti-osteoclastogenic cytokine. We found that in the BM tibia of irisin-treated MM mice, the percentage of MM cells displays a reduction trend, while in the femur it decreases significantly. This is in line with the in vitro reduction of myeloma cell viability after 48 h of irisin stimulation at both 200 and 500 ng/mL and, after 72 h already at 100 ng/mL rec-irisin. These results could be due to irisin ability to downregulate the expression of Notch 3, which is important for cell-to-cell communication in the tumor niche, and Cyclin D1, supporting an inhibitory effect of irisin on MM cell proliferation. Overall, our findings suggest that irisin could be a new promising strategy to counteract MMBD and tumor burden in one shot.
Keywords: Opg; RankL; bone damage; irisin; multiple myeloma; sclerostin.
© The Author(s) 2024. Published by Oxford University Press on behalf of the American Society for Bone and Mineral Research.
Conflict of interest statement
All the authors declare that there is no conflict of interest regarding the publication of this work. All authors read and approved the final version of the submitted manuscript and consent to be responsible for all aspects of the research. They ensure that all questions related to the integrity or accuracy of the research are properly explored and solved.
Figures


Similar articles
-
A pilot study: effect of irisin on trabecular bone in a streptozotocin-induced animal model of type 1 diabetic osteopathy utilizing a micro-CT.PeerJ. 2023 Oct 17;11:e16278. doi: 10.7717/peerj.16278. eCollection 2023. PeerJ. 2023. PMID: 37868046 Free PMC article.
-
Irisin promotes fracture healing by improving osteogenesis and angiogenesis.J Orthop Translat. 2022 Sep 24;37:37-45. doi: 10.1016/j.jot.2022.07.006. eCollection 2022 Nov. J Orthop Translat. 2022. PMID: 36196152 Free PMC article.
-
Irisin Protects against Loss of Trabecular Bone Mass and Strength in Adult Ovariectomized Mice by Stimulating Osteoblast Activity.Int J Mol Sci. 2023 Jun 8;24(12):9896. doi: 10.3390/ijms24129896. Int J Mol Sci. 2023. PMID: 37373043 Free PMC article.
-
Role of Osteocytes in Myeloma Bone Disease: Anti-sclerostin Antibody as New Therapeutic Strategy.Front Immunol. 2018 Oct 24;9:2467. doi: 10.3389/fimmu.2018.02467. eCollection 2018. Front Immunol. 2018. PMID: 30410490 Free PMC article. Review.
-
New insights in myeloma-induced osteolysis.Leuk Lymphoma. 2003 Sep;44(9):1463-7. doi: 10.3109/10428190309178765. Leuk Lymphoma. 2003. PMID: 14565645 Review.
Cited by
-
Adipose Tissue-Derived Mediators in Multiple Myeloma: Linking Obesity to Bone Disease via Inflammatory Pathways.Int J Mol Sci. 2025 Jun 11;26(12):5618. doi: 10.3390/ijms26125618. Int J Mol Sci. 2025. PMID: 40565082 Free PMC article. Review.
References
-
- Raje N, Terpos E, Willenbacher W, et al. Denosumab versus zoledronic acid in bone disease treatment of newly diagnosed multiple myeloma: an international, double-blind, double-dummy, randomised, controlled, phase 3 study. Lancet Oncol. 2018;19(3):370–381. 10.1016/S1470-2045(18)30072-X - DOI - PubMed
LinkOut - more resources
Full Text Sources
Research Materials
