. 2024 Jun 10;9(11):e168825.
doi: 10.1172/jci.insight.168825.

Glycolytic lactate in diabetic kidney disease

Affiliations

Glycolytic lactate in diabetic kidney disease

Manjula Darshi et al. JCI Insight. .

Abstract

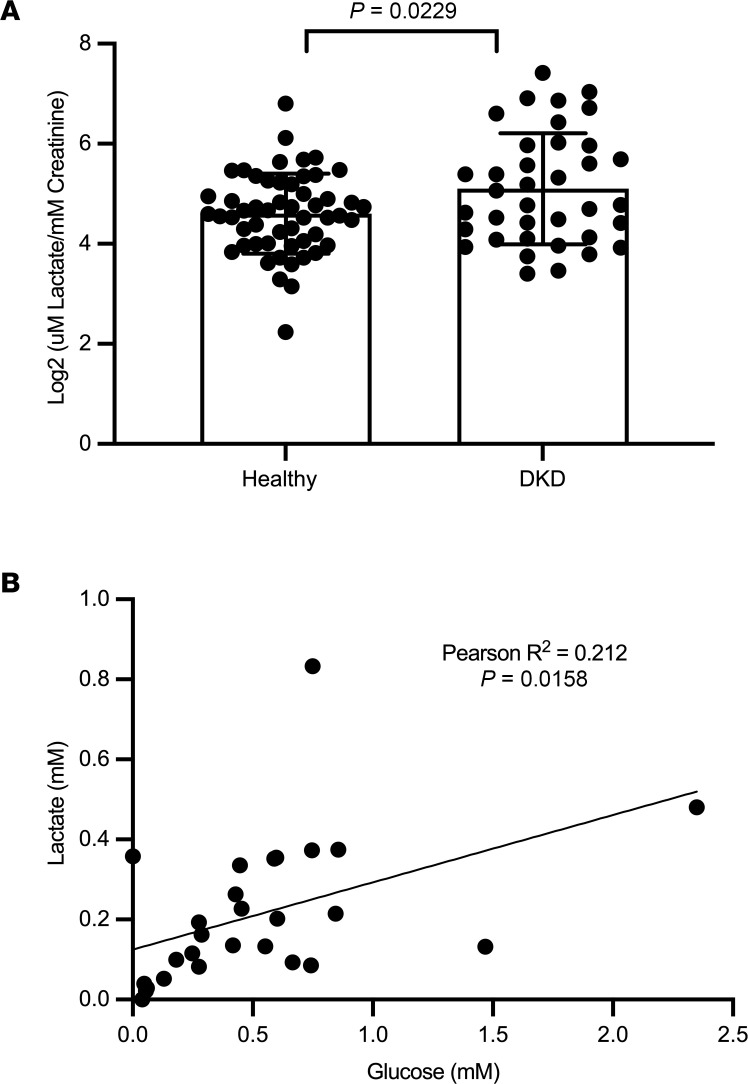
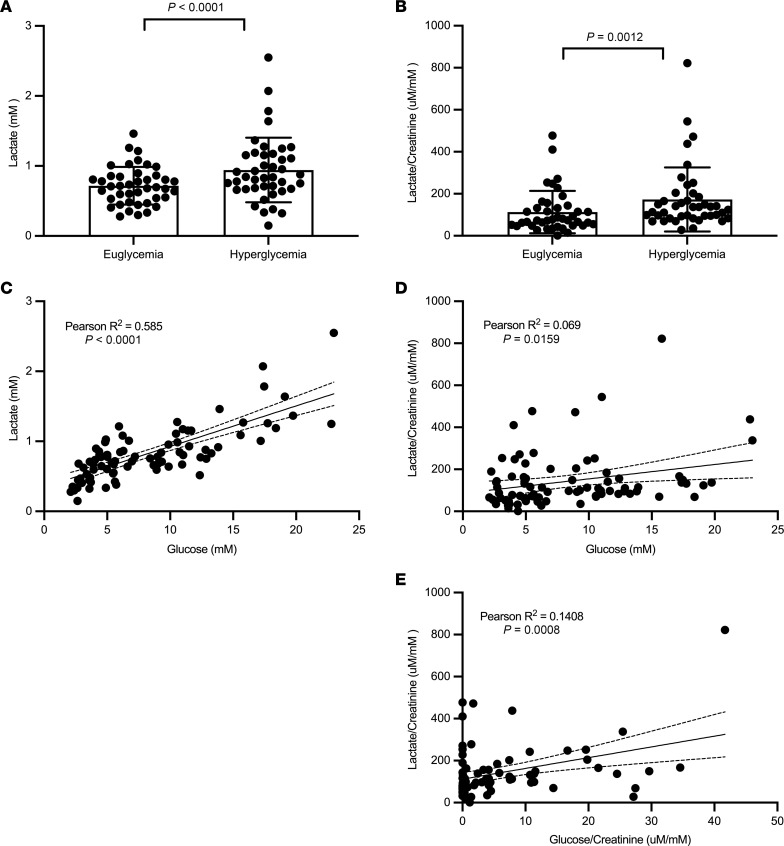
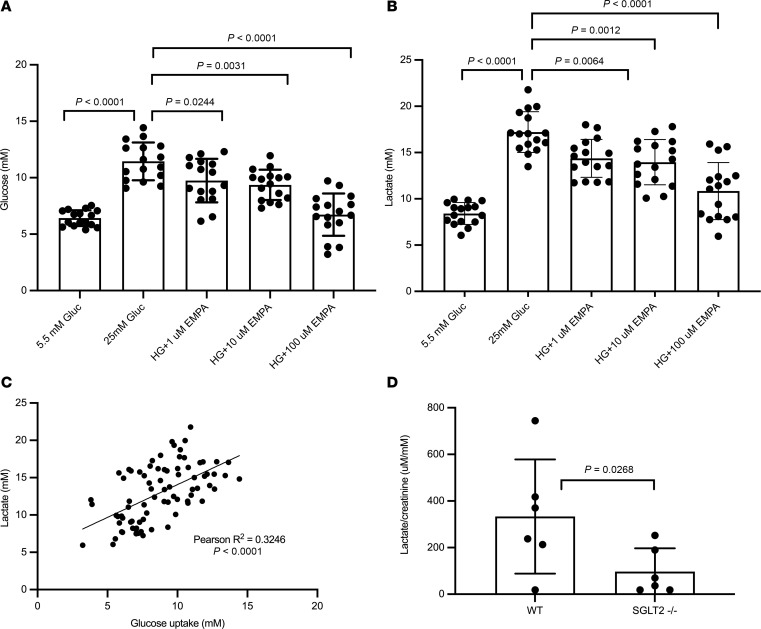
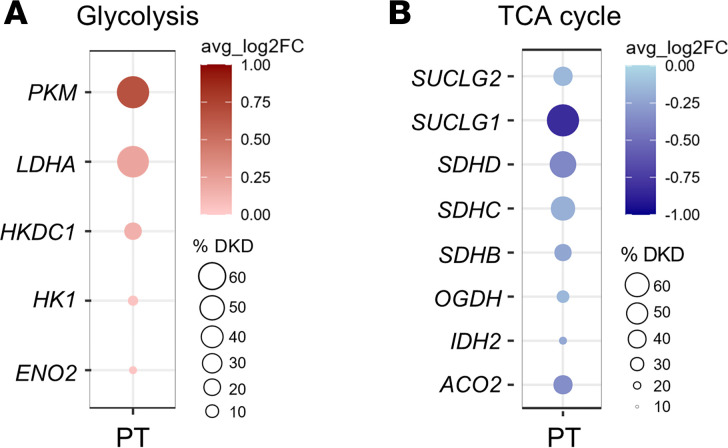
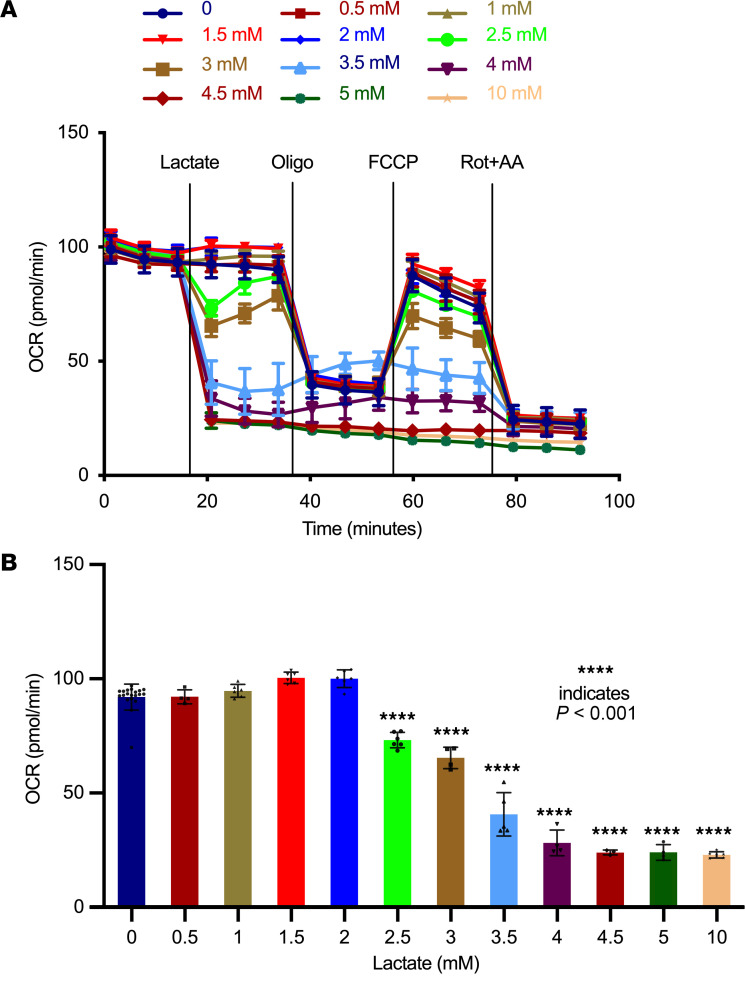
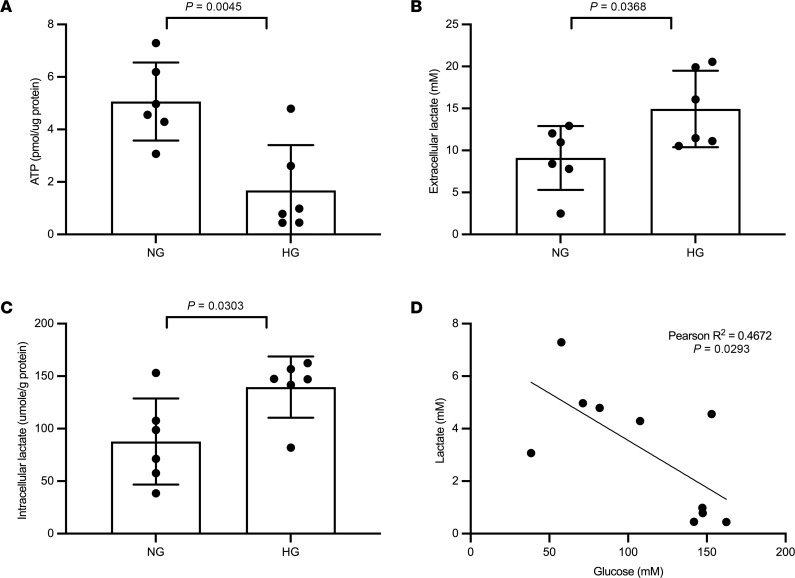
Lactate elevation is a well-characterized biomarker of mitochondrial dysfunction, but its role in diabetic kidney disease (DKD) is not well defined. Urine lactate was measured in patients with type 2 diabetes (T2D) in 3 cohorts (HUNT3, SMART2D, CRIC). Urine and plasma lactate were measured during euglycemic and hyperglycemic clamps in participants with type 1 diabetes (T1D). Patients in the HUNT3 cohort with DKD had elevated urine lactate levels compared with age- and sex-matched controls. In patients in the SMART2D and CRIC cohorts, the third tertile of urine lactate/creatinine was associated with more rapid estimated glomerular filtration rate decline, relative to first tertile. Patients with T1D demonstrated a strong association between glucose and lactate in both plasma and urine. Glucose-stimulated lactate likely derives in part from proximal tubular cells, since lactate production was attenuated with sodium-glucose cotransporter-2 (SGLT2) inhibition in kidney sections and in SGLT2-deficient mice. Several glycolytic genes were elevated in human diabetic proximal tubules. Lactate levels above 2.5 mM potently inhibited mitochondrial oxidative phosphorylation in human proximal tubule (HK2) cells. We conclude that increased lactate production under diabetic conditions can contribute to mitochondrial dysfunction and become a feed-forward component to DKD pathogenesis.

Keywords: Chronic kidney disease; Diabetes; Mitochondria; Nephrology.


Figures

Figure 1
Figure 1. High urine lactate associated with diabetic kidney disease (DKD) among the HUNT3 cohort.
(A) Lactate levels are significantly different between patients with DKD (eGFR < 60, n = 39) with age- and sex-matched healthy controls (n = 53) from the HUNT3 study, assessed using 2-tailed Welch’s t test. (B) Plasma lactate is correlated with plasma glucose in patients with DKD. Pearson’s correlation coefficient was used for correlation analysis. Data represent mean ± SD.
Figure 2
Figure 2. Urine lactate and plasma lactate increased with hyperglycemic clamp in T1D.
Patients with T1D (n = 40) and with no evidence of kidney disease were studied with a glycemic clamp to maintain blood glucose levels at a 4–6 mM range or in a hyperglycemic range (9–11 mM). (A and B) The changes in plasma and urine lactate/creatinine are demonstrated following the euglycemic and hyperglycemic clamps. P values in panels A and B were calculated by Wilcoxon matched-pairs signed rank test. (C and D) Both plasma and urine lactate are correlated with plasma glucose. (E) Urine lactate is correlated with urine glucose. Correlation analyses were performed using the Pearson’s correlation coefficient. Data represent mean ± SD.
Figure 3
Figure 3. Glucose uptake and lactate secretion in isolated kidney sections.
(A and B) Kidney sections (n = 16) from 10- to 12-week-old male C57BL/6J mice have an SGLT2-dependent increase in glucose uptake (A) from normal (NG) to high glucose (HG) and lactate production (B). The SGLT2 inhibitor empagliflozin (EMPA) has a dose-dependent effect to reduce glucose uptake and lactate secretion. P values for A and B were calculated using 1-way ANOVA and Tukey’s test for multiple comparison testing. (C) Lactate secretion is significantly correlated with glucose uptake, assessed using the Pearson’s correlation coefficient. (D) Urine lactate is reduced in SGLT2-KO (SGLT2–/–) mice via t test (7-month-old male mice, n = 6 both groups) compared with WT by 2-tailed Welch’s t test. Data represent mean ± SD.
Figure 4
Figure 4. Dot plot of upregulated glycolytic and downregulated TCA cycle genes in the proximal tubular (PT) cells of patients with diabetic kidney disease (DKD).
(A and B) Log2 fold change calculated between the average of normalized glycolytic (A) and TCA cycle (B) gene expression values from the living donors (LD; n = 20) and patients with DKD (n = 11) in PT cells. The %DKD circle size shows the percentage of cells in which the gene was detected in DKD biopsies. PT, proximal tubule; PKM, pyruvate kinase; LDHA, lactate dehydrogenase A; HKDC1, hexokinase domain containing 1; HK1, hexokinase 1; ENO2, enolase 2; SUCLG2, succinate-CoA ligase GDP-forming subunit β; SUCLG1, succinate-CoA ligase GDP/ADP-forming subunit α; SDHD, succinate dehydrogenase complex subunit D; SDHC, succinate dehydrogenase complex subunit C; SDHB, succinate dehydrogenase complex subunit B; OGDH, oxoglutarate dehydrogenase; IDH2, isocitrate dehydrogenase (NADP+)2; ACO2, aconitase 2.
Figure 5
Figure 5. Lactate inhibits mitochondrial function in a dose-dependent manner in human kidney proximal tubule epithelial cells (HK2).
(A) Oxygen consumption rates (OCR) were measured in HK2 cells (n = 15) using seahorse extracellular flux analyzer. Following basal respiratory measurements, indicated concentrations of lactic acid were injected through injection ports. (B) Basal respiration is represented immediately after treatment with lactate (n = 20). P values in A were calculated using 1-way ANOVA and Dunnett’s test for multiple comparison testing. Data represent mean ± SD. Oligo, oligomycin; FCCP, carbonyl cyanide-p-trifluoromethoxyphenylhydrazone; Rot+AA, Rotenone+Antimycin A.
Figure 6
Figure 6. ATP production and intracellular lactate accumulation in isolated kidney sections.
(AC) Kidney sections (n = 5–6 each group) from 10- to 12-week-old male C57BL/6J mice were incubated with normal glucose (NG) and high glucose (HG) for 24 hours to measure the ATP level (A), extracellular lactate (B), and intracellular lactate (C). (D) The ATP level negatively correlates with intracellular lactate (n = 10). Two-tailed t test in AC and simple linear regression analysis in D using the Pearson’s correlation coefficient were performed for the statistical analyses. Data represent mean ± SD.

References

    1. Sharma K, Ziyadeh FN. Biochemical events and cytokine interactions linking glucose metabolism to the development of diabetic nephropathy. Semin Nephrol. 1997;17(2):80–92. - PubMed
    1. Greene D, et al. Role of sorbitol accumulation and myo-inositol depletion in paranodal swelling of large myelinated nerve fibers in the insulin-deficient spontaneously diabetic bio-breeding rat. Reversal by insulin replacement, an aldose reductase inhibitor, and myo-inositol. J Clin Invest. 1987;79(5):1479–1485. doi: 10.1172/JCI112977. - DOI - PMC - PubMed
    1. McLennan SV, et al. Advanced glycation end products decrease mesangial cell MMP-7: a role in matrix accumulation in diabetic nephropathy? Kidney Int. 2007;72(4):481–488. doi: 10.1038/sj.ki.5002357. - DOI - PubMed
    1. Unoki-Kubota H, et al. Pyridoxamine, an inhibitor of advanced glycation end product (AGE) formation ameliorates insulin resistance in obese, type 2 diabetic mice. Protein Pept Lett. 2010;17(9):1177–1181. doi: 10.2174/092986610791760423. - DOI - PubMed
    1. Vallon V, Thomson SC. The tubular hypothesis of nephron filtration and diabetic kidney disease. Nat Rev Nephrol. 2020;16(6):317–336. doi: 10.1038/s41581-020-0256-y. - DOI - PMC - PubMed

MeSH terms