. 2024 Jun 10;9(11):e177937.
doi: 10.1172/jci.insight.177937.

SFTPB in serum extracellular vesicles as a biomarker of progressive pulmonary fibrosis

Affiliations

SFTPB in serum extracellular vesicles as a biomarker of progressive pulmonary fibrosis

Takatoshi Enomoto et al. JCI Insight. .

Abstract

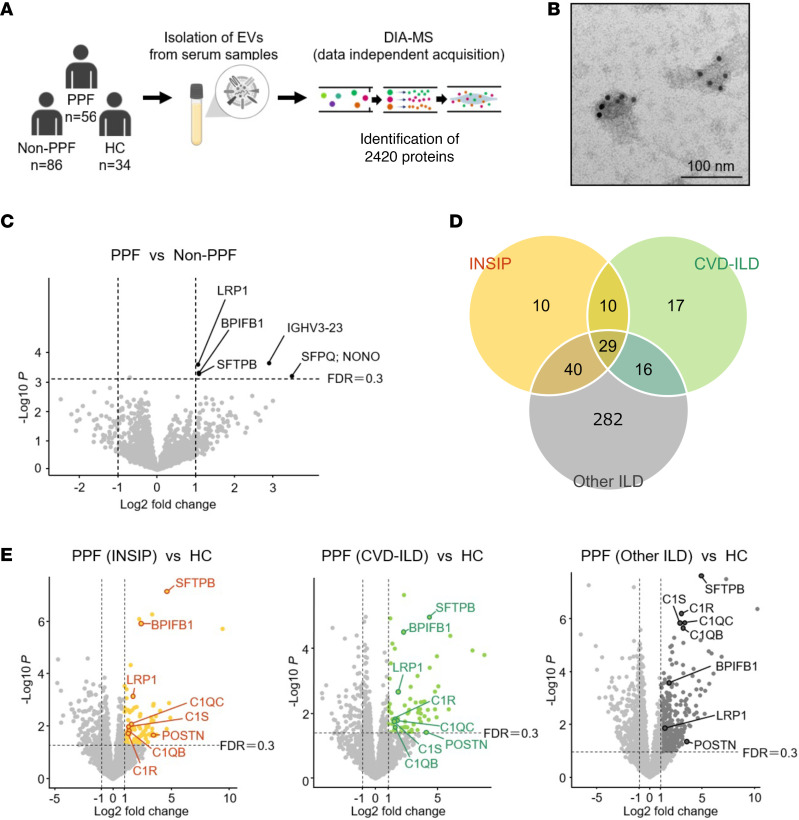
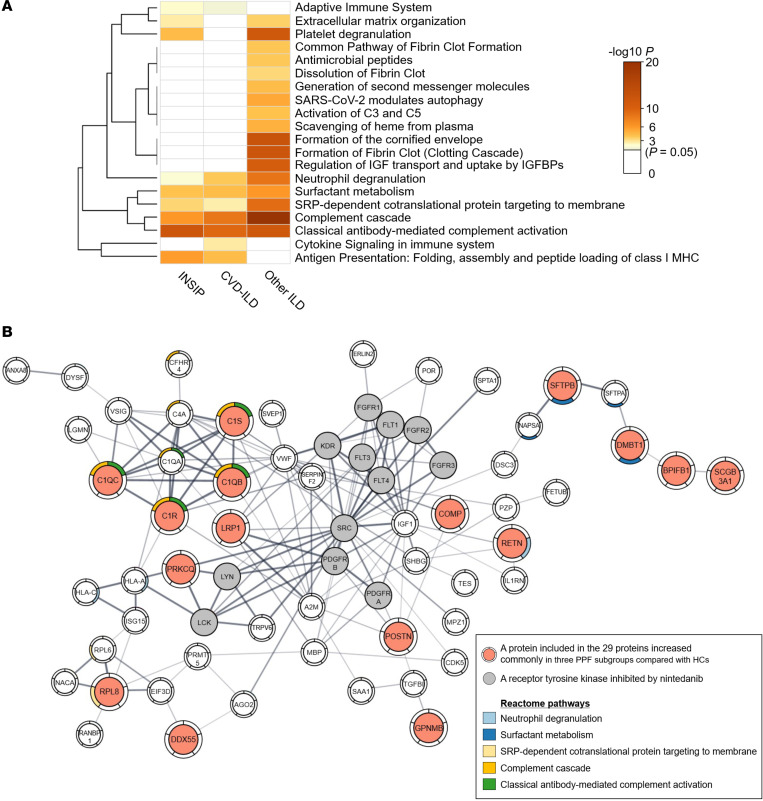
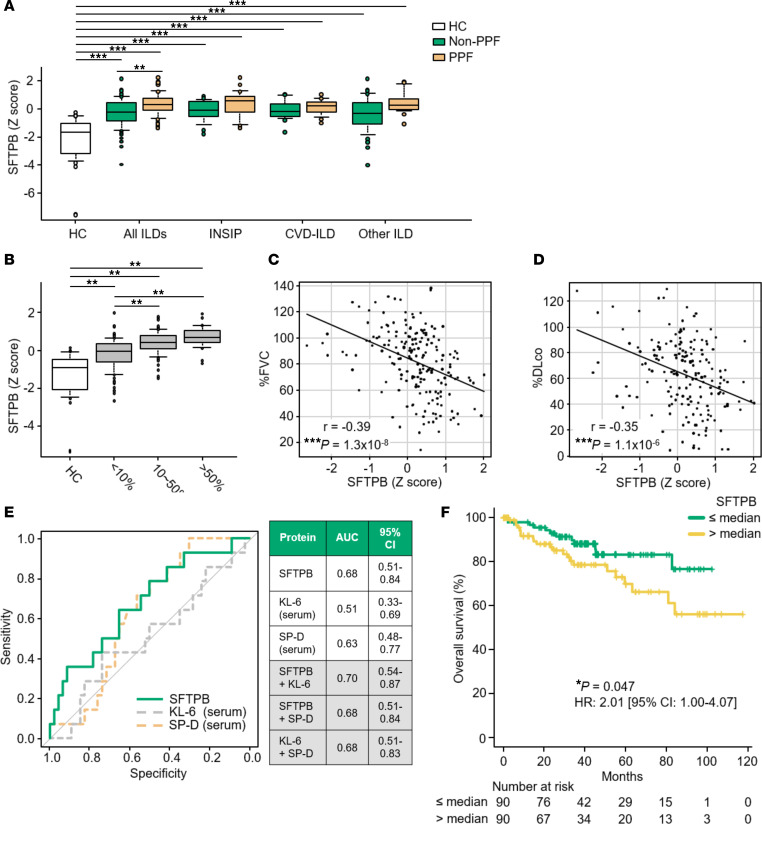
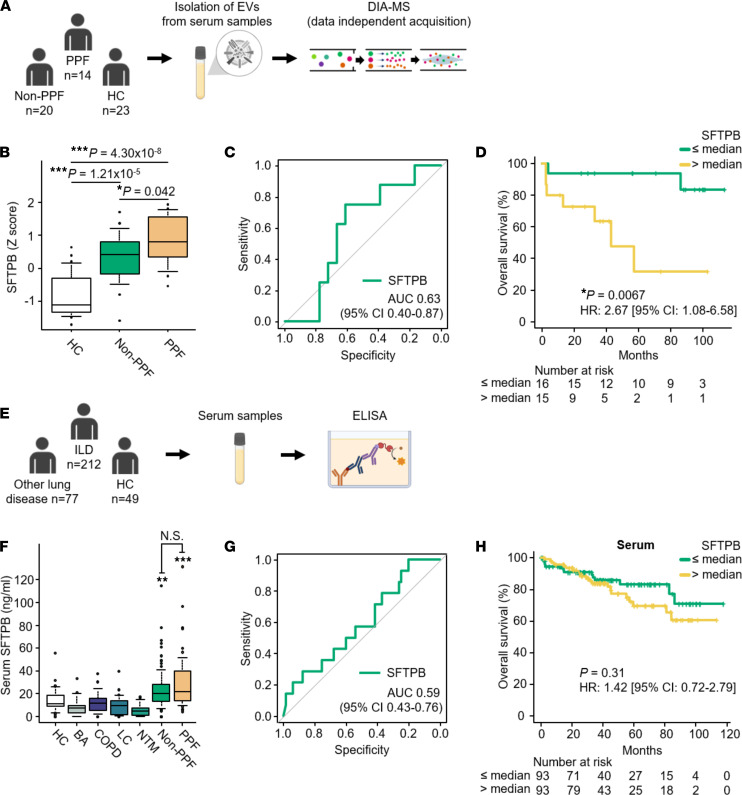
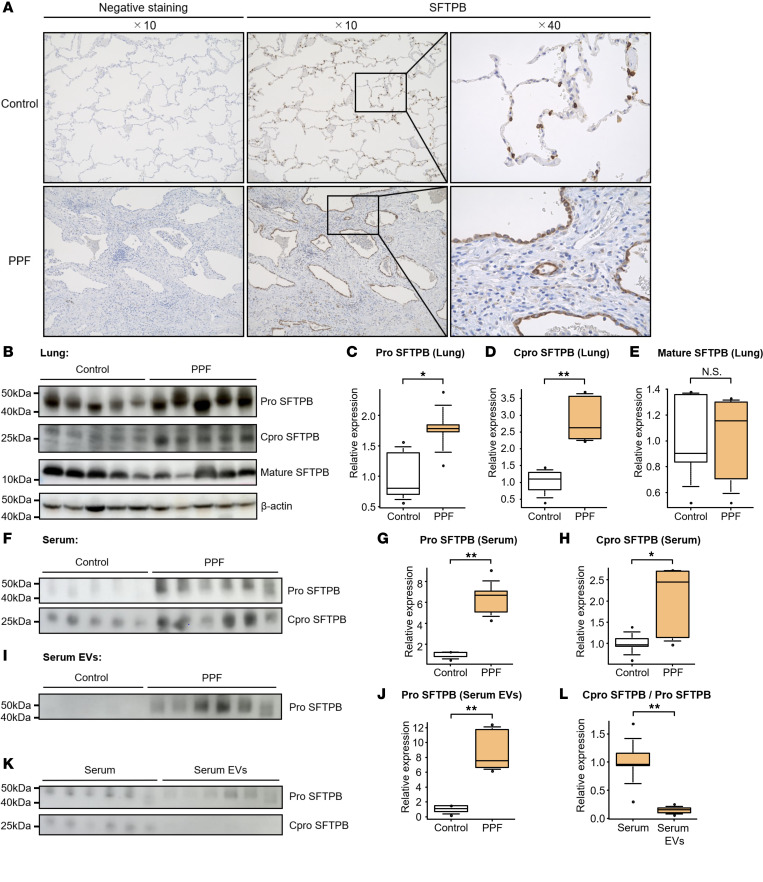
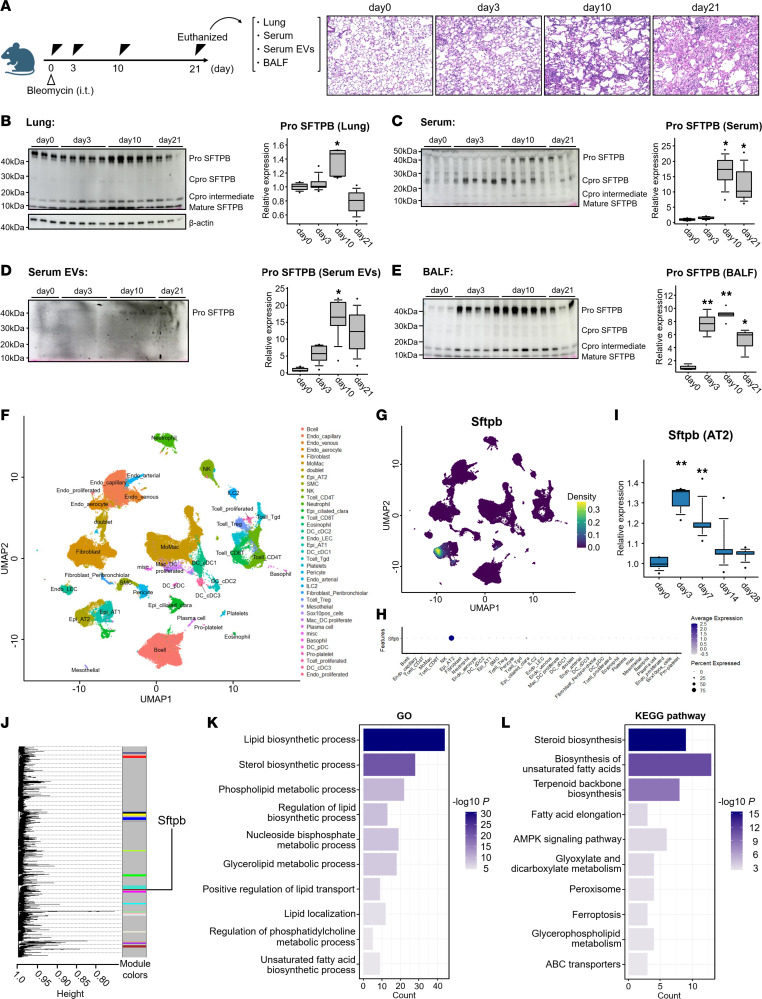
Progressive pulmonary fibrosis (PPF), defined as the worsening of various interstitial lung diseases (ILDs), currently lacks useful biomarkers. To identify novel biomarkers for early detection of patients at risk of PPF, we performed a proteomic analysis of serum extracellular vesicles (EVs). Notably, the identified candidate biomarkers were enriched for lung-derived proteins participating in fibrosis-related pathways. Among them, pulmonary surfactant-associated protein B (SFTPB) in serum EVs could predict ILD progression better than the known biomarkers, serum KL-6 and SP-D, and it was identified as an independent prognostic factor from ILD-gender-age-physiology index. Subsequently, the utility of SFTPB for predicting ILD progression was evaluated further in 2 cohorts using serum EVs and serum, respectively, suggesting that SFTPB in serum EVs but not in serum was helpful. Among SFTPB forms, pro-SFTPB levels were increased in both serum EVs and lungs of patients with PPF compared with those of the control. Consistently, in a mouse model, the levels of pro-SFTPB, primarily originating from alveolar epithelial type 2 cells, were increased similarly in serum EVs and lungs, reflecting pro-fibrotic changes in the lungs, as supported by single-cell RNA sequencing. SFTPB, especially its pro-form, in serum EVs could serve as a biomarker for predicting ILD progression.

Keywords: Fibrosis; Proteomics; Pulmonary surfactants; Pulmonology.


Figures

Figure 1
Figure 1. Screening of PPF biomarkers in the discovery cohort.
(A) Overview of the project design in the discovery cohort. Serum extracellular vesicles (EVs) from 56 progressive pulmonary fibrosis (PPF) cases, 86 non-PPF cases, and 34 healthy controls (HCs) were analyzed by data-independent acquisition (DIA). (B) Representative transmission electron microscopy images of serum EVs from an HC: Immunogold labeling (BBI International) with CD9. Scale bar, 100 nm. (C) Identification of differentially expressed proteins in serum EVs in PPF as compared with those in non-PPF. (D and E) Identification of proteins in serum EVs, whose expression was increased in 3 PPF groups — idiopathic nonspecific interstitial pneumonia (INSIP) (n = 22), collagen vascular disease–associated interstitial lung disease (CVD-ILD) (n = 14), and other ILD (n = 20) — as compared with that in HCs (n = 34).
Figure 2
Figure 2. Proteomic profiling of candidate biomarkers in the discovery cohort.
(A) Reactome pathway enrichment analysis of the proteins, the levels of which were increased in 3 PPF subgroups compared with HCs. These proteins were commonly enriched in pulmonary fibrosis–related pathways, such as neutrophil degranulation and surfactant metabolism. (B) Protein–protein interaction analysis using the STRING database among the 95 biomarker candidates whose expression was commonly increased in at least 2 PPF groups compared with those in HCs, together with tyrosine kinases inhibited by nintedanib. Here, only proteins that interact with tyrosine kinases inhibited by nintedanib are depicted.
Figure 3
Figure 3. Clinical features of SFTPB in serum EVs in the discovery cohort, particularly associations with ILD progression.
(A) Serum EV levels of SFTPB for each disease, measured by DIA in the discovery cohort. Pairwise intergroup comparisons between HCs and each ILD subgroup, as well as between non-progressive pulmonary fibrosis (non-PPF) and PPF in all ILDs, INSIP, CVD-ILD, and other ILD groups were performed using 2-tailed Student’s t test (Bonferroni correction), with **P < 0.01, and ***P < 0.001. (B) SFTPB levels in serum EVs correlated with the extent of interstitial shadows on CT scans. The differences were analyzed by ANOVA, and Holm’s method was applied to adjust for P values: **P < 0.01. (A and B) The boxes indicate interquartile ranges (75% and 25%) and medians; the upper and lower whiskers represent the 10% and 90% points, respectively. (C and D) Pearson correlations of SFTPB with percentage predicted forced vital capacity (%FVC) and the diffusing capacity for carbon monoxide (%DLco). ***P < 0.001. (E) Receiver operating characteristic (ROC) curves for evaluating SFTPB in serum EVs, serum KL-6, and SP-D as predicting composite outcome (relative decline in %FVC ≥ 10%, acute exacerbation, or death) within a year in 60 evaluable ILD cases in the discovery cohort. (F) Kaplan-Meier curve estimating the probability of overall survival (OS) stratified by the SFTPB levels in serum EVs. In 180 cases with INSIP, CVD-ILD, FHP, or unclassifiable ILD, high levels of SFTPB in serum EVs were significantly associated with high mortality. OS was defined as the period from the date of blood collection to the date of death from any cause.
Figure 4
Figure 4. Reproducibility of associations between SFTPB in serum EVs but not in serum and ILD progression.
(A and E) Schematic representation of the project designs in the validation cohort (A) and in the combined-sample cohort (E). In the validation cohort, serum EV levels of SFTPB were analyzed by data-independent acquisition. In the combined-sample cohort, serum levels of SFTPB were measured by ELISA. (B) Serum EV levels of SFTPB in the validation cohort. Numbers of samples: HC (n = 23), non-PPF (n = 20), PPF (n = 14). The data were subjected to ANOVA, and Holm’s method was applied to adjust for the ANOVA P values. (F) Serum levels of SFTPB in the combined-sample cohort. Numbers of samples: HC (n = 49), BA (n = 20), COPD (n = 20), LC (n = 22), NTM (n = 15), non-PPF (n = 100), and PPF (n = 60). The expression levels were compared by ANOVA, and Dunnett’s method was applied to adjust for the ANOVA P values. Subsequently, differences between PPF and non-PPF were compared by ANOVA, and Holm’s method was applied to adjust for the ANOVA P values. (B and F) *P < 0.05, **P < 0.01, and ***P < 0.001 for significant differences from healthy control. N.S., no significant difference between non-PPF and PPF. (C and G) ROC curves for evaluating SFTPB in serum EVs as predicting composite outcome (relative decline in %FVC ≥ 10%, acute exacerbation, or death) within a year in 23 evaluable ILD cases in the validation cohort (C) and ROC curves for evaluating SFTPB in serum as predicting composite outcome in 78 evaluable ILD cases in the combined-sample cohort (G). (D and H) Kaplan-Meier curves estimating the probability of overall survival (OS) stratified by the serum EV levels of SFTPB in the validation cohort (D) and the serum levels of SFTPB in the combined-sample cohort (H). OS was defined as the period from the date of blood collection to the date of death from any cause. BA, bronchial asthma; COPD, chronic obstructive pulmonary disease; LC, lung cancer; NTM, nontuberculous mycobacterial lung disease.
Figure 5
Figure 5. Increased levels of immature SFTPB protein in patients with PPF.
(A) A representative image of immunohistochemistry for SFTPB using lung sections from controls and PPF cases. In controls, SFTPB-positive alveolar epithelial cells were scattered over the alveolar surface, while SFTPB-positive alveolar epithelial cells with reactive atypia covered the alveolar surface in fibrotic areas. (BE) Western blotting for evaluating SFTPB in 10 lung tissue specimens, including 5 PPF surgical specimens and 5 control tissues (surgical specimens from patients with lung cancer). (FH) Western blotting for evaluating SFTPB in the serum of HCs (n = 5) and PPF cases (n = 6). (I and J) Western blotting for evaluating SFTPB in serum EVs from HCs (n = 5) and PPF cases (n = 6). The same samples were used as in the study of serum. (K and L) Western blotting for evaluating SFTPB between the serum and serum EVs in PPF cases (n = 6). The same samples were used as in the studies of serum and serum EVs. Serum samples per lane were generated from 0.01 μL of serum, while serum EV samples per lane were generated from 70 μL of serum. (BL) Patient characteristics are shown in Supplemental Tables 9 and 10. The intensity of the SFTPB band was evaluated using ImageJ (NIH) and normalized to levels of β-actin in lung tissue specimens. Differences between 2 groups were compared using 2-tailed Student’s t test. *P < 0.05; **P < 0.01.
Figure 6
Figure 6. Spatial and longitudinal dynamics of SFTPB during the development of bleomycin-induced lung fibrosis.
(A) Schematic representation of the experimental protocol used for Western blotting analysis of lung tissues, serum, serum EVs, and BALF from bleomycin-induced pulmonary fibrosis model mice and representative hematoxylin-eosin staining of lung tissues. (BE) Western blotting analysis of SFTPB in lung tissues, serum, serum EVs, and BALF and quantification of the levels of pro-SFTPB. n = 3–5 mice per group. The level of pro-SFTPB was increased, peaking on day 10, across all source materials. (F) Uniform manifold approximation and projection (UMAP) embedding of single-cell transcriptomes from 77,656 cells from 5 control mice (on day 0) and 20 bleomycin-induced mouse lungs (on days 3, 7, 14, 28, n = 5 mice per group) annotated by cell type. (G and H) Density and dot plots of Sftpb mRNA expression levels. (I) Changes in the expression of Sftpb mRNA in alveolar type 2 epithelial cells (AT2) by pseudo-bulk analysis. n = 5 mice per group. (J) Dendrogram of high dimensional weighted correlation network analysis in AT2 cells of mice on days 0, 3, and 7. (K and L) The 10 most significantly (P < 0.05) enriched terms in GO biological process and KEGG pathways in 126 genes covarying with Sftpb. (BE and I) The boxes indicate interquartile ranges (75% and 25%) and medians; the upper and lower whiskers represent the 10% and 90% points, respectively. The expression levels were compared by ANOVA, and Dunnett’s method was applied to adjust for the ANOVA P values. *P < 0.05; **P < 0.01.

Similar articles

Cited by

References

    1. Adegunsoye A, Strek ME. Therapeutic approach to adult fibrotic lung diseases. Chest. 2016;150(6):1371–1386. doi: 10.1016/j.chest.2016.07.027. - DOI - PMC - PubMed
    1. Travis WD, et al. An official American Thoracic Society/European Respiratory Society statement: update of the international multidisciplinary classification of the idiopathic interstitial pneumonias. Am J Respir Crit Care Med. 2013;188(6):733–748. doi: 10.1164/rccm.201308-1483ST. - DOI - PMC - PubMed
    1. Cottin V, et al. Fibrosing interstitial lung diseases: knowns and unknowns. Eur Respir Rev. 2019;28(151):180100. doi: 10.1183/16000617.0100-2018. - DOI - PMC - PubMed
    1. Brown KK, et al. The natural history of progressive fibrosing interstitial lung diseases. Eur Respir J. 2020;55(6):2000085. doi: 10.1183/13993003.00085-2020. - DOI - PMC - PubMed
    1. Raghu G, et al. Idiopathic pulmonary fibrosis (an update) and progressive pulmonary fibrosis in adults: an official ATS/ERS/JRS/ALAT clinical practice guideline. Am J Respir Crit Care Med. 2022;205(9):e18–e47. doi: 10.1164/rccm.202202-0399ST. - DOI - PMC - PubMed

MeSH terms

Substances