. 2024 Jun 10;9(11):e175525.
doi: 10.1172/jci.insight.175525.

Cytomegalovirus infection lengthens the cell cycle of granule cell precursors during postnatal cerebellar development

Affiliations

Cytomegalovirus infection lengthens the cell cycle of granule cell precursors during postnatal cerebellar development

Cathy Yea Won Sung et al. JCI Insight. .

Abstract

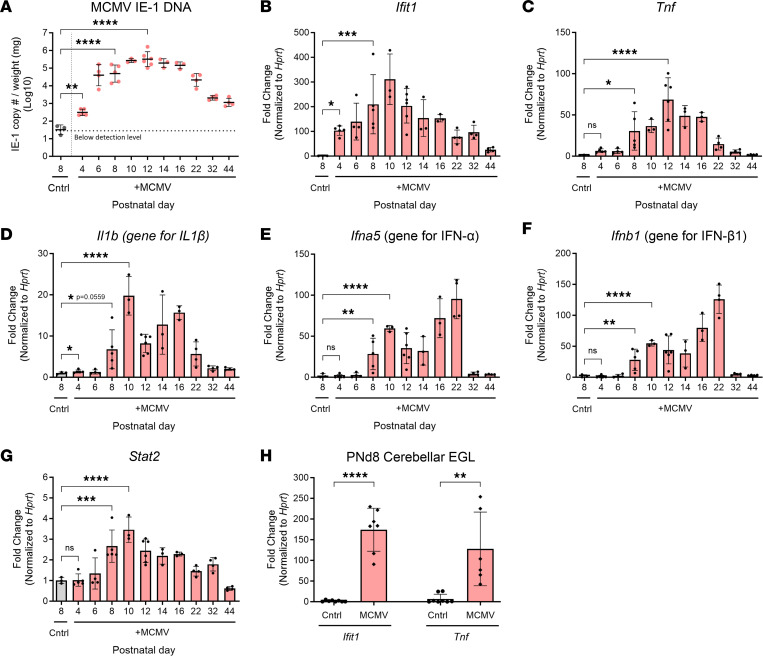
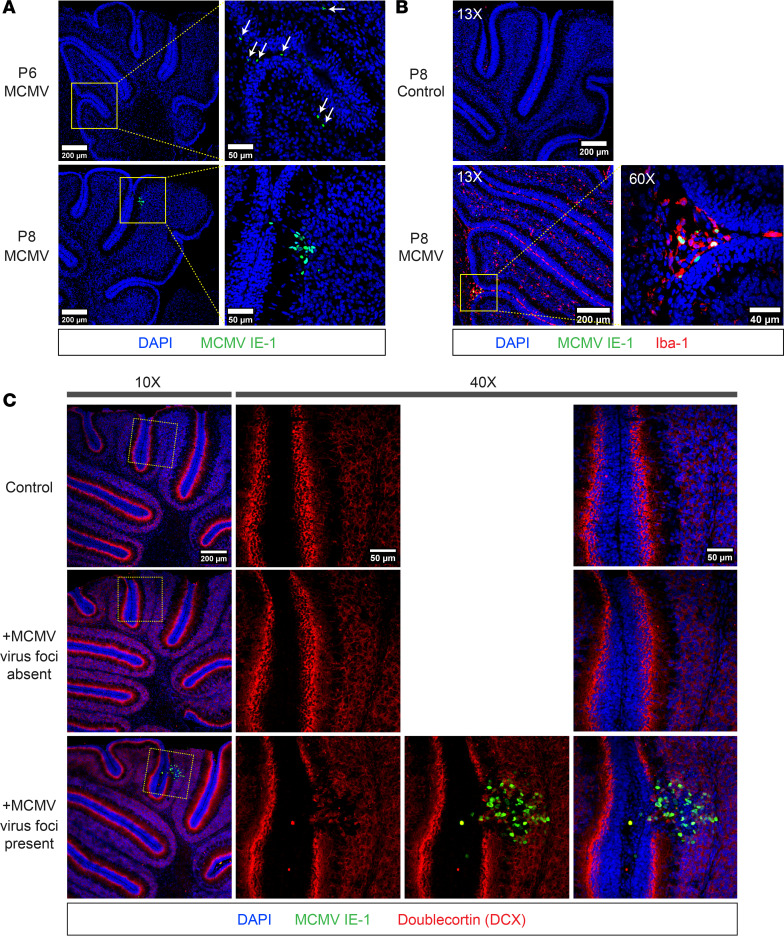
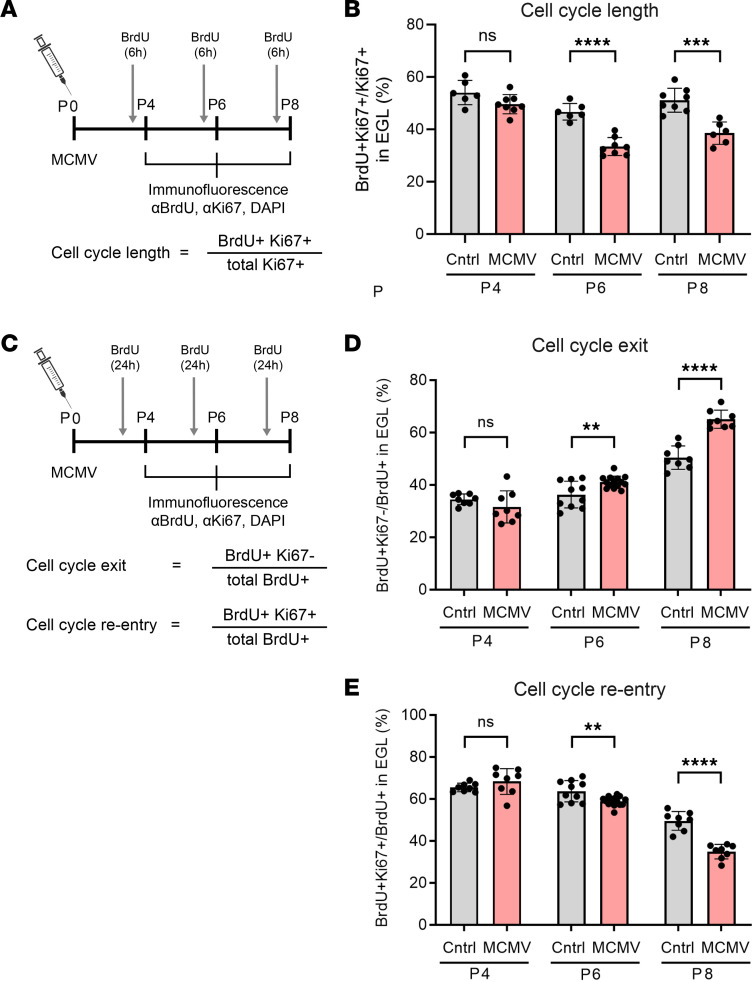
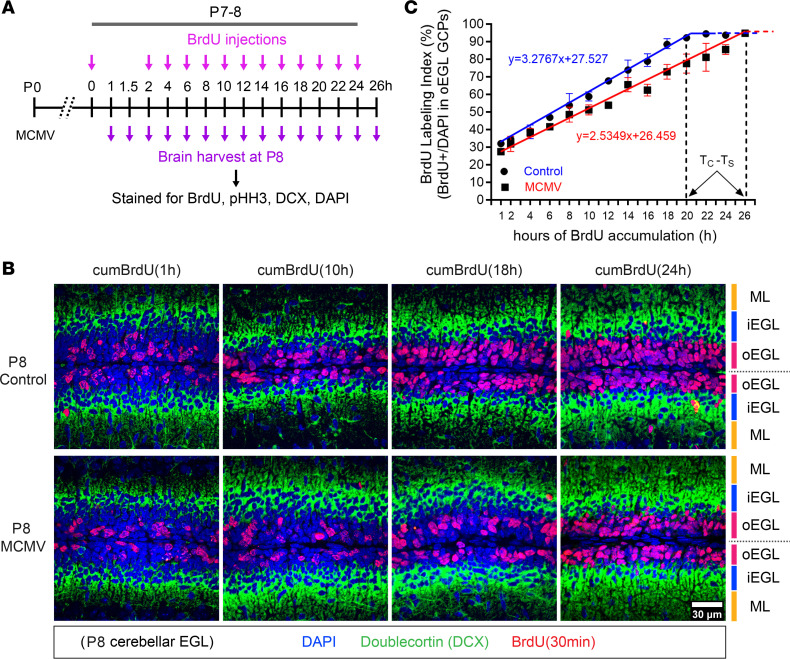
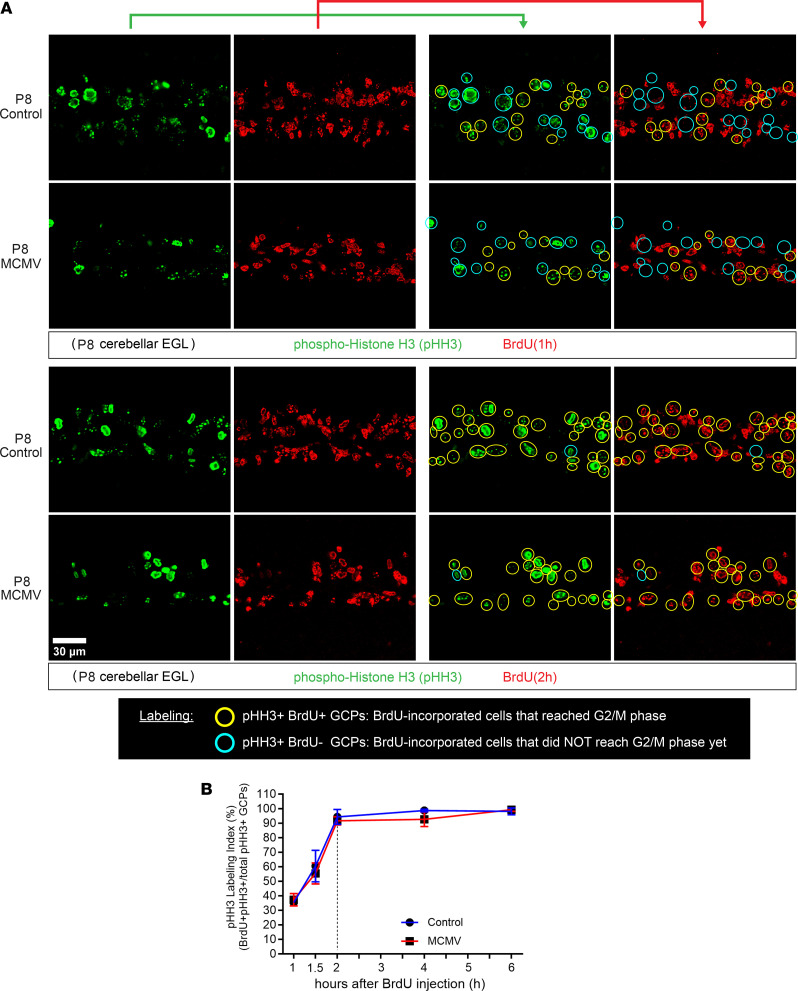
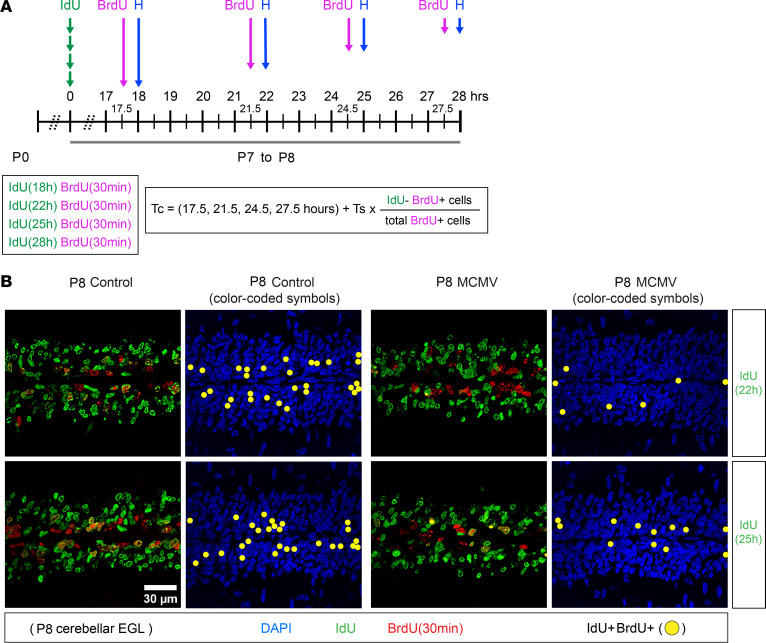
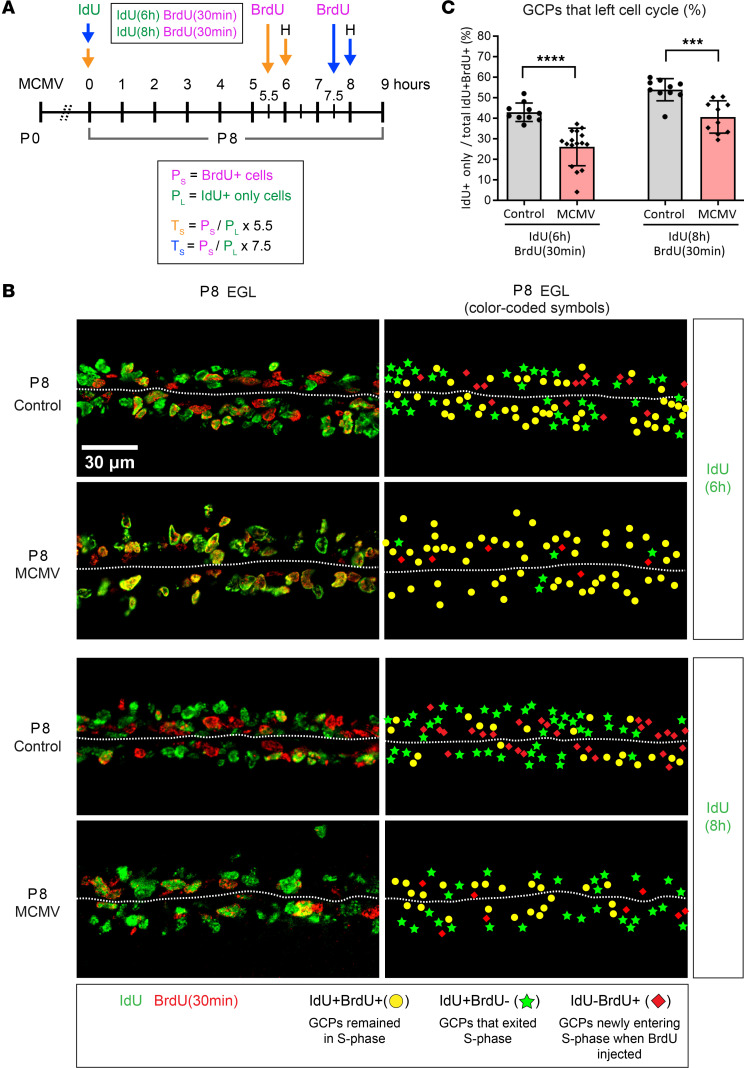
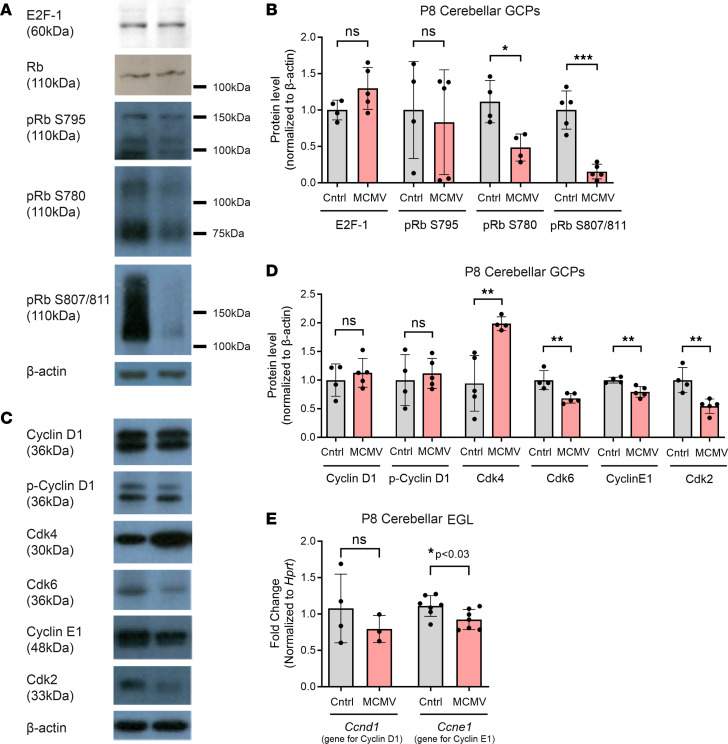
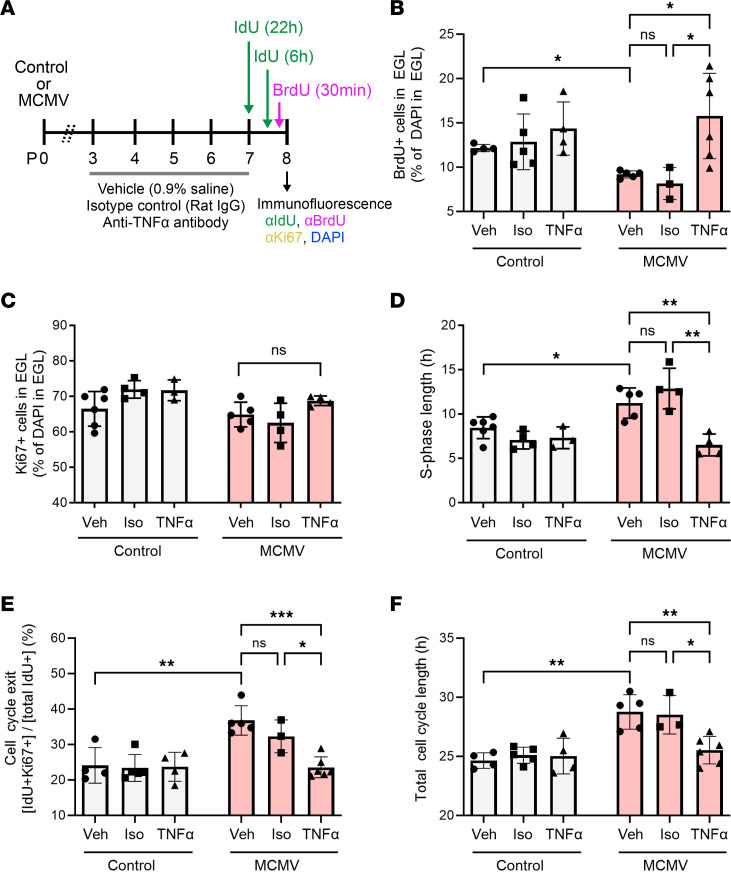
Human cytomegalovirus (HCMV) infection in infants infected in utero can lead to a variety of neurodevelopmental disorders. However, mechanisms underlying altered neurodevelopment in infected infants remain poorly understood. We have previously described a murine model of congenital HCMV infection in which murine CMV (MCMV) spreads hematogenously and establishes a focal infection in all regions of the brain of newborn mice, including the cerebellum. Infection resulted in disruption of cerebellar cortical development characterized by reduced cerebellar size and foliation. This disruption was associated with altered cell cycle progression of the granule cell precursors (GCPs), which are the progenitors that give rise to granule cells (GCs), the most abundant neurons in the cerebellum. In the current study, we have demonstrated that MCMV infection leads to prolonged GCP cell cycle, premature exit from the cell cycle, and reduced numbers of GCs resulting in cerebellar hypoplasia. Treatment with TNF-α neutralizing antibody partially normalized the cell cycle alterations of GCPs and altered cerebellar morphogenesis induced by MCMV infection. Collectively, our results argue that virus-induced inflammation altered the cell cycle of GCPs resulting in a reduced numbers of GCs and cerebellar cortical hypoplasia, thus providing a potential mechanism for altered neurodevelopment in fetuses infected with HCMV.

Keywords: Inflammation; Neurological disorders; Neuroscience.


Conflict of interest statement

Conflict of interest: The authors have declared that no conflict of interest exists.

Figures

Figure 1
Figure 1. MCMV infection induces a robust inflammatory response during the postnatal period.
DNA/RNA was extracted from cerebella of MCMV-infected mice at various time points (P4–P44) as described in Methods. (A) RT-PCR quantitation of MCMV DNA from cerebellum, with each data point representing genome copy number/mg of tissue. (BG) Transcription of inflammatory mediators (Ifit1, Tnf, Il1b [gene for IL-1β], Ifna5a [gene for IFN-α], and Ifnb1 [gene for IFN-β1]) and transcription factor (Stat2) quantified in the postnatal period and adulthood. Hprt was used as an internal control to normalize results, and fold change was calculated between cerebellar RNA from MCMV-infected and control animals. (H) Expression of Ifit1 and Tnf were quantified by RT-PCR using RNA extracted from cerebellar EGL isolated by laser microdissection. A total of 3–6 cerebella were used for each experiment. The data are shown as mean ± SD. Each data point corresponds to a sample from an individual mouse. Statistical analyses were performed using 1-way ANOVA with Dunnett’s multiple-comparison test (main column effect) (AG) or 2-tailed t-test (H). *P < 0.05; **P < 0.01; ***P < 0.001; ****P < 0.0001.
Figure 2
Figure 2. MCMV replicates in the cerebellum during the postnatal period.
(A) Distribution of MCMV-infected cells in P6 (white arrow) and P8 cerebella detected with antibody reactive with MCMV IE-1 (pp89). Scale bar: 200 μm (left column) and 50 μm (right column). (B) Iba1+ mononuclear cells (red) in the cerebellum that also express MCMV IE-1 protein (green). Scale bar: 200 μm (13× images) and 40 μm (60× images). (C) P8 cerebellum double stained for MCMV IE-1 (green) and doublecortin (DCX) (red). DAPI (blue) was used to stain the nucleus. Scale bar: 200 μm (10× images) and 50 μm (40× images). Four cerebella were used per group.
Figure 3
Figure 3. MCMV infection in newborn mice leads to longer cell cycle, increased cell cycle exit, and reduced cell cycle reentry of GCPs.
(A) Schematic of 6-hour BrdU-incorporation protocol. (B) Cell cycle length was estimated as percentage of Ki67 and BrdU double positive cells in total Ki67+ cells (BrdU+Ki67+/total Ki67+ [%]) in EGL with a smaller percentage of double-positive cells indicating longer cell cycle. Representative images appear in Supplemental Figure 1. (C) Schematic of 24 hours BrdU-incorporation protocol. (D) Cell cycle exit defined as percentage of cells no longer in cell cycle defined by number of BrdU+Ki67 cells to all cells labeled with BrdU (green) but not Ki67 (GCP cell cycle exit = BrdU+Ki67/total BrdU+ in the EGL [%]). (E) Cell cycle reentry was defined as the percentage of cells that reentered the following cell cycle represented by ratio of BrdU+Ki67+ cell population to all cells labeled with BrdU (GCP cell cycle reentry = BrdU+Ki67+/total BrdU+ in the EGL [%]). (CE) Please find representative images in Supplemental Figure 3. Data shown as mean ± SD, n = 3–5 mice/experimental group. Images of cerebellar fissure are represented as 2 data points. P values were calculated using 2-tailed t test. *P < 0.05; **P < 0.01; ***P < 0.001; ****P < 0.0001.
Figure 4
Figure 4. Prolonged GCP cell cycle during MCMV infection is due to the lengthening of G1 and S phases.
(A) Schedule of in vivo cumulative BrdU labeling protocol to estimate length of each phase of cell cycle of GCPs in the cerebellar EGL. (B) Representative images of brain sections stained for BrdU (red), DCX (labeling the iEGL; green), and DAPI (nuclei staining; blue) from control and MCMV-infected mice exposed to cumulative BrdU for the indicated time. In MCMV-infected cerebellum, fewer GCPs incorporated BrdU at time points are shown (1, 10, 18, and 24 hours) compared with control mice. Scale bar: 30 μm. (C) BrdU+ GCPs in the oEGL of the cerebella were quantified (BrdU LI) at time points and plotted against duration of BrdU exposure to estimate cell cycle parameters. The BrdU LI was used to determine the duration of the cell cycle (TC) and time required to complete S phase (TS). Refer to Table 1 for cell cycle length (total cell cycle length, G1 phase, and S phase). Data are shown as mean ± SD, n = 3–4 mice/experimental group of the cerebellum.
Figure 5
Figure 5. Prolonged GCP cell cycle during MCMV infection is not due to the lengthening of G2/M phase.
(A) The duration of G2/M phase (TG2+M) was determined by single-dose BrdU labeling for 1, 1.5, and 2 hours and stained for BrdU (red) and for pHH3 (green) to define cells in G2/M phase; see Figure 4A for the schedule of the in vivo cumulative BrdU labeling protocol. pHH3+BrdU cells (light blue open circle) are pHH3+ cells not in S phase at the time of BrdU injection. BrdU+pHH3+ cells (yellow open circle) are cells that incorporated BrdU in the S phase and reached G2/M phase. Scale bar: 30 μm. (B) pHH3 labeling index (pHH3 LI = BrdU+pHH3+/total pHH3+ GCPs in the EGL [%]) was determined. Please refer to Table 1 for cell cycle length (G2/M phase). Data are shown as mean ± SD, n = 4–6 mice/experimental group of the cerebellum. P values were calculated using 2-tailed t test. *P < 0.05; **P < 0.01; ****P < 0.0001.
Figure 6
Figure 6. BrdU-IdU sequential labeling confirms a longer G1 phase of the cell cycle in MCMV-infected mice.
(A) Schematic of the IdU-BrdU dual-labeling protocol to determine total cell cycle length (TC). IdU was injected on P7, followed by BrdU injection at 17.5, 21.5, 24.5, and 27.5 hours after IdU injection on P8. Brains were then harvested 30 minutes later. IdUBrdU+ and total BrdU+ GCPs were quantified to determine the TC. (B) Representative images and images with color-coded symbols of cerebellar EGL indicate a lesser number of GCPs reentered S phase of the subsequent cell cycle (IdU+BrdU+ cells; yellow solid circle) in MCMV-infected mice compared with control mice during interval between IdU and BrdU injections (22 or 25 hours). Cerebellar sections were stained for IdU (green), BrdU (red), and DAPI (blue). Scale bar: 30 μm. Refer to Table 1 for TC. TC was approximately 8.7 hours longer in GCPs in MCMV-infected mice compared with control mice.
Figure 7
Figure 7. BrdU-IdU sequential labeling confirms a longer S phase of the cell cycle in MCMV-infected mice.
(A) Schematic of IdU-BrdU dual-labeling protocol to measure the length of S phase (TS). IdU was injected, followed by BrdU injections at 5.5 and 7.5 hours after IdU injection. Brains were then harvested 30 minutes after the BrdU injection on P8. (B) Representative images with color-coded symbols of cerebellar EGL indicate reduced number of cells that exited S phase in MCMV-infected mice during the inter–injection intervals of 6 or 8 hours. IdU+BrdU+ GCPs are population that remained in S phase (yellow solid circle), and IdU+BrdU GCPs are population that left S phase (green solid star). Scale bar: 30 μm. (C) Percentage of GCPs that left S phase was quantified as IdU+/total IdU+BrdU+ GCPs in the EGL. Refer to Table 1 for cell cycle length (S phase). TS was approximately 5.2 hours longer in GCPs in MCMV-infected mice compared with control mice. Data are shown as mean ± SD, n = 4–6 mice/experimental group of the cerebellum. Images of cerebellar fissure are represented as 2 data points. P values were calculated using 2-tailed t test. ***P < 0.001; ****P < 0.0001.
Figure 8
Figure 8. MCMV infection in newborn mice alters phosphorylation of Rb and levels of cell cycle proteins in GCPs.
(AD) The expression of cell cycle proteins was quantified in GCPs isolated from P8 control and MCMV-infected cerebella by immunoblotting. β-Actin was used as internal control. Four to 5 samples (4 cerebella pooled for each sample)/experimental group were used for immunoblot analysis. (A and B) Expression of total Rb, phosphorylated Rb (pRb), and E2F-1 were quantified. Levels of total Rb, pRb S795, and E2F-1 were unaltered; however, pRb S780 and pRb S807/811 were significantly decreased in GCPs from MCMV-infected mice compared with control mice. Note immunoblots probed for pRb S807/811 were overexposed to allow detection of this form of Rb in GCPs from infected mice. (C and D) GCPs from MCMV-infected cerebella showed differential regulation of Cdk4 and Cdk6 while Cyclin D1 or p-Cyclin D1 were unaltered. Cyclin E1 and Cdk2 levels were reduced in GCPs from MCMV-infected mice cerebella. (E) Transcript levels of Ccnd1 (gene for Cyclin D1) and Ccne1 (gene for Cyclin E1) were quantified by RT-PCR using RNA extracted from cerebellar EGL isolated by laser microdissection. Ccnd1 and Ccne1 transcript levels correlated with the protein levels from isolated GCPs. n = 3–7 mice/experimental group were used for RT-PCR analysis. Data are shown as mean ± SD. P values were calculated using 2-tailed t test. *P < 0.05; **P < 0.01; ***P < 0.001.
Figure 9
Figure 9. Treatment with TNF-NAb normalizes cell cycle abnormalities in MCMV-infected mice.
(A) Schematic representation of IdU-BrdU dual-labeling protocol in MCMV-infected mice and control mice treated with vehicle (Veh), isotype control antibody (Iso), or TNF-α neutralizing antibody (TNF-NAb). Fixed brain sections were stained for IdU, BrdU, Ki67, and DAPI to measure cell cycle parameters as described in previous figures. (B and C) Brain sections from mice treated with BrdU for 30 minutes were analyzed to measure cell proliferation by quantifying BrdU+ (B) and Ki67+ (C) GCPs in the EGL. (D) Mice were labeled with IdU for 6 hours, followed by BrdU injection 30 minutes prior to harvesting brains at P8 to estimate the length of S phase of GCPs in the EGL. (E and F) Mice were pulse labeled with IdU for 22 hours and injected with BrdU 30 minutes prior to harvesting brains at P8 to estimate cell cycle exit (E) and total cell cycle length (F). Data shown as mean ± SD, n = 4–6 mice/experimental group for immunofluorescence. Each data point corresponds to cerebellar EGL from an individual mouse. P values were calculated by using 1-way ANOVA with Tukey’s multiple-comparison test. *P < 0.05; **P < 0.01; ***P < 0.001.

Similar articles

Cited by

References

    1. Malinger G, et al. Fetal cytomegalovirus infection of the brain: the spectrum of sonographic findings. AJNR Am J Neuroradiol. 2003;24(1):28–32. - PMC - PubMed
    1. Gabrielli L, et al. Congenital cytomegalovirus infection: patterns of fetal brain damage. Clin Microbiol Infect. 2012;18(10):E419–E427. doi: 10.1111/j.1469-0691.2012.03983.x. - DOI - PubMed
    1. Koontz T, et al. Altered development of the brain after focal herpesvirus infection of the central nervous system. J Exp Med. 2008;205(2):423–435. doi: 10.1084/jem.20071489. - DOI - PMC - PubMed
    1. Bortolussi G, et al. Age-dependent pattern of cerebellar susceptibility to bilirubin neurotoxicity in vivo in mice. Dis Model Mech. 2014;7(9):1057–1068. doi: 10.1242/dmm.016535. - DOI - PMC - PubMed
    1. Moulden J, et al. Murine models of central nervous system disease following congenital human cytomegalovirus infections. Pathogens. 2021;10(8):1062. doi: 10.3390/pathogens10081062. - DOI - PMC - PubMed

MeSH terms

Substances

Supplementary concepts