Characterizing Modulators of Protease-activated Receptors with a Calcium Mobilization Assay Using a Plate Reader
- PMID: 38856211
- PMCID: PMC12338760
- DOI: 10.3791/66507
Characterizing Modulators of Protease-activated Receptors with a Calcium Mobilization Assay Using a Plate Reader
Abstract
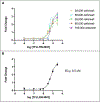
Changes in calcium concentration in cells are rapidly monitored in a high-throughput fashion with the use of intracellular, fluorescent, calcium-binding dyes and imaging instruments that can measure fluorescent emissions from up to 1,536 wells simultaneously. However, these instruments are much more expensive and can be challenging to maintain relative to widely available plate readers that scan wells individually. Described here is an optimized plate reader assay for use with an endothelial cell line (EA.hy926) to measure the protease-activated receptor (PAR)-driven activation of Gαq signaling and subsequent calcium mobilization using the calcium-binding dye Fluo-4. This assay has been used to characterize a range of PAR ligands, including the allosteric PAR1-targeting anti-inflammatory "parmodulin" ligands identified in the Dockendorff lab. This protocol obviates the need for an automated liquid handler and permits the medium-throughput screening of PAR ligands in 96-well plates and should be applicable to the study of other receptors that initiate calcium mobilization.
Figures


Similar articles
-
Management of urinary stones by experts in stone disease (ESD 2025).Arch Ital Urol Androl. 2025 Jun 30;97(2):14085. doi: 10.4081/aiua.2025.14085. Epub 2025 Jun 30. Arch Ital Urol Androl. 2025. PMID: 40583613 Review.
-
Cost-effectiveness of using prognostic information to select women with breast cancer for adjuvant systemic therapy.Health Technol Assess. 2006 Sep;10(34):iii-iv, ix-xi, 1-204. doi: 10.3310/hta10340. Health Technol Assess. 2006. PMID: 16959170
-
Assessing the comparative effects of interventions in COPD: a tutorial on network meta-analysis for clinicians.Respir Res. 2024 Dec 21;25(1):438. doi: 10.1186/s12931-024-03056-x. Respir Res. 2024. PMID: 39709425 Free PMC article. Review.
-
The Black Book of Psychotropic Dosing and Monitoring.Psychopharmacol Bull. 2024 Jul 8;54(3):8-59. Psychopharmacol Bull. 2024. PMID: 38993656 Free PMC article. Review.
-
Can a Liquid Biopsy Detect Circulating Tumor DNA With Low-passage Whole-genome Sequencing in Patients With a Sarcoma? A Pilot Evaluation.Clin Orthop Relat Res. 2025 Jan 1;483(1):39-48. doi: 10.1097/CORR.0000000000003161. Epub 2024 Jun 21. Clin Orthop Relat Res. 2025. PMID: 38905450
References
-
- Rasmussen UB et al. cDNA cloning and expression of a hamster alpha-thrombin receptor coupled to Ca2+ mobilization. FEBS Lett. 288 (1–2), 123–128 (1991). - PubMed
-
- Vu TK, Hung DT, Wheaton VI, Coughlin SR Molecular cloning of a functional thrombin receptor reveals a novel proteolytic mechanism of receptor activation. Cell. 64 (6), 1057–1068 (1991). - PubMed
-
- Vu TK, Wheaton VI, Hung DT, Charo I, Coughlin SR Domains specifying thrombin-receptor interaction. Nature. 353 (6345), 674–677 (1991). - PubMed
-
- Coughlin SR Thrombin signalling and protease-activated receptors. Nature. 407 (6801), 258–264 (2000). - PubMed
-
- Adams MN et al. Structure, function and pathophysiology of protease activated receptors. Pharmacol. Ther. 130 (3), 248–282 (2011). - PubMed
Publication types
MeSH terms
Substances
Grants and funding
LinkOut - more resources
Full Text Sources
Miscellaneous
