Puncture Wound Hemostasis and Preparation of Samples for Montaged Wide-Area Electron Microscopy Analysis
- PMID: 38856226
- PMCID: PMC11637564
- DOI: 10.3791/66479
Puncture Wound Hemostasis and Preparation of Samples for Montaged Wide-Area Electron Microscopy Analysis
Abstract
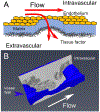
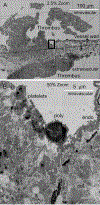
Hemostasis, the process of normal physiological control of vascular damage, is fundamental to human life. We all suffer minor cuts and puncture wounds from time to time. In hemostasis, self-limiting platelet aggregation leads to the formation of a structured thrombus in which bleeding cessation comes from capping the hole from the outside. Detailed characterization of this structure could lead to distinctions between hemostasis and thrombosis, a case of excessive platelet aggregation leading to occlusive clotting. An imaging-based approach to puncture wound thrombus structure is presented here that draws upon the ability of thin-section electron microscopy to visualize the interior of hemostatic thrombi. The most basic step in any imaging-based experimental protocol is good sample preparation. The protocol provides detailed procedures for preparing puncture wounds and platelet-rich thrombi in mice for subsequent electron microscopy. A detailed procedure is given for in situ fixation of the forming puncture wound thrombus and its subsequent processing for staining and embedding for electron microscopy. Electron microscopy is presented as the end imaging technique because of its ability, when combined with sequential sectioning, to visualize the details of the thrombus interior at high resolution. As an imaging method, electron microscopy gives unbiased sampling and an experimental output that scales from nanometer to millimeters in 2 or 3 dimensions. Appropriate freeware electron microscopy software is cited that will support wide-area electron microscopy in which hundreds of frames can be blended to give nanometer-scale imaging of entire puncture wound thrombi cross-sections. Hence, any subregion of the image file can be placed easily into the context of the full cross-section.
Conflict of interest statement
DISCLOSURES:
The authors have no conflicts of interest related to this study.
Figures


Similar articles
-
Venous puncture wound hemostasis results in a vaulted thrombus structured by locally nucleated platelet aggregates.Commun Biol. 2021 Sep 16;4(1):1090. doi: 10.1038/s42003-021-02615-y. Commun Biol. 2021. PMID: 34531522 Free PMC article.
-
Use of electron microscopy to study platelets and thrombi.Platelets. 2020 Jul 3;31(5):580-588. doi: 10.1080/09537104.2020.1763939. Epub 2020 May 18. Platelets. 2020. PMID: 32423268 Free PMC article. Review.
-
First Selective 12-LOX Inhibitor, ML355, Impairs Thrombus Formation and Vessel Occlusion In Vivo With Minimal Effects on Hemostasis.Arterioscler Thromb Vasc Biol. 2017 Oct;37(10):1828-1839. doi: 10.1161/ATVBAHA.117.309868. Epub 2017 Aug 3. Arterioscler Thromb Vasc Biol. 2017. PMID: 28775075 Free PMC article.
-
A systems approach to hemostasis: 4. How hemostatic thrombi limit the loss of plasma-borne molecules from the microvasculature.Blood. 2016 Mar 24;127(12):1598-605. doi: 10.1182/blood-2015-09-672188. Epub 2016 Jan 6. Blood. 2016. PMID: 26738537 Free PMC article.
-
Platelet Signaling in Primary Haemostasis and Arterial Thrombus Formation: Part 1.Hamostaseologie. 2018 Nov;38(4):203-210. doi: 10.1055/s-0038-1675144. Epub 2018 Oct 23. Hamostaseologie. 2018. PMID: 30352470 Review.
Cited by
-
Contrasting Effects of Platelet GPVI Deletion Versus Syk Inhibition on Mouse Jugular Vein Puncture Wound Structure.Int J Mol Sci. 2025 May 1;26(9):4294. doi: 10.3390/ijms26094294. Int J Mol Sci. 2025. PMID: 40362537 Free PMC article.
References
Publication types
MeSH terms
Grants and funding
LinkOut - more resources
Full Text Sources
Medical
Research Materials
