. 2024 Jul 9;12(14):3633-3648.
doi: 10.1039/d4bm00391h.

From bone to nanoparticles: development of a novel generation of bone derived nanoparticles for image guided orthopedic regeneration

Affiliations

From bone to nanoparticles: development of a novel generation of bone derived nanoparticles for image guided orthopedic regeneration

Austin Stellpflug et al. Biomater Sci. .

Abstract

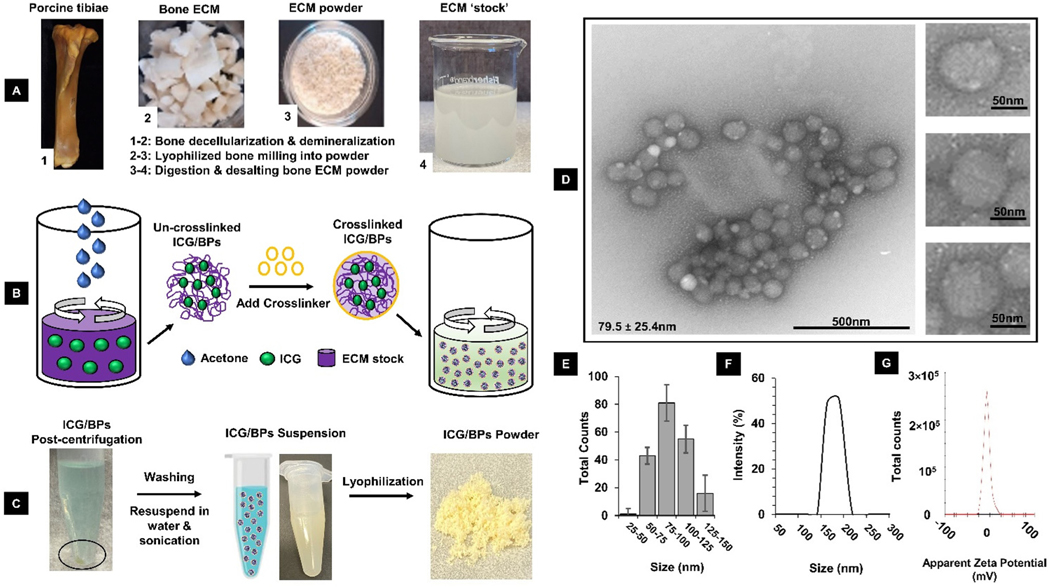
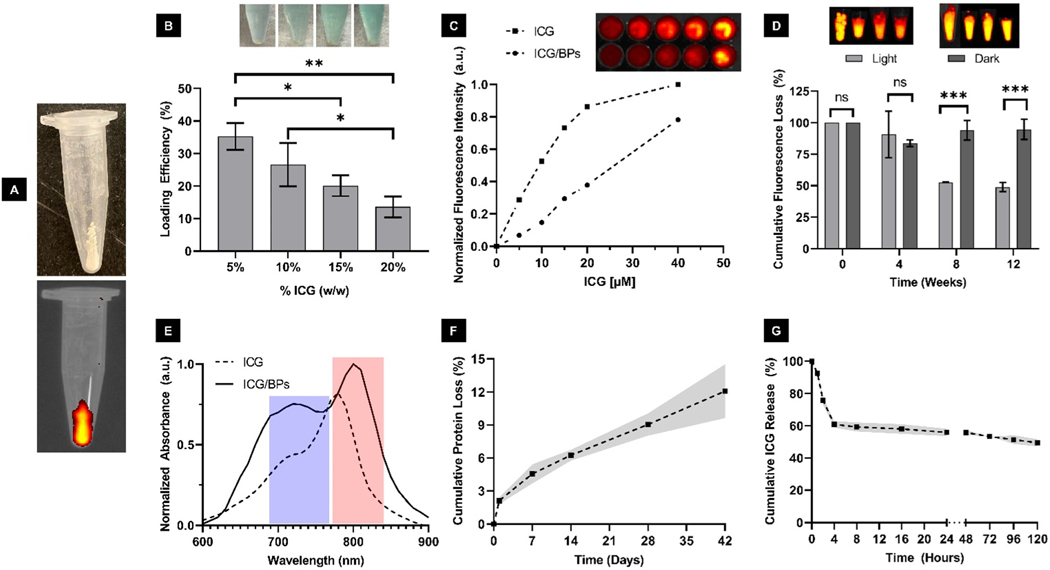
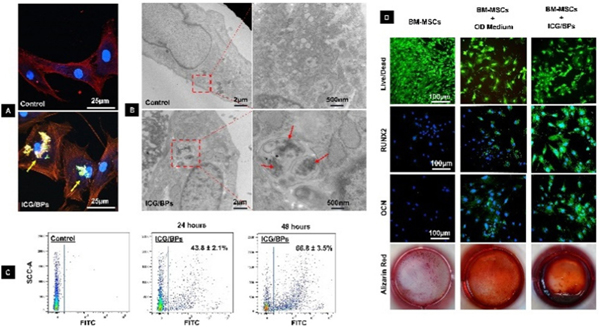
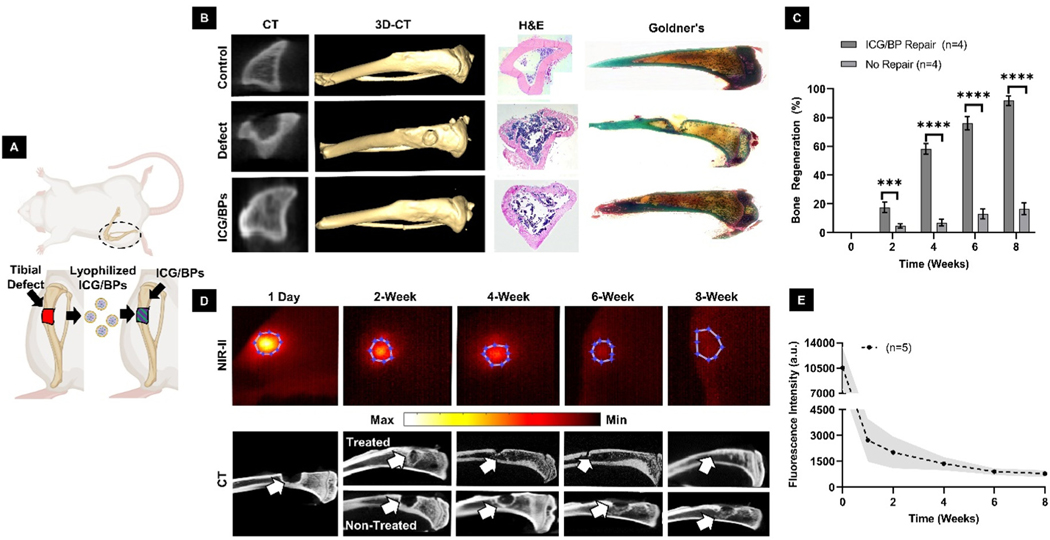
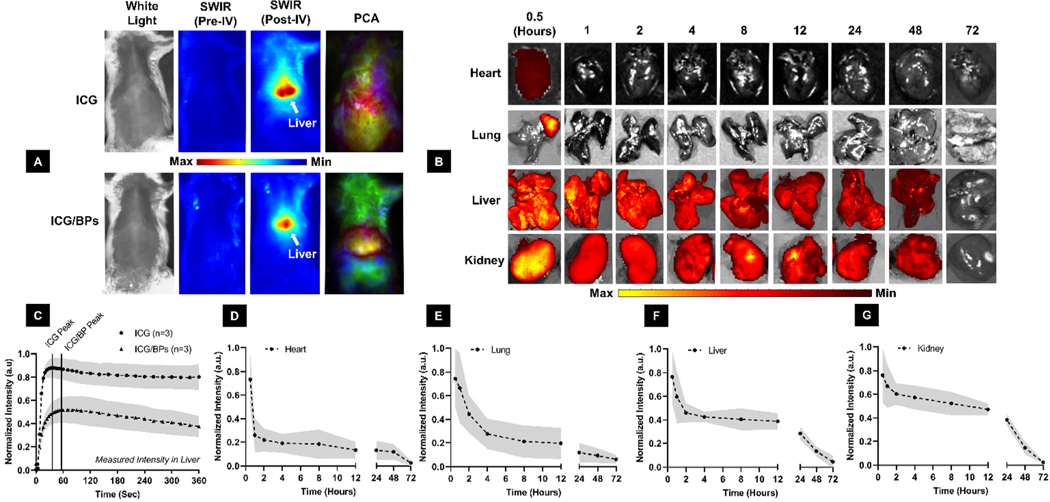
Bone related diseases such as osteoporosis, osteoarthritis, metastatic bone cancer, osteogenesis imperfecta, and Paget's disease, are primarily treated with pharmacologic therapies that often exhibit limited efficacy and substantial side effects. Bone injuries or fractures are primarily repaired with biocompatible materials that produce mixed results in sufficiently regenerating healthy and homogenous bone tissue. Each of these bone conditions, both localized and systemic, use different strategies with the same goal of achieving a healthy and homeostatic bone environment. In this study, we developed a new type of bone-based nanoparticle (BPs) using the entire organic extracellular matrix (ECM) of decellularized porcine bone, additionally encapsulating indocyanine green dye (ICG) for an in vivo monitoring capability. Utilizing the regenerative capability of bone ECM and the functionality of nanoparticles, the ICG encapsulated BPs (ICG/BPs) have been demonstrated to be utilized as a therapeutic option for localized and systemic orthopedic conditions. Additionally, ICG enables an in situ monitoring capability in the Short-Wave Infrared (SWIR) spectrum, capturing the degradation or the biodistribution of the ICG/BPs after both local implantation and intravenous administration, respectively. The efficacy and safety of the ICG/BPs shown within this study lay the foundation for future investigations, which will delve into optimization for clinical translation.


Conflict of interest statement

Conflicts of interest

The authors declare that they have no conflict of interest.

Figures

Fig. 1
Fig. 1
Summary of bone decellularization, digestion, and ICG/BP synthesis process. (A) Porcine tibiae were harvested, decellularized, demineralized, and digested to prepare the ECM stock solution. (B) ICG/BPs were formulated by mixing free ICG dye with the ECM stock, using desolvation via acetone precipitation, and chemical crosslinking. (C) The ICG/BPs could be made into an aqueous solution or lyophilized into a powder. (D) TEM imagery of the ICG/BPs, with multiple particles displaying a small, spherical morphology (79.5 ± 25.4 nm). (E) Size distribution of the ICG/BPs based on TEM imaging. (F) Measured size destitution of the ICG/BPs using DLS (171 ± 11.4 nm). (G) Measured Zeta potential of the ICG/BPs (−6.3 ± 1.9 mV).
Fig. 2
Fig. 2
Optical characterization and stability of ICG/BPs. (A) ICG/BPs post-synthesis and the observed fluorescence in the NIR window (840 nm). (B) Loading efficiency (LE) of the ICG/BPs using different initial concentrations of ICG during synthesis, with a decreased loading efficiency consistent with a greener supernatant. (C) Absorption measurements of ICG (5 μM) and the ICG/BPs (10 μM encapsulated ICG), showing two characteristic peaks in the NIR region represented by the blue bar (∼720 nm) and red bar (∼780 nm), with the ICG/BPs displaying a slight red shift of ∼10–20 nm. (D) Fluorescent intensity of ICG and ICG/BPs using equivalent concentrations of ICG for each respective solution, measured in the NIR window (840 nm). (E) Long-term photostability of the ICG/BPs when either constantly exposed to or sheltered from light, measured in the SWIR window (950 nm). (F) Degradation of the ICG/BPs as measured by cumulative protein loss (mg) over 42 days. (G) ICG released from the ICG/BPs at different timepoints over the course of 5 days. (One way ANOVA followed by group post hoc comparison was performed on select data, statistical significance is quantified as: ****P<0.0001; ***P<0.001; **P<0.01; *P<0.05, ns = no significance).
Fig. 3
Fig. 3
Cellular uptake and compatibility of ICG/BPs. After 24 hours of co-culturing BMSCs with ICG/BPs, the cellular uptake of the particles was analysed using (A) confocal laser scanning microscopy and (B) TEM imaging. (C) The percentage of cellular uptake was determined by flow cytometry after co-culturing BMSCs with ICG/BPs for 24 and 48 hours. (D) After 4 weeks of cell culture, the cytotoxicity of the ICG/BPs was determined by Live/Dead staining and osteogenic differentiation was evaluated with RUNX2 and OCN staining, and calcium deposition measured with alizarin red S staining.
Fig. 4
Fig. 4
Bone regeneration and in situ SWIR monitoring. (A) A surgically created tibial defect was filled with ICG/BP powder. (B) CT of the axial plane (column 1), 3D-CT of the longitudinal plane (column 2), H&E (column 3), and Masson-Goldner’s Trichrome Stain (column 4) were used to compare the morphological and histological differences among the control group (row 1), defect group (row 2), and ICG/BP group (row 3). (C) Total percent of bone regeneration and comparison between the defect group (No Repair) and ICG/BP group (ICG/BP Repair). (D) SWIR imaging of a tibial defect with implanted ICG/BPs post-surgery (top) over the course of 8 weeks, and the corresponding CT of the bone (bottom). (E) Mean collected data of SWIR fluorescence intensity over 8 weeks. (One way ANOVA followed by group post hoc comparison was performed on select data, statistical significance is quantified as: ****P<0.0001; ***P<0.001; **P<0.01; *P<0.05, ns = no significance).
Fig. 5
Fig. 5
Dynamic in situ monitoring of ICG/BPs and biodistribution. (A) White light images (column 1) were used to subtract background fluorescence to obtain the pure SWIR spectrum image both pre- (column 2) and post-IV administration (column 3). PCA (column 4) was used to quantify segment anatomical regions of interest, in this case the liver, over the course of the experiment. (B) Ex vivo fluorescence imaging of the heart, lungs, liver, and kidneys to determine the biodistribution of the ICG/BPs up to 72 hours post-administration, measured in the NIR window (840 nm) (C) Normalized fluorescence intensity of both free ICG and the ICG/BPs collected from PCA analysis, with a noticeably later peak of intensity in the liver for the ICG/BPs than the free ICG dye. Mean fluorescence intensity in the heart (D), lungs (E), liver (F), and kidney (G) collected from (B).
Fig. 6
Fig. 6
H&E staining of organs 15 days after systemic administration. Images of the (A) lung, (B) liver, (C) kidney, and (D) spleen in different experimental groups, with no noticeable changes between groups. (Br = Bronchiole, BV = Blood Vessel, PV = Portal Vein, BD = Bile Duct, GL = Glomerulus, BC = Bowman’s Capsule, DCT = Distal Convoluted Tubule, PCT = Proximal Convoluted Tubule, CA = Central Arteriole).

Similar articles

Cited by

References

    1. Laurencin CT, Ambrosio AM, Borden MD and Cooper JA Jr., Annu. Rev. Biomed. Eng, 1999, 1, 19–46. - PubMed
    1. Bhatt RA and Rozental TD, Handb. Clin, 2012, 28, 457–468. - PubMed
    1. Bullock G, Atkinson J, Gentile P, Hatton P and Miller C, J. Funct. Biomater, 2021, 12, 22. - PMC - PubMed
    1. Lobb DC, DeGeorge BR Jr. and Chhabra AB, J. Hand Surg., Am., 2019, 44, 497–505.e2. - PubMed
    1. Rupp M, Klute L, Baertl S, Walter N, Mannala GK, Frank L, Pfeifer C, Alt V and Kerschbaum M, J. Biomed. Mater. Res., Part B, 2022, 110, 350–357. - PubMed

Substances

LinkOut - more resources