. 2024 Sep 3;5(5):353-370.
doi: 10.1158/2643-3230.BCD-23-0230.

Mis-splicing of Mitotic Regulators Sensitizes SF3B1-Mutated Human HSCs to CHK1 Inhibition

Affiliations

Mis-splicing of Mitotic Regulators Sensitizes SF3B1-Mutated Human HSCs to CHK1 Inhibition

Martina Sarchi et al. Blood Cancer Discov. .

Abstract

Splicing factor SF3B1 mutations are frequent somatic lesions in myeloid neoplasms that transform hematopoietic stem cells (HSCs) by inducing mis-splicing of target genes. However, the molecular and functional consequences of SF3B1 mutations in human HSCs and progenitors (HSPCs) remain unclear. Here, we identify the mis-splicing program in human HSPCs as a targetable vulnerability by precise gene editing of SF3B1 K700E mutations in primary CD34+ cells. Mutant SF3B1 induced pervasive mis-splicing and reduced expression of genes regulating mitosis and genome maintenance leading to altered differentiation, delayed G2/M progression, and profound sensitivity to CHK1 inhibition (CHK1i). Mis-splicing or reduced expression of mitotic regulators BUBR1 and CDC27 delayed G2/M transit and promoted CHK1i sensitivity. Clinical CHK1i prexasertib selectively targeted SF3B1-mutant immunophenotypic HSCs and abrogated engraftment in vivo. These findings identify mis-splicing of mitotic regulators in SF3B1-mutant HSPCs as a targetable vulnerability engaged by pharmacological CHK1 inhibition. Significance: In this study, we engineer precise SF3B1 mutations in human HSPCs and identify CHK1 inhibition as a selective vulnerability promoted by mis-splicing of mitotic regulators. These findings uncover the mis-splicing program induced by mutant SF3B1 in human HSPCs and show that it can be therapeutically targeted by clinical CHK1 inhibitors.


Conflict of interest statement

Dr. Bradley reports grants, personal fees, and other support from Codify Therapeutics and other support from Synthesize Bio outside the submitted work.

Figures
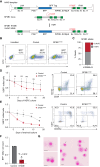
Figure 1.
Figure 1.
Efficient editing of SF3B1 K700E mutation in primary CD34+ HSPCs. A, Schematic of the SF3B1 K700E gene editing strategy showing the design of the AAV6 repair template encoding the BFP transgene, unedited SF3B1 locus showing exons (green), introns (gray), the sgRNA cut site in exon 15, and the edited SF3B1 locus after homology-directed recombination. LHA, RHA: left and right homology arms; HDR: homology-directed repair. B, Representative gene editing efficiency as measured by BFP transgene expression 3 days after AAVS1 or SF3B1 gene editing in CB CD34+ HSPCs. FITC: empty channel. C, Percent of SF3B1 WT and K700E transcripts based on RNA-seq reads in SF3B1-edited BFP+ HSPCs, confirming heterozygous expression of the mutant allele. D, Percent of SF3B1 K700E or K700K control edited cells over 18 days of HSPC liquid culture (left) and representative flow staining for CD34+CD133+ HSC markers on day 10 (right). % BFP was normalized to day 0 for each experiment. Mean ± SD of n = 3 experiments with independent CB donors; paired t test; *, P < 0.05; **, P < 0.01; ***, P < 0.001. E, Percent of SF3B1 K700E or control edited cells over 18 days of erythroid differentiation culture (left), and representative flow staining for CD235a+CD71+ erythroblasts on day 10 (right). % BFP was normalized to day 3 for each experiment. Mean ± SD of n = 3 experiments with independent CB donors; paired t test; *, P < 0.05; **, P < 0.01; ***, P < 0.001. F, Number of SF3B1 K700E mutant CD235a+ erythroid cells after 18 days of erythroid culture normalized to control. Mean ± SD of n = 3 experiments with independent CB donors; one-sample t test. G, Representative Prussian blue staining for ring sideroblasts (arrows) of SF3B1 mutant BFP+ erythroid cells on day 18 of differentiation. Scale bar, 10 µm.
Figure 2.
Figure 2.
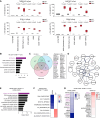
Pervasive mis-splicing of cell division and genome maintenance genes in CD34+ HSPCs. A, Percent mis-splicing of TMEM14C, MAP3K7, DYNLL1, and ORAI2 mRNA in patients with SF3B1 WT or mutant (MUT) MDS, iPSC-derived HSPCs, K562 cells, and edited CD34+ CB and PB HSPCs, or normal BM. Median and range; *, P < 0.05; **, P < 0.01; ***, P < 0.001; ****, P < 0.0001; one-sided Mann–Whitney U test. B, Gene ontology (GO) analysis of a3′ss mis-splicing targets in SF3B1 K700E edited PB CD34+ HSPCs. GO performed using Metascape showing summary terms; ≥10% mis-splicing, Bayes factor ≥5. C, Overlap between mis-spliced a3′ss events in CD34+ CB, CD34+ PB and K562 SF3B1 K700E cells, and list of recurrently mis-spliced genes in all three cell types (right); ≥10% mis-splicing, Bayes factor ≥5. D, STRING protein–protein interaction network of CB/PB a3′ss mis-spliced genes in the cell division GO category; disconnected nodes removed, line thickness proportional to interaction score >0.40. E, GO analysis of genes downregulated in SF3B1 K700E CD34+ CB/PB HSPCs (log2 fold change ≤ −0.5; P < 0.05). GO performed using Metascape showing summary terms. F, Hallmark pathways upregulated or downregulated in SF3B1 K700E vs. control edited CD34+ CB/PB HSPCs; >25 genes, FDR < 0.01. NES, normalized enrichment score. G, Significantly down- or up-regulated genes among 186 genes with conserved a3′ss mis-splicing in both CB and PB CD34+ HSPCs from Supplementary Fig. S2B. Expression ranked by log2 fold change in SF3B1 K700E vs. control edited CD34+ HSPCs, P < 0.1. Mitosis-related terms are shown in purple color.
Figure 3.
Figure 3.
Single-cell transcriptome analysis of SF3B1-mutant HSPCs. A, Combined UMAP of SF3B1 K700E and control AAVS1 edited (WT) CB BFP+CD34+ cells showing unsupervised clustering in Scanpy. Clusters were annotated based on the expression of lineage-specific genes in B. B, Relative expression of lineage-specific marker genes across clusters 0–14: HSPC; GMP; MEP; MCP; EoBP; Ly, lymphoid; Ery, erythroid; Mk, megakaryocyte. Also see Supplementary Fig. S2D. C, UMAP density plot of control (left) and SF3B1-mutant (right) cell distribution with cell type designations superimposed from A. D, GO analysis of genes downregulated (log2 fold change < –0.25, adj. P < 0.05) in SF3B1-mutant vs. control HSPC, MEP, GMP, and MCP. GO annotation was performed using Metascape multisample mode showing summary terms. E, Hallmark pathways upregulated or downregulated in SF3B1 K700E vs. control HSPC, MEP, GMP, and MCP. Annotation was performed using GSEA with gene lists ranked by log2 fold change (adj. P < 0.05). Only significant terms are shown (>25 genes, FDR < 0.01). NES, normalized enrichment score.
Figure 4.
Figure 4.
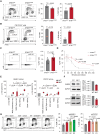
SF3B1-mutant cells have delayed G2/M cell cycle progression. A, EdU cell cycle analysis of WT and SF3B1 K700E K562 cells. Representative flow plots (left) and quantitation (right) of the proportion in S or G2/M phase. Mean ± SD, n = 6 independent experiments, unpaired t test. B, EdU cell cycle analysis of control or SF3B1 K700E edited CB cells expressing HSC marker CD133. Representative flow plots (left) and quantitation (right). Mean ± SD, n = 2 independent experiments, paired t test. C, Proportion of WT and SF3B1 K700E K562 cells positive for pH3, a marker of mitosis. Representative flow plots (left) and quantitation (right). Mean ± SD, of n = 8 experiments, unpaired t test. D, Proportion of pH3-positive mitotic WT and SF3B1-mutant cells after release from G2/M block using CDK1 inhibitor RO-3306. n = 2 independent time-course experiments, unpaired t test. E, Mis-splicing of BUBR1 and CDC27 in SF3B1 WT or mutant (MUT) MDS patients, iPSC-HSPCs, K562 cells, and edited CB/PB CD34+ HSPCs, or normal bone marrow (BM); significance shown using 1-sided Mann–Whitney U test. F, Western Blot analysis of BUBR1 (top) and CDC27 (bottom) protein level in SF3B1-mutant (MUT) and WT K562 cells. Expression normalized to GAPDH and shown as fold change relative to WT; n = 3 experiments, mean ± SD. G, EdU cell cycle analysis of WT K562 cells transduced with control luciferase (WT), BUBR1 (B2, B3), or CDC27 (C2, C3) shRNAs, or SF3B1-mutant K562 cells transduced with control shRNA (MUT). Left: representative EdU cell cycle flow plots. Right: proportion of BUBR1 (left) or CDC27 (right) knockdown K562 cells in G2/M phase. Mean ± SD, of n = 4 experiments; unpaired t test.
Figure 5.
Figure 5.
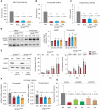
SF3B1-mutant cells are selectively sensitized to CHK1 inhibition. A–C, IC50 value of CHK1 inhibitor AZD-7762 (A), CHK1 inhibitor prexasertib LY2606368 (B), or SF3b inhibitor pladienolide B (C) in WT (Ctrl) or SF3B1-mutant (S-A, S-R, S-S) K562 cells. Cells were treated with drugs in a dose-response format for 5 days. Mean ± SD, of four independent experiments, one-way ANOVA with Dunnett’s correction for multiple comparisons. D, CHK1 phosphorylation in WT (Ctrl) or SF3B1-mutant (S-A, S-R, S-S) K562 cells. Left: Western blot analysis of pCHK1 (S345) and total CHK1 treated for 5 hours with DMSO or 10 nmol/L CHK1i prexasertib. Right: Ratio of pCHK1 to total CHK1 in SF3B1-mutant normalized to WT cells. n = 2 independent experiments, two technical replicates. E, Cell growth of WT and SF3B1-mutant K562 cells after CRISPR-mediated ablation of CHK1. Left: CHK1 protein level after control AAVS1 (sgCtrl) or CHK1 (sgCHK1) knockout. Right: Cell growth of WT and SF3B1-mutant cells with sgCHK1 or sgCtrl at 3–6 days of culture, relative to day 0 (72 hours after editing). n = 3 independent experiments, ratio paired t test. F, Number of CB-derived control (Ctrl) or SF3B1 K700E-edited (S-A, S-R, S-S) CD34+ HSPCs after treatment with 2.5 nmol/L pladienolide B (right) or 2.5 nmol/L CHK1i prexasertib (left) for 7 days. Fold change of CD34+ cell number after drug treatment was calculated relative to vehicle (DMSO). Mean ± SD, of n = 3 independent experiments; paired t test. G, IC50 value of CHK1i prexasertib in WT K562 cells transduced with control luciferase (WT), BUBR1 (B2, B3), or CDC27 (C2, C3) shRNAs, or SF3B1-mutant K562 cells transduced with control shRNA (MUT). Cells were treated with prexasertib in a dose response format for 5 days; two independent shRNAs, two sets of lines independently generated for each condition. Mean ± SD, of three independent experiments, one-way ANOVA with Dunnett’s correction for multiple comparisons.
Figure 6.
Figure 6.
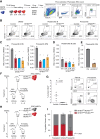
CHK1 inhibition selectively targets SF3B1-mutant HSCs. A, Experimental strategy to determine the number of WT (Ctrl) or SF3B1 K700E-edited (BFP+) CD34+CD133+(CD38) phenotypic HSCs after drug treatment; BV605: empty channel. B, Representative flow plots of the % CD34+CD133+ cells after 7 days of treatment with vehicle (DMSO), 2.5 nmol/L pladienolide B, or 2.5 nmol/L prexasertib. C, Number of CD34+CD133+ phenotypic HSCs edited for control (Ctrl) or SF3B1 K700E (S-A, S-R, S-S) after 7 days of treatment with 2.5 nmol/L prexasertib. CD34+ cells derived from CB (left) or PB (right) donors. Fold change of CD34+CD133+ phenotypic HSC number after drug treatment was calculated for each genotype, relative to vehicle (DMSO). Mean ± SD, of n = 3 independent experiments; *, P < 0.05; **, P < 0.01; paired t test. D, Same as C with 2.5 nmol/L pladienolide B (CB). E, Number of normal CB CD34+CD133+ phenotypic HSCs transduced with control or CDC27 shRNA after 7 days of treatment with 2.5 nmol/L prexasertib. Mean ± SD, of n = 2 independent experiments; paired t test. F, Experimental approach for in vivo treatment with prexasertib CHK1i. NSG-SGM3 mice were transplanted with SF3B1/RUNX1 mutant MDS patient iPSC-derived HSPCs and treated with vehicle (Captisol) or 10 mg/kg prexasertib hydrochloride for 3 weeks. G, Engraftment of SF3B1/RUNX1 mutant iPSC-HSPCs in NSG-SGM3 mice treated with vehicle or CHK1i for 3 weeks. Right: representative flow plots and gating strategy to determine human engraftment. Human engraftment was determined as % of human CD45+CD33+ cells in the injected femur 7 weeks after transplantation. Mean ± SD, of n = 6 vehicle and n = 6 CHK1i mice, unpaired t test. H, Experimental approach for in vivo treatment with prexasertib CHK1i of mice co-transplanted with SF3B1-WT and mutant cells. NSG-SGM3 mice were transplanted with SF3B1-WT/RUNX1-mutant and SF3B1/RUNX1 double-mutant iPSC-HSPCs in a 1:1 ratio and treated with vehicle (Captisol) or 10 mg/kg prexasertib hydrochloride for 3 weeks. I, Percentage of SF3B1-mutant iPSC-HSPCs of human engraftment in NSG-SGM3 mice co-transplanted with SF3B1-WT and mutant cells and treated with vehicle or CHK1i for 3 weeks. Human CD45+CD33+ cells were isolated from individual mice and % of SF3B1 K700E cells determined by amplicon next generation sequencing. Mean ± SD, of n = 3 vehicle and n = 3 CHK1i mice, unpaired t test.

References

    1. Bernard E, Tuechler H, Greenberg PL, Hasserjian RP, Ossa JEA, Nannya Y, et al. . Molecular international prognostic scoring system for myelodysplastic syndromes. NEJM Evid 2022;1:1–14. - PubMed
    1. Malcovati L, Stevenson K, Papaemmanuil E, Neuberg D, Bejar R, Boultwood J, et al. . SF3B1-mutant myelodysplastic syndrome as a distinct disease subtype—a proposal of the International Working Group for the Prognosis of MDS. Blood 2020;136:157–70. - PMC - PubMed
    1. Mian SA, Rouault-Pierre K, Smith AE, Seidl T, Pizzitola I, Kizilors A, et al. . SF3B1 mutant MDS-initiating cells may arise from the haematopoietic stem cell compartment. Nat Commun 2015;6:10004. - PMC - PubMed
    1. Mortera-Blanco T, Dimitriou M, Woll PS, Karimi M, Elvarsdottir E, Conte S, et al. . SF3B1-initiating mutations in MDS-RSs target lymphomyeloid hematopoietic stem cells. Blood 2017;130:881–90. - PMC - PubMed
    1. Darman RB, Seiler M, Agrawal A, Lim KH, Peng S, Aird D, et al. . Cancer-associated SF3B1 hotspot mutations induce cryptic 3’ splice site selection through use of a different branch point. Cell Rep 2015;13:1033–45. - PubMed

MeSH terms