. 2024 Jun 10:12:RP92673.
doi: 10.7554/eLife.92673.

Cell-autonomous role of leucine-rich repeat kinase in the protection of dopaminergic neuron survival

Affiliations

Cell-autonomous role of leucine-rich repeat kinase in the protection of dopaminergic neuron survival

Jongkyun Kang et al. Elife. .

Abstract

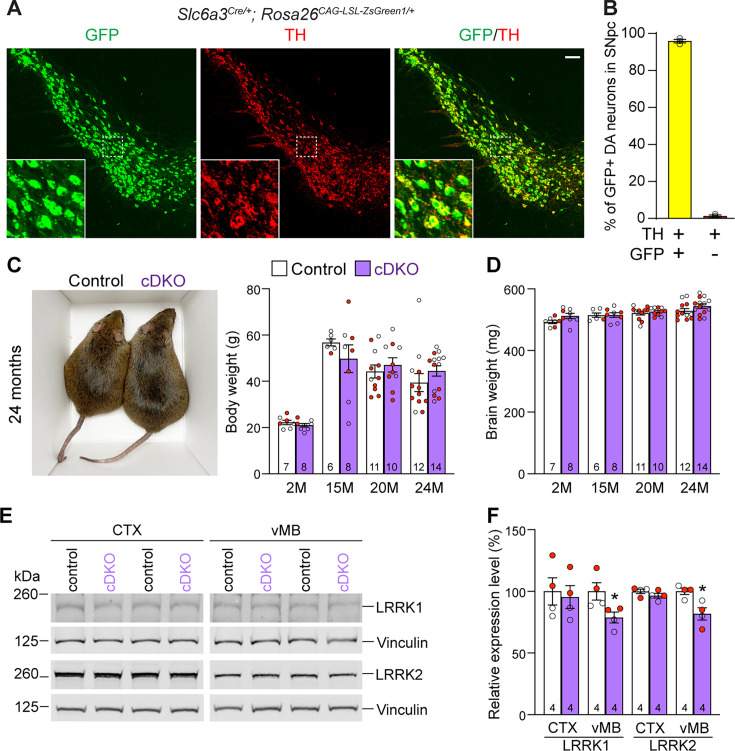
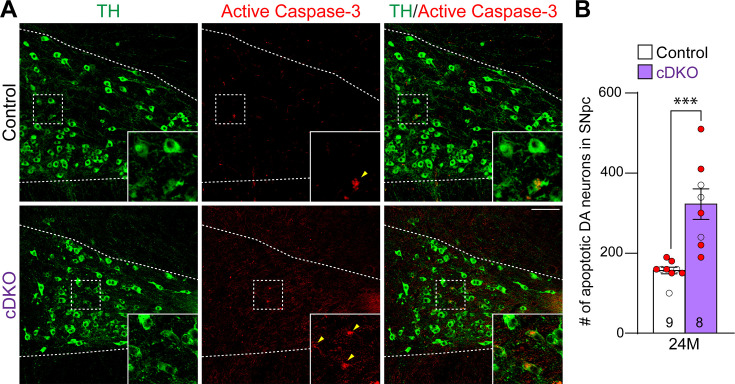
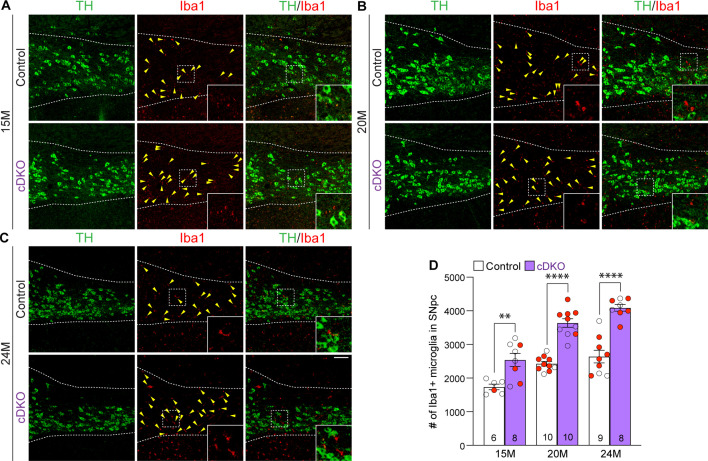
Mutations in leucine-rich repeat kinase 2 (LRRK2) are the most common genetic cause of Parkinson's disease (PD). However, whether LRRK2 mutations cause PD and degeneration of dopaminergic (DA) neurons via a toxic gain-of-function or a loss-of-function mechanism is unresolved and has pivotal implications for LRRK2-based PD therapies. In this study, we investigate whether Lrrk2 and its functional homolog Lrrk1 play a cell-intrinsic role in DA neuron survival through the development of DA neuron-specific Lrrk conditional double knockout (cDKO) mice. Unlike Lrrk germline DKO mice, DA neuron-restricted Lrrk cDKO mice exhibit normal mortality but develop age-dependent loss of DA neurons, as shown by the progressive reduction of DA neurons in the substantia nigra pars compacta (SNpc) at the ages of 20 and 24 months. Moreover, DA neurodegeneration is accompanied with increases in apoptosis and elevated microgliosis in the SNpc as well as decreases in DA terminals in the striatum, and is preceded by impaired motor coordination. Taken together, these findings provide the unequivocal evidence for the cell-intrinsic requirement of LRRK in DA neurons and raise the possibility that LRRK2 mutations may impair its protection of DA neurons, leading to DA neurodegeneration in PD.

Keywords: LRRK1; LRRK2; Parkinson's disease; conditional knock-out mice; dopaminergic neuron; mouse; neuroscience; substantia nigra pars compacta.


Conflict of interest statement

JK, GH, LM, YT, AS, PC, JS No competing interests declared

Figures

Figure 1.
Figure 1.. Generation and characterization of floxed and deleted Lrrk1 and Lrrk2 alleles.
(A) Schematic illustrations of human LRRK1 and LRRK2 proteins showing similar functional domains. LRRK12015 protein is derived from exons 2–34 (Ensembl Genome Database: ENSG00000154237). LRRK22527 protein is derived from exons 1–51 (ENSG00000188906). LRR: leucine-rich repeats; Roc: Ras-of-complex; COR: C-terminal of Roc; KIN: kinase domain. (B) Schematic illustrations of the gene structures of mouse Lrrk1 and Lrrk2. The boxes in blue are exons that encode the LRRK1 and LRRK2 proteins, and the gray boxes represent the 5' and 3' UTRs. The exons are not drawn in scale. The start codon ATG is in exon 2 of Lrrk1 and exon 1 of Lrrk2. The exons 27–29 of Lrrk1 and the promoter/exons 1–2 of Lrrk2 are flanked with loxP sites (green arrowheads). (C) Targeting strategy for the generation of the targeted, floxed, and deleted Lrrk1 alleles. The red boxes represent the targeted exons 27–29, and the blue boxes represent the untargeted exons. The locations and sizes of the 5' and 3' external probes are shown. The targeting vector contains the 5' and 3' homologous regions (marked by dashed lines) and the middle region (from intron 26 to intron 29), which includes a loxP site (green arrowhead) in intron 26 (1288 bp upstream of exon 27) and the Pgk-neo selection cassette flanked by two FRT (FLP recognition target) sequences (gray circles) followed by another loxP site in intron 29 (1023 bp downstream of exon 29). A negative selection cassette encoding diphtheria toxin fragment A (DTA) is also included in the targeting vector to reduce embryonic stem (ES) cells bearing randomly inserted targeting vectors. ES cells carrying the correctly targeted Lrrk1 allele were transfected with pCAG-FLP to remove the Pgk-neo cassette and generate the floxed Lrrk1 allele. Floxed Lrrk1 mice were bred with CMV-Cre transgenic mice to generate germline deleted Lrrk1 mice. Detailed strategy for generating targeting vector and DNA sequence of floxed Lrrk1 allele can be found in Figure 1—figure supplement 1 and Supplementary file 1, respectively. (D) Southern analysis of the targeted and floxed Lrrk1 alleles. Genomic DNA from ES cells or mouse tails was digested with HindIII and hybridized with the 5' or 3' external probe. For the 5' probe, the resulting 17.0 kb and 4.8 kb bands represent the wild-type (WT) and the targeted (T) or floxed (F) alleles, respectively. For the 3' probe, the resulting 17.0 kb and 12.2 kb bands represent the WT and the floxed alleles, respectively. Detailed Southern strategy can be found in Figure 1—figure supplement 2. (E) Targeting strategy for the generation of the targeted, floxed, and deleted Lrrk2 alleles. The red boxes represent Lrrk2 exons 1 and 2, and the start codon ATG resides in exon 1. The locations and sizes of the 5' and 3' external probes are shown. The targeting vector contains the 5' and 3' homologous regions (marked by dashed lines) and the middle region (from the promoter to intron 2), which includes a loxP site (green arrowhead) upstream (1768 bp) of the transcription initiation site and the Pgk-neo selection cassette flanked by two FRT sequences (gray circles) and two loxP sites (green arrowheads) in intron 2 (878 bp downstream of exon 2). A negative selection cassette encoding DTA is also included in the targeting vector. Mice carrying the correctly targeted Lrrk2 allele were crossed with Actin-FLP deleter mice to generate floxed Lrrk2 mice, which were bred with CMV-Cre transgenic mice to generate germline deleted Lrrk2 mice. Detailed strategy for generating targeting vector and the DNA sequence of the floxed Lrrk2 allele can be found in Figure 1—figure supplement 3, respectively. (F) Southern analysis of the targeted and floxed Lrrk2 alleles. Genomic DNA from ES cells or mouse tails was digested with NheI and hybridized with the 5' or 3' external probe. For the 5' probe, the resulting 11.5 kb and 3.6 kb bands represent the wild-type (WT) and the targeted (T) or floxed (F) alleles, respectively. For the 3' probe, the resulting 11.5 kb and 5.2 kb bands represent the WT and the floxed Lrrk2 alleles, respectively. Detailed Southern strategy can be found in Figure 1—figure supplement 4. (G) Northern analysis of poly(A)+RNA prepared from the lung of Lrrk1Δ/Δ mice carrying homozygous germline deleted (Δ/Δ) Lrrk1 alleles derived from Lrrk1F/F mice using the cDNA probe of exons 2–3 (left) and exons 27–29 (right). Using the upstream exons 2–3 probe, the Lrrk1 transcripts in wild-type mice are the expected size of ~7.4 kb, whereas the detected Lrrk1 transcripts in Lrrk1Δ/Δ mice are truncated, consistent with the deletion of exons 27–29 (625 bp), which results in a frameshift, and are expressed at lower levels, likely due to nonsense-mediated degradation of the truncated Lrrk1 mRNA. Using a probe specific for exons 27–29, there is no Lrrk1 transcript in Lrrk1Δ/Δ mice, as expected. Both blots were hybridized with a GAPDH probe as loading controls. Detailed northern strategy and full-size blots are included in Figure 1—figure supplements 5 and 6, respectively. Extensive RT-PCR analysis of Lrrk1 transcripts in Lrrk1Δ/Δ mice is shown in Figure 1—figure supplement 7. (H) Northern analysis of total RNA prepared from the neocortex of Lrrk2Δ/Δ mice carrying homozygous germline Lrrk2 deleted (Δ/Δ) alleles using the cDNA probe of exons 1–5 shows the absence of Lrrk2 transcripts. The blot was hybridized with a GAPDH probe as a loading control. The full-size blot is included in Figure 1—figure supplement 8. RT-PCR analysis of Lrrk2 transcripts in Lrrk2Δ/Δ mice is shown in Figure 1—figure supplement 9. (I) Left: western analysis of wild-type (+/+) and homozygous Lrrk1Δ/Δ (Δ/Δ) brains shows the absence of LRRK1 protein. Right: western analysis of the neocortex of wild-type (+/+) and homozygous Lrrk2Δ/Δ (Δ/Δ) mice shows the absence of LRRK2 protein. Vinculin was used as a loading control. Full-size blots can be found in Figure 1—source data 1.
Figure 1—figure supplement 1.
Figure 1—figure supplement 1.. Genomic DNA sequence of the floxed Lrrk1 allele.
Figure 1—figure supplement 2.
Figure 1—figure supplement 2.. Southern strategy for the targeted and floxed Lrrk1 alleles.
Figure 1—figure supplement 3.
Figure 1—figure supplement 3.. Genomic DNA sequence of the floxed Lrrk2 allele.
Figure 1—figure supplement 4.
Figure 1—figure supplement 4.. Southern analysis of the targeted and floxed Lrrk2 alleles.
Figure 1—figure supplement 5.
Figure 1—figure supplement 5.. Northern strategy for Lrrk1 mRNA.
Figure 1—figure supplement 6.
Figure 1—figure supplement 6.. Northern analysis of Lrrk1 mRNA in Lrrk1Δ/Δ mice.
Figure 1—figure supplement 7.
Figure 1—figure supplement 7.. RT-PCR analysis of the deleted Lrrk1 allele.
Figure 1—figure supplement 8.
Figure 1—figure supplement 8.. Northern analysis of Lrrk2 mRNA in Lrrk2F/F and Lrrk2Δ/Δ mice.
Figure 1—figure supplement 9.
Figure 1—figure supplement 9.. RT-PCR analysis of the deleted Lrrk2 allele.
Figure 2.
Figure 2.. Generation and characterization of dopaminergic (DA) neuron-specific Lrrk conditional double knockout (cDKO) mice.
(A) Immunostaining of GFP and/or TH in the SNpc of Slc6a3Cre/+; Rosa26CAG-LSL-ZsGreen1/+ mice at 2 months of age. Cre recombinase is expressed under the control of the Slc6a3 endogenous promoter and removes the floxed ‘stop’ cassette, resulting in the expression of EGFP under the control of the ubiquitous CAG promoter. (B) Quantification of GFP+/TH+ and TH+ cells shows that 99% of TH+ DA neurons (722 ± 46 TH+ cells) in the SNpc are also GFP+ (713 ± 46 cells), indicating that Slc6a3-Cre mediated recombination occurs in essentially all TH+ DA neurons. N = 3 mice, three comparable sections per hemisphere, 320 μm apart. (C) Similar body weight between Lrrk cDKO mice and littermate controls at all ages examined (F1,68 = 0.001310, p=0.9712; 2M, 20M: p>0.9999; 15M: p=0.7857, 25M: p=0.8084, two-way ANOVA with Bonferroni’s post hoc multiple comparisons). (D) Similar brain weight between Lrrk cDKO and control mice (F1,68 = 3.603, p=0.0619; 2M: p=0.3893; 15M: p>0.9999; 20M: p>0.9999; 25M: p=0.3223, two-way ANOVA with Bonferroni’s post hoc multiple comparisons). (E) Western analysis of LRRK1 and LRRK2 proteins in the dissected cerebral cortex (CTX) and ventral midbrain (vMB) of Lrrk cDKO and littermate controls at 2 months of age. (F) Quantification shows significant decreases in LRRK1 and LRRK2 in the dissected ventral midbrain of Lrrk cDKO mice (LRRK1, p=0.0432; LRRK2, p=0.0162, Student’s t-test), compared to controls, but not in the dissected cortex of cDKO mice (LRRK1: p=0.7648; LRRK2: p=0.2325). The number in the column indicates the number of mice used in the study. Red-filled and open circles represent data obtained from individual male and female mice, respectively. All data are expressed as mean ± SEM. *p<0.05. Scale bar: 100 μm.
Figure 3.
Figure 3.. Age-dependent loss of dopaminergic (DA) neurons in the substantia nigra pars compacta (SNpc) of Lrrk conditional double knockout (cDKO) mice.
(A) TH immunostaining shows TH+ DA neurons in the SNpc of Lrrk cDKO and littermate controls at the age of 15, 20, and 24 months. Higher power views of the boxed areas show grossly normal DA neuron morphology in Lrrk cDKO mice. (B) Quantification of TH+ DA neurons in the SNpc reveals similar numbers of DA neurons in Lrrk cDKO mice (10,000 ± 141) and littermate controls (10,077 ± 310, p>0.9999) at 15 months of age. At 20 months of age, the number of DA neurons in the SNpc of Lrrk cDKO mice (8948 ± 273) is significantly reduced compared to control mice (10,244 ± 220, F1,46 = 16.59, p=0.0002; p=0.0041, two-way ANOVA with Bonferroni’s post hoc multiple comparisons). By 24 months of age, the reduction of DA neurons in the SNpc of Lrrk cDKO mice (8188 ± 452) relative to controls (9675 ± 232, p=0.0010) is greater compared to 20 months of age. Raw quantification data are included in Figure 3—source data 1. (C) Immunohistological analysis of TH and NeuN shows TH+ DA neurons (green) and NeuN+ neurons (red) in the SNpc of Lrrk cDKO mice and controls at 24 months of age. (D) Quantification of NeuN+ cells in the SNpc shows that the number of NeuN+ neurons in Lrrk cDKO mice (17,923 ± 813) is significantly lower than that in control mice (21,907 ± 469, p=0.0006, Student’s t-test), indicating loss of neurons in the SNpc of Lrrk cDKO mice. All TH+ cells are NeuN+. The number of TH+/NeuN+ cells in the SNpc of Lrrk cDKO mice (10,500 ± 644) is also lower compared to control mice (14,102 ± 310, p=0.0001). There is no significant difference in the number of NeuN+/TH- neurons between littermate controls (7804 ± 249) and cDKO mice (7423 ± 344, p=0.3747). The number in the column indicates the number of mice used in the study. Red-filled and open circles represent data obtained from individual male and female mice, respectively. All data are expressed as mean ± SEM. **p<0.01, ***p<0.001. Scale bar: 100 μm.
Figure 3—figure supplement 1.
Figure 3—figure supplement 1.. Independent validation of age-dependent reduction of dopaminergic (DA) neurons in the substantia nigra pars compacta (SNpc) of Lrrk conditional double knockout (cDKO) mice.
(A) Quantification of TH+ DA neurons in the SNpc by an independent investigator using stereological methods sampling 25% areas of the SNpc. There are similar numbers of DA neurons in Lrrk cDKO mice (13,180 ± 585) and littermate controls (13,293 ± 500, p>0.9999) at 15 months of age. At 20 months of age, the number of DA neurons in the SNpc of Lrrk cDKO mice (10,936 ± 477) is significantly reduced compared to control mice (12,576 ± 497, F1,47=12.40, p=0.0003; p=0.0423, two-way ANOVA with Bonferroni’s post hoc multiple comparisons). By 24 months of age, the reduction of DA neurons in the SNpc of Lrrk cDKO mice (8600 ± 355) is more severe compared to controls (11,105 ± 435, p=0.0015). The number in the column indicates the number of mice used in the study. Red-filled and open circles represent data obtained from individual male and female mice, respectively. All data are expressed as mean ± SEM. *p<0.05, **p<0.01.
Figure 4.
Figure 4.. Increases in apoptotic dopaminergic (DA) neurons in the substantia nigra pars compacta (SNpc) of Lrrk conditional double knockout (cDKO) mice.
(A) Representative images of TH and active Caspase-3 immunostaining show TH+ DA neurons (green) and active Caspase-3+ apoptotic cells (red) in the SNpc of Lrrk cDKO and control mice at the age of 24 months. (B) Quantification of active Caspase-3+/TH+ cells shows significant increases in apoptotic DA neurons in the SNpc of Lrrk cDKO mice (323 ± 38) at 24 months of age, relative to controls (157 ± 8, p=0.0004, Student’s t-test). Raw quantification data are included in Figure 4—source data 1. The number in the column indicates the number of mice used in the study. Red-filled and open circles represent data obtained from individual male and female mice, respectively. All data are expressed as mean ± SEM. ***p<0.001. Scale bar: 100 μm.
Figure 5.
Figure 5.. Age-dependent loss of TH+ dopaminergic (DA) terminals in the striatum of Lrrk conditional double knockout (cDKO) mice.
(A) Representative TH immunostaining images in the striatum of Lrrk cDKO mice and littermate controls at the ages of 15 and 24 months. (B) Quantification of TH immunoreactivity in the striatum of Lrrk cDKO and control mice shows similar TH immunoreactivity at the age of 15 months (p=0.8766, Student’s t-test), but there is a significant decrease in TH immunoreactivity in the striatum of Lrrk cDKO mice at 24 months of age (–19%, p=0.0215) compared to controls. The number in the column indicates the number of mice used in the study. Red-filled and open circles represent data obtained from individual male and female mice, respectively. All data are expressed as mean ± SEM. *p<0.05. Scale bar: 1 mm.
Figure 6.
Figure 6.. Normal number of TH+ noradrenergic neurons in the locus coeruleus (LC) of Lrrk conditional double knockout (cDKO) mice.
(A) Representative images of TH+ noradrenergic neurons in the LC of Lrrk cDKO mice and littermate controls at 24 months of age. (B) Quantification of TH+ cells shows similar number of TH+ noradrenergic neurons in the LC of Lrrk cDKO mice (3350 ± 99) and controls (3418 ± 86, p=0.6110, Student’s t-test). (C) Top: immunostaining of TH and GFP in the LC of Slc6a3Cre/+; Rosa26CAG-LSL-ZsGreen1/+ mice at 2 months of age. There is no GFP+ (green) cell in the LC, indicating that Slc6a3-Cre is not expressed in the LC. Bottom: higher power views of the boxed areas. The number in the column indicates the number of mice used in the study. Red-filled and open circles represent data obtained from individual male and female mice, respectively. All data are expressed as mean ± SEM. Scale bar: 100 μm.
Figure 7.
Figure 7.. Unchanged number of electron-dense vacuoles in the substantia nigra pars compacta (SNpc) of Lrrk conditional double knockout (cDKO) mice.
(A, B) Representative electron microscopy (EM) images showing electron-dense vacuoles (arrowheads) in SNpc neurons of cDKO mice and littermate controls at the age of 25 months. (C–F) Higher power views showing various electron-dense vacuoles, autolysosomes (single arrows), autophagosomes (double arrows), and lipid-containing vacuoles (asterisks) in SNpc neurons of littermate control (C, D) and cDKO (E, F) mice. (G) Left: the average number of electron-dense vacuoles (>0.5 μm in diameter) in the SNpc neuronal profiles per mouse is not significantly different between Lrrk cDKO mice and littermate controls at the age of 25 months (control: 6.72 ± 0.43; cDKO: 6.99 ± 0.52, p=0.6839, Student’s t-test). Right: the total area of electron-dense vacuoles (>0.5 μm in diameter) in the SNpc neuronal profiles per mouse is similar between Lrrk cDKO and littermate controls (control: 4.43 ± 0.44 μm2; cDKO: 4.60 ± 0.49 μm2, p=0.8048). The value in parentheses indicates the number of mice (left) and neuron profiles (right) used in the quantification. Red-filled and open circles represent data obtained from individual male and female mice, respectively. All data are expressed as mean ± SEM. Scale bar: 1 μm.
Figure 8.
Figure 8.. Elevated microgliosis in the substantia nigra pars compacta (SNpc) of Lrrk conditional double knockout (cDKO) mice.
(A–C) Representative images of Iba1+ microglia (red, marked by yellow arrowheads) and TH+ dopaminergic neurons (green) in the SNpc of Lrrk DKO mice and controls at 15 (A), 20 (B), and 24 (C) months of age. (D) Quantification of Iba1+ microglia shows significant increases in the number of Iba1+ microglia in the SNpc of Lrrk cDKO mice compared to control mice at the ages of 15 months (control: 1737 ± 83, cDKO: 2541 ± 193; F1,45 = 102.6, p<0.0001, p=0.0017, two-way ANOVA with Bonferroni’s post hoc multiple comparisons), 20 months (control: 2426 ± 68, cDKO: 3639 ± 127, p<0.0001), and 24 months (control: 2640 ± 187, cDKO: 4089 ± 100, p<0.0001). Raw quantification data are included in Figure 8—source data 1. The number in the column indicates the number of mice used in the study. Red-filled and open circles represent data obtained from individual male and female mice, respectively. All data are expressed as mean ± SEM. **p<0.01, ****p<0.0001. Scale bar: 100 μm.
Figure 9.
Figure 9.. Impairment of motor coordination in Lrrk conditional double knockout (cDKO) mice.
(A) In the 10 mm beam walk test, compared to control mice, Lrrk cDKO mice at 10 months of age exhibit markedly more hindlimb slips (control: 2.0 ± 0.3; cDKO: 4.4 ± 0.5; p=0.0005, Student’s t-test) and longer traversal time (control: 5.8 ± 0.4; cDKO: 7.3 ± 0.3; p=0.0075). In the less challenging 20 mm beam walk test, there is no significant difference in the number of hindlimb slips (control: 1.0 ± 0.2; cDKO: 1.5 ± 0.2; p=0.0733) and traversal time (control: 5.1 ± 0.4; cDKO: 5.2 ± 0.3; p=0.9796) between Lrrk cDKO and control mice. (B) In the pole test, Lrrk cDKO and control mice at 10 months of age display similar turning time (control: 1.2 ± 0.1; cDKO: 1.5 ± 0.1; p=0.1219) and descending time (control: 4.7 ± 0.1; cDKO: 4.7 ± 0.2; p=0.8620). (C) Lrrk cDKO (31.1 ± 1.3) and control (32.0 ± 1.5; p=0.6410) mice at 10 months of age show similar body weight. (D) Lrrk cDKO mice and control mice at 22 months of age in the 10 mm beam walk test show similar hindlimb slips (control: 12.0 ± 3.0; cDKO: 13.8 ± 3.3; p=0.7022) and traversal time (control: 15.3 ± 2.0; cDKO: 16.2 ± 2.8; p=0.8139). In the 20 mm team walk test, there is also no difference in hindlimb slips (control: 4.8 ± 1.6; cDKO: 4.1 ± 1.0; p=0.7142) and traversal time (control: 8.7 ± 1.6; cDKO: 6.4 ± 0.7; p=0.2223) between Lrrk cDKO and control mice. (E) In the pole test, Lrrk cDKO mice at 22 months of age exhibit similar turning time (control: 1.7 ± 0.2; cDKO: 2.8 ± 0.7; p=0.1184) and descending time (control: 6.6 ± 0.7; cDKO: 5.4 ± 0.3; p=0.1413) compared to control mice. (F) Lrrk cDKO mice (34.8 ± 1.5) have similar body weight as control mice (39.6 ± 2.4; p=0.1194). The number in parentheses indicates the number of mice used in the study. Red-filled and open circles represent data obtained from individual male and female mice, respectively. All data are expressed as mean ± SEM. **p<0.01, ***p<0.001. Raw behavior data are included in Figure 9—source data 1.

Update of

Similar articles

Cited by

References

    1. An X-K, Peng R, Li T, Burgunder J-M, Wu Y, Chen W-J, Zhang J-H, Wang Y-C, Xu Y-M, Gou Y-R, Yuan G-G, Zhang Z-J. LRRK2 Gly2385Arg variant is a risk factor of Parkinson’s disease among Han-Chinese from mainland China. European Journal of Neurology. 2008;15:301–305. doi: 10.1111/j.1468-1331.2007.02052.x. - DOI - PubMed
    1. Bäckman CM, Malik N, Zhang Y, Shan L, Grinberg A, Hoffer BJ, Westphal H, Tomac AC. Characterization of a mouse strain expressing Cre recombinase from the 3’ untranslated region of the dopamine transporter locus. Genesis. 2006;44:383–390. doi: 10.1002/dvg.20228. - DOI - PubMed
    1. Biskup S, Moore DJ, Rea A, Lorenz-Deperieux B, Coombes CE, Dawson VL, Dawson TM, West AB. Dynamic and redundant regulation of LRRK2 and LRRK1 expression. BMC Neuroscience. 2007;8:102. doi: 10.1186/1471-2202-8-102. - DOI - PMC - PubMed
    1. Blauwendraat C, Reed X, Kia DA, Gan-Or Z, Lesage S, Pihlstrøm L, Guerreiro R, Gibbs JR, Sabir M, Ahmed S, Ding J, Alcalay RN, Hassin-Baer S, Pittman AM, Brooks J, Edsall C, Hernandez DG, Chung SJ, Goldwurm S, Toft M, Schulte C, Bras J, Wood NW, Brice A, Morris HR, Scholz SW, Nalls MA, Singleton AB, Cookson MR, COURAGE-PD (Comprehensive Unbiased Risk Factor Assessment for Genetics and Environment in Parkinson’s Disease) Consortium, the French Parkinson’s Disease Consortium, and the International Parkinson’s Disease Genomics Consortium (IPDGC) Frequency of loss of function variants in LRRK2 in Parkinson disease. JAMA Neurology. 2018;75:1416–1422. doi: 10.1001/jamaneurol.2018.1885. - DOI - PMC - PubMed
    1. Bosgraaf L, Van Haastert PJM. Roc, a Ras/GTPase domain in complex proteins. Biochimica et Biophysica Acta. 2003;1643:5–10. doi: 10.1016/j.bbamcr.2003.08.008. - DOI - PubMed

MeSH terms

Substances