. 2024 Jun 10;114(3):71.
doi: 10.1007/s11103-024-01452-x.

Characterization of organelle DNA degradation mediated by DPD1 exonuclease in the rice genome-edited line

Affiliations

Characterization of organelle DNA degradation mediated by DPD1 exonuclease in the rice genome-edited line

Md Faridul Islam et al. Plant Mol Biol. .

Abstract

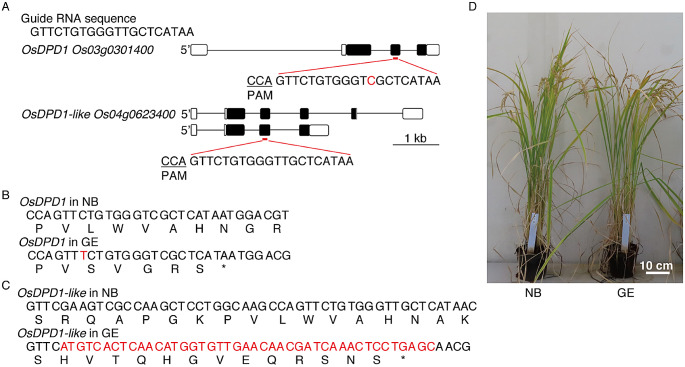
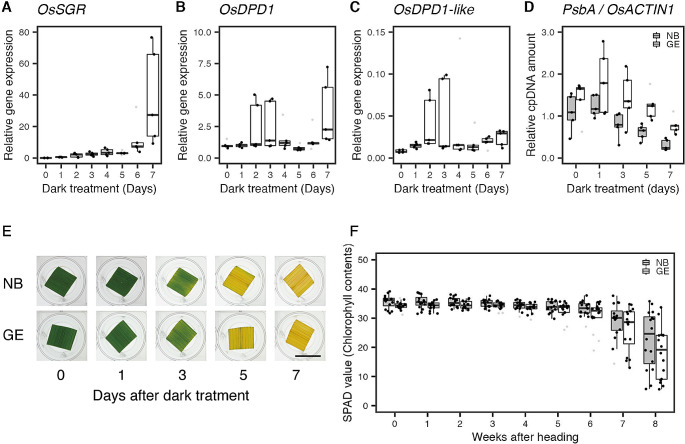
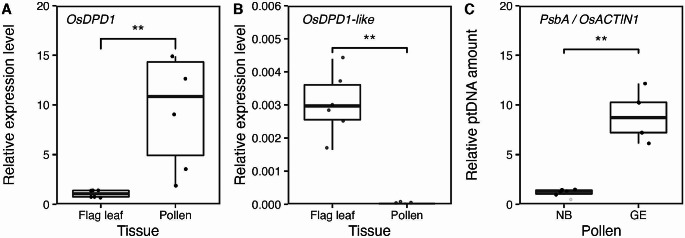
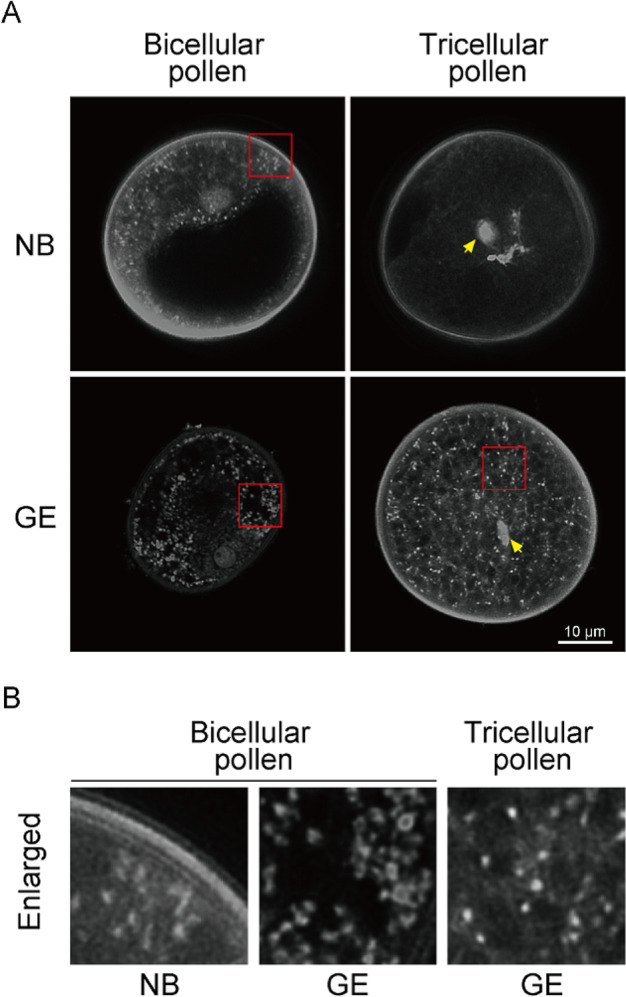
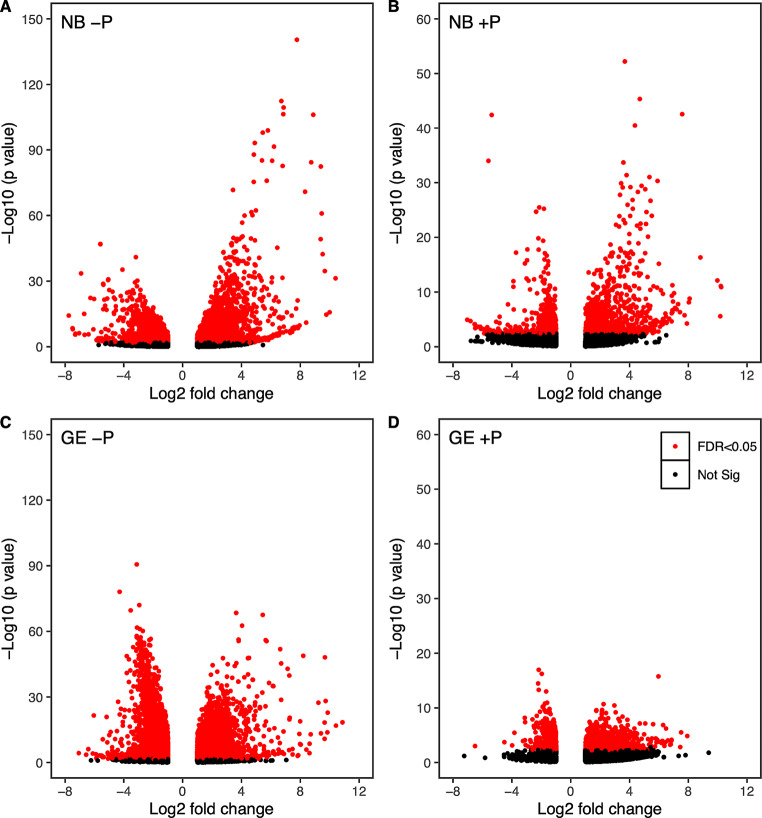
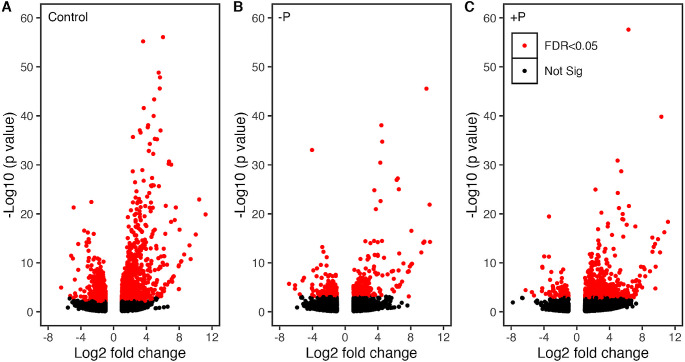
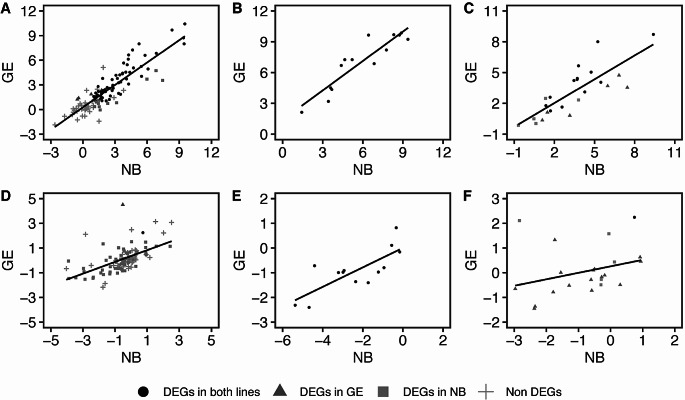
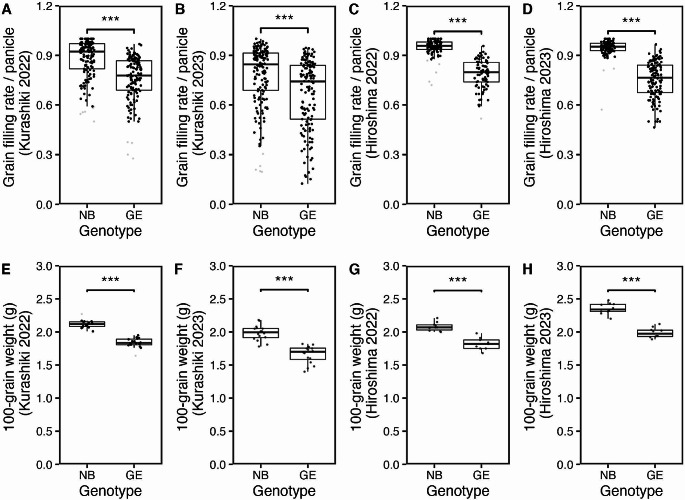
Mitochondria and plastids, originated as ancestral endosymbiotic bacteria, contain their own DNA sequences. These organelle DNAs (orgDNAs) are, despite the limited genetic information they contain, an indispensable part of the genetic systems but exist as multiple copies, making up a substantial amount of total cellular DNA. Given this abundance, orgDNA is known to undergo tissue-specific degradation in plants. Previous studies have shown that the exonuclease DPD1, conserved among seed plants, degrades orgDNAs during pollen maturation and leaf senescence in Arabidopsis. However, tissue-specific orgDNA degradation was shown to differ among species. To extend our knowledge, we characterized DPD1 in rice in this study. We created a genome-edited (GE) mutant in which OsDPD1 and OsDPD1-like were inactivated. Characterization of this GE plant demonstrated that DPD1 was involved in pollen orgDNA degradation, whereas it had no significant effect on orgDNA degradation during leaf senescence. Comparison of transcriptomes from wild-type and GE plants with different phosphate supply levels indicated that orgDNA had little impact on the phosphate starvation response, but instead had a global impact in plant growth. In fact, the GE plant showed lower fitness with reduced grain filling rate and grain weight in natural light conditions. Taken together, the presented data reinforce the important physiological roles of orgDNA degradation mediated by DPD1.

Keywords: Exonuclease; Leaf senescence; Mitochondria; Organelle DNA degradation; Plastids; Pollen; Rice (Oryza sativa).


Conflict of interest statement

The authors have no conflicts of interest to declare.

Figures

Fig. 1
Fig. 1
Schematic diagram showing the gene models of OsDPD1and OsDPD1-like and the GE line generated in this study. (A) Gene models of OsDPD1 and OsDPD1-like are shown. Closed boxes indicate coding regions, and open boxes indicate untranslated regions. The target of the 20-bp gRNA sequence employed in this study is highlighted in red, and the zoomed-in view shows the corresponding sequences (note there is one-base mismatch in OsDPD1). (B) Nucleotide arrangement around the target sequence of OsDPD1. One T insertion in GE is indicated by red, and the resulting amino-acid change is shown below the nucleotide. (C) Nucleotide arrangement around the target sequence of OsDPD1-like. Rearrangements in GE are indicated in red, and the resulting amino-acid change is shown below the nucleotides. (D) Photographs of NB and GE plants grown in a greenhouse
Fig. 2
Fig. 2
Gene expression and cpDNA amounts during dark-induced senescence, and chlorophyll content in natural senescence. Transcript levels of OsSGR (A), OsDPD1 (B), and OsDPD1-like (C) in NB senescing flag leaves, estimated by qRT-PCR.OsACTIN was used as an internal control in these analyses (n = 5). (D) Relative amounts of cpDNAs in NB and GE senescing flag leaves, measured by qPCR (gray and white boxplots represent NB and GE, respectively, n = 5). (E) A representative image of leaves from NB (top) and GE (bottom), subjected to dark-induced leaf senescence as indicated. Scale bar = 1 cm. (F) Measurement of chlorophyll content in natural flag-leaf senescence during summer (gray and white boxplots represent NB and GE, respectively, n = 16). The trend in relative gene expression level was analyzed using the Jonckheere-Terpstra test with a PMCMRplus/R package. The trend in OsSGR gene expression showed a significant increase (p = 2.91e-10). The trend in OsDPD1 gene expression showed a significant increase (p = 0.0223). The trend in OsDPD1-like gene expression showed a significant increase (p = 0.00756). The trend in relative cpDNA amount in NB showed a significant decrease (p = 1.96e-5). The trend in relative cpDNA amounts in GE showed a significant decrease (p = 9.98e-4). The trend in chlorophyll content in NB showed a significant decrease (p = 9.55e-14). The trend in chlorophyll content in GE showed a significant decrease (p = 1.25e-13). For boxplots, the lower and upper whiskers indicate minimum and maximum values, respectively. The bottom, center, and top lines of the box indicate the lower quartile, median, and upper quartile, respectively
Fig. 3
Fig. 3
Gene expression and cpDNA amounts in pollen. (A) Comparison of OsDPD1transcript levels between flag leaves and pollen grains (n = 6). (B) Comparison of OsDPD1-like transcript levels between flag leaves and pollen grains (n = 6). OsACTIN1 was used as an internal control in these analyses. (C) Relative amounts of cpDNAs in NB and GE pollen grains (n = 6), measured by qPCR. Statistical analysis of data was performed using the Wilcoxon-Mann-Whitney test with the ggsignif/R package, with significance levels at p < 0.01(**), and p < 0.001(***). For boxplots, the lower and upper whiskers indicate the minimum and maximum values, respectively. The bottom, center, and top lines of the box indicate the lower quartile, median, and upper quartile, respectively
Fig. 4
Fig. 4
Confocal-microscopic observations of bicellular and tricellular pollen grains from NB and GE. (A) Representative images of bicellular (left) and tricellular (right) pollen grains from NB (top) and GE (bottom) stained with SYBR-Green and detected using confocal laser scanning microscopy. Note that small dot-like signals corresponding to orgDNAs were detected in bicellular pollen from both NB and GE, whereas these signals in tricellular pollen were detected only in GE. Yellow arrows show the signals corresponding to vegetative nuclei. Observation of pollen grains in NB and GE plants was performed with at least three biological replicates and the representative images is shown. (B) Closeup view of bicellular (left, middle) and tricellular (right) pollen, enlarged from the areas indicated red in (A)
Fig. 5
Fig. 5
Volcano plot analysis of transcriptome responding to -P and + P (comparison of transcriptome between normal and phosphate-altered conditions in NB and GE). (A) Volcano plots showing significantly differentially expressed genes in NB in -P conditions. (B) Volcano plots showing significantly differentially expressed genes in NB in + P conditions. (C) Volcano plots showing significantly differentially expressed genes in GE in P conditions. (D) Volcano plots showing significantly differentially expressed genes in GE in + P conditions. Volcano plots were constructed using the ggplot2/R package with the data set of all DEGs. Each data point represents a single gene. Threshold levels for DEGs were log2-fold change > 1 and adjusted p-value < 0.05
Fig. 6
Fig. 6
Comparison of transcriptomes between NB and GE from leaf tissues grown in normal, -P, and + P condition. (A) Volcano plot showing differentially expressed genes between NB and GE in normal (1/10MS medium) conditions. (B) Volcano plot showing differentially expressed genes between NB and GE in -P conditions. (C) Volcano plot showing differentially expressed genes between NB and GE in + P conditions. Volcano plots were constructed using the ggplot2/R package with the data set of all DEGs. Each data point represents a single gene. Threshold levels for DEGs were log2-fold change > 1 and adjusted p-value < 0.05
Fig. 7
Fig. 7
Scatter plot analysis of gene expression between NB and GE in three gene sets known to respond to phosphate starvation. (A) Scatter plot of the genes in the PSR gene set in -P conditions. (B) Scatter plot of the genes in the P-indicator gene set in -P conditions. (C) Scatter plot of the genes in the P1BS gene set in -P conditions. (D) Scatter plot of the genes in the PSR gene set in + P conditions. (E) Scatter plot of the genes in the P-indicator gene set in + P conditions. (F) Scatter plot of the genes in the P1BS gene set in + P conditions. We used different symbols for DEGs in this analysis. Filled circle, filled triangle, filled square and plus show DEGs in both lines, DEGs in GE, DEGs in NB and non DEGs, respectively. Each data point represents a single gene
Fig. 8
Fig. 8
Grain filling rate and 100-grain weight of NB and GE plants grown in greenhouse conditions. Grain filling rate per panicle, measured by NB and GE plants grown in a greenhouse at Kurashiki (n = 141 and 147 panicles from 16 NB and 16 GE plants, respectively) in 2022 (A) and (n = 152 and 150 panicles from 16 NB and 16 GE plants, respectively) 2023 (B), or at Hiroshima(n = 90 and 82 panicles from 10 NB and 10 GE plants, respectively) in 2022 (C) and (n = 103 and 126 panicles from 10 NB and 10 GE plants, respectively)2023 (D) are shown. The weight of 100 grains, measured from NB and GE plants grown in a greenhouse at Kurashiki (n = 16 plants) in 2022 (E) and 2023 (F), and at Hiroshima (n = 10 plants) in 2022 (G) and 2023 (H) are shown. For boxplots, the lower and upper whiskers indicate the minimum and maximum values, respectively. The bottom, center, and top lines of the box indicate the lower quartile, median, and upper quartile, respectively. Statistical analysis of the data was performed using the Wilcoxon–Mann-–Whitney test with the ggsignif/R package, with significance at p < 0.001(***)

Similar articles

Cited by

References

    1. Azhagiri AK, Maliga P. Exceptional paternal inheritance of plastids in Arabidopsis suggests that low-frequency leakage of plastids via pollen may be universal in plants. Plant J. 2007;52(5):817–823. doi: 10.1111/j.1365-313X.2007.03278.x. - DOI - PubMed
    1. Chung KP, Gonzalez-Duran E, Ruf S, Endries P, Bock R. Control of plastid inheritance by environmental and genetic factors. Nat Plants. 2023;9(1):68–80. doi: 10.1038/s41477-022-01323-7. - DOI - PMC - PubMed
    1. Corriveau JL, Coleman AW. Rapid screening method to detect potential biparental inheritance of plastid DNA and results fo over 200 angiosperm species. Am J Bot. 1988;75:1443–1458. doi: 10.1002/j.1537-2197.1988.tb11219.x. - DOI
    1. Dean C, Leech RM, PROTEIN LEVELS IN TISSUES OF DIFFERENT AGES WITHIN A SEVEN-DAY-OLD WHEAT LEAF Genome expression during normal Leaf Development: I. CELLULAR AND CHLOROPLAST NUMBERS AND DNA, RNA, AND. Plant Physiol. 1982;69(4):904–910. doi: 10.1104/pp.69.4.904. - DOI - PMC - PubMed
    1. Dyall SD, Brown MT, Johnson PJ. Ancient invasions: from endosymbionts to Organelles. Sci New Ser. 2004;304(5668):253–257. - PubMed

LinkOut - more resources