

Cancer Incidence Trends in Successive Social Generations in the US
- PMID: 38857048
- PMCID: PMC11165384
- DOI: 10.1001/jamanetworkopen.2024.15731
Cancer Incidence Trends in Successive Social Generations in the US
Abstract
Importance: The incidence of some cancers in the US is increasing in younger age groups, but underlying trends in cancer patterns by birth year remain unclear.
Objective: To estimate cancer incidence trends in successive social generations.
Design, setting, and participants: In this cohort study, incident invasive cancers were ascertained from the Surveillance, Epidemiology, and End Results (SEER) program's 13-registry database (November 2020 submission, accessed August 14, 2023). Invasive cancers diagnosed at ages 35 to 84 years during 1992 to 2018 within 152 strata were defined by cancer site, sex, and race and ethnicity.
Exposure: Invasive cancer.
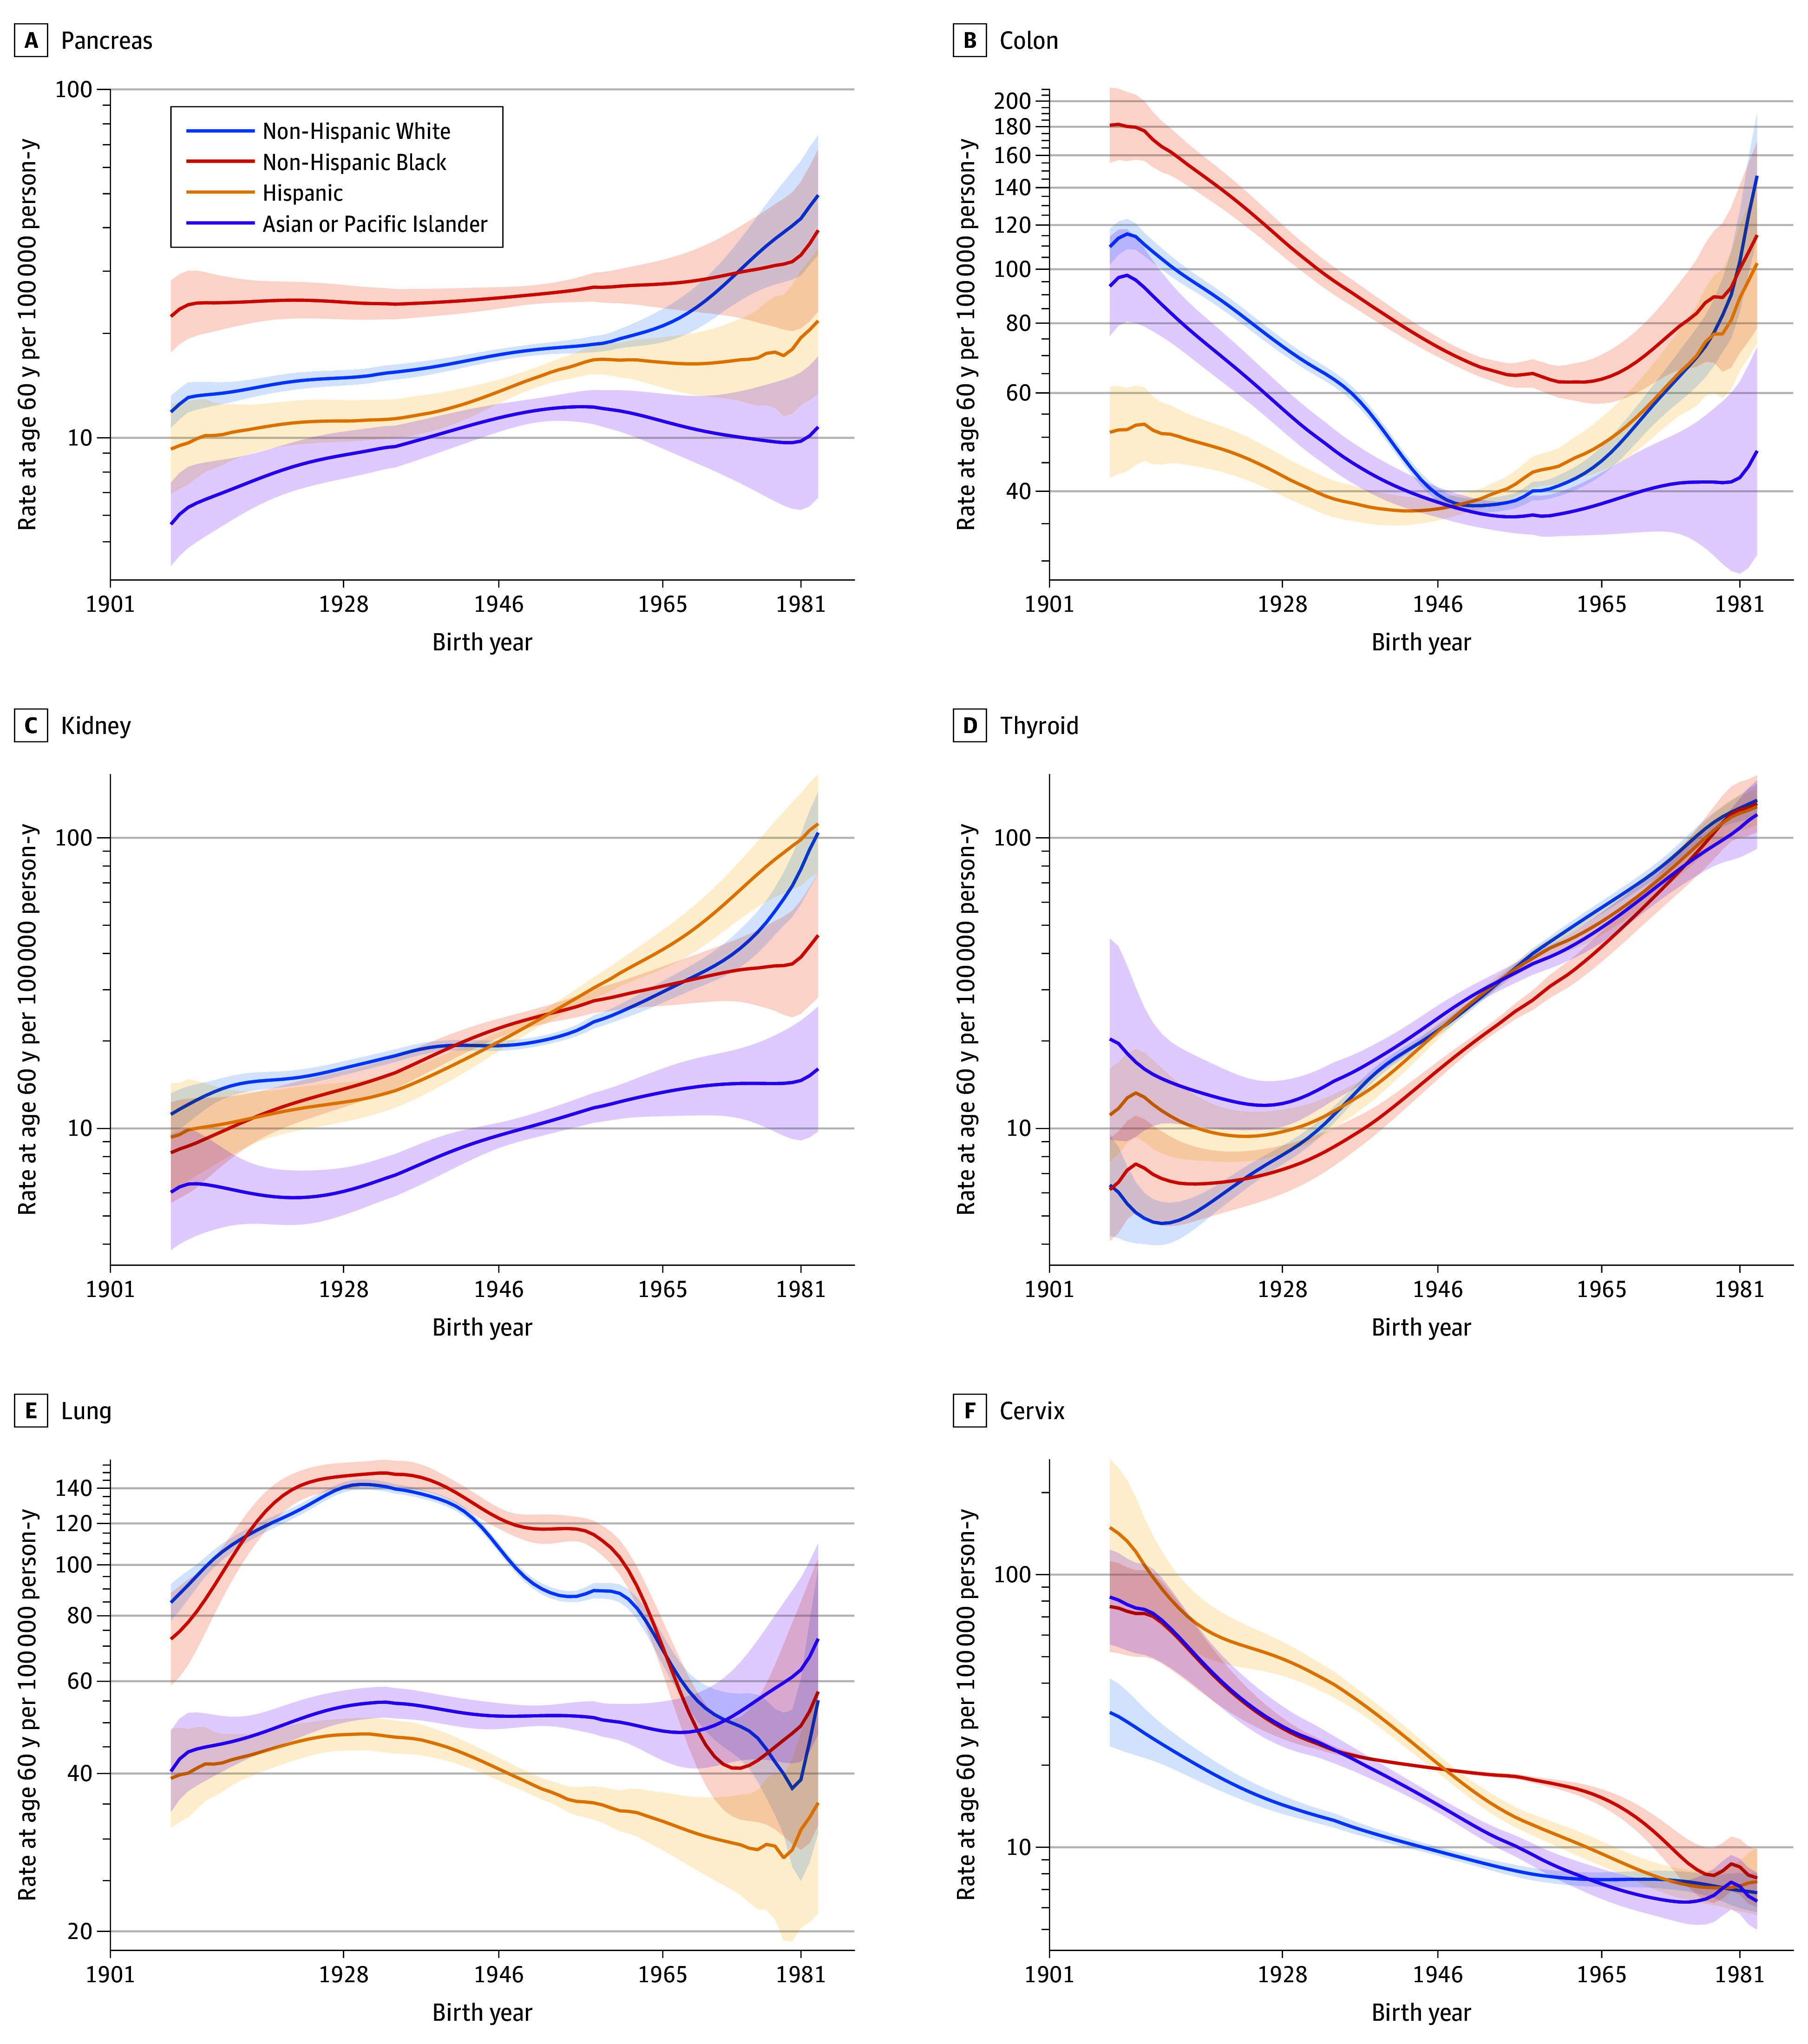
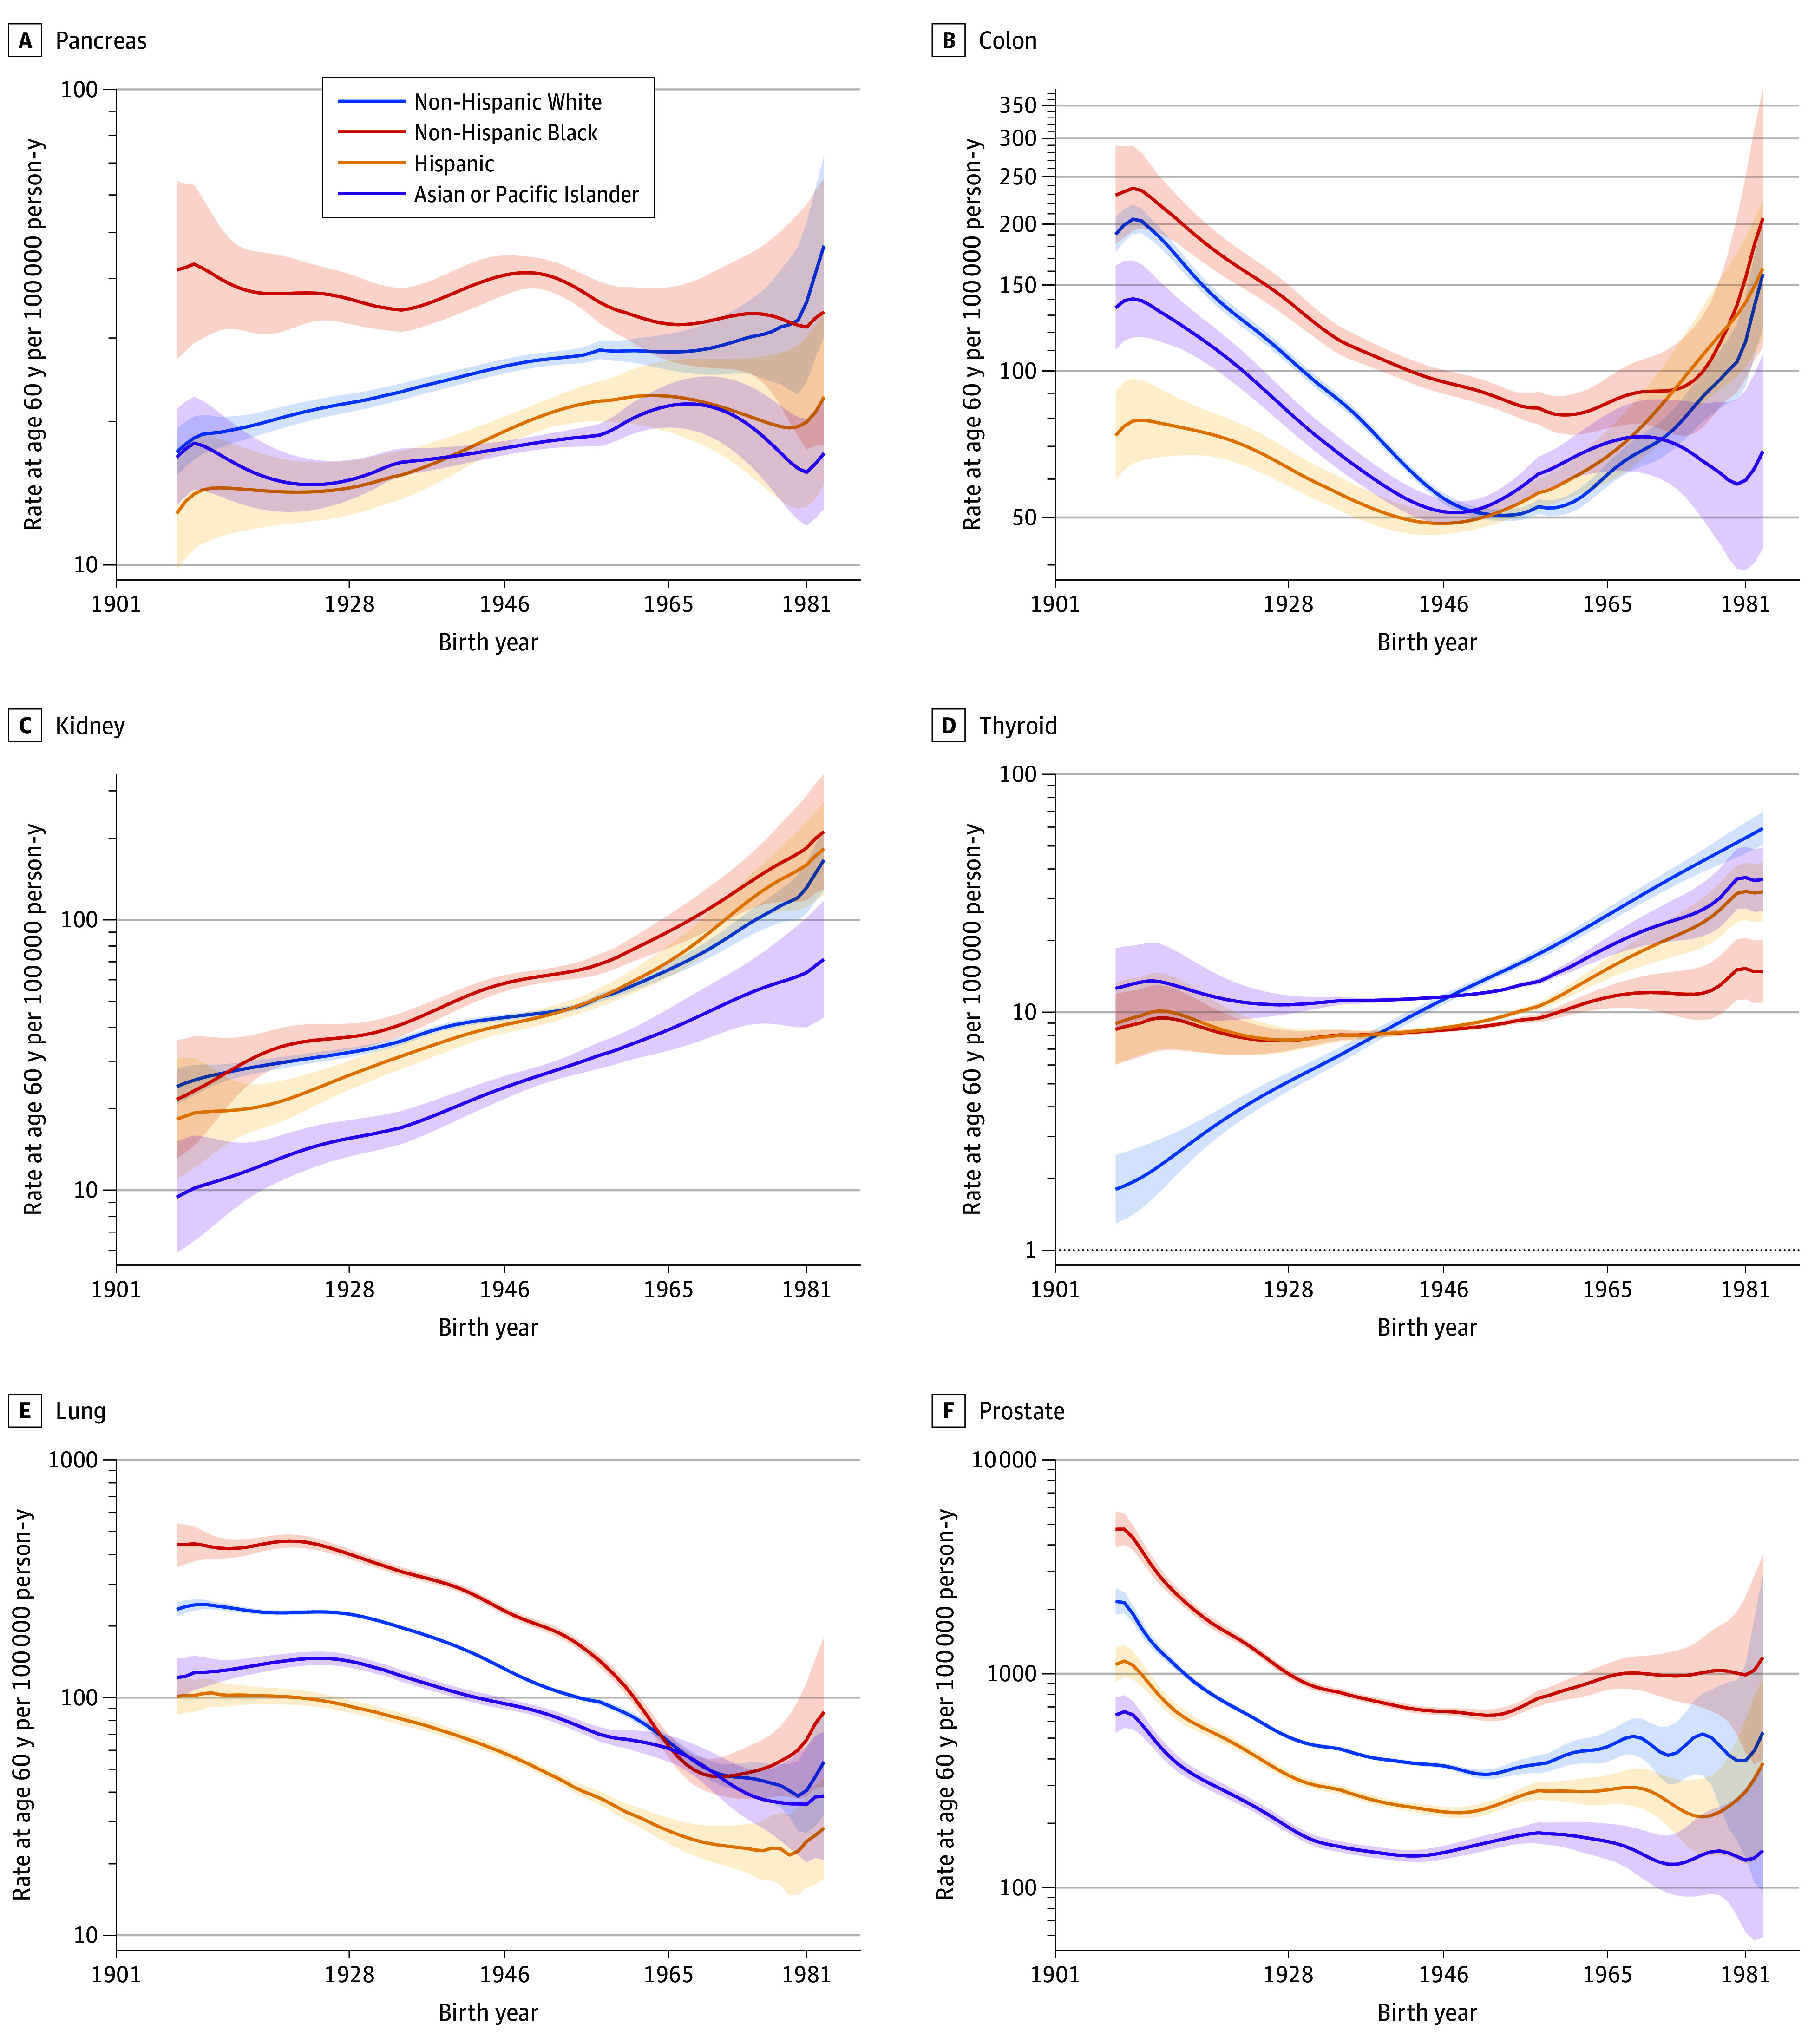
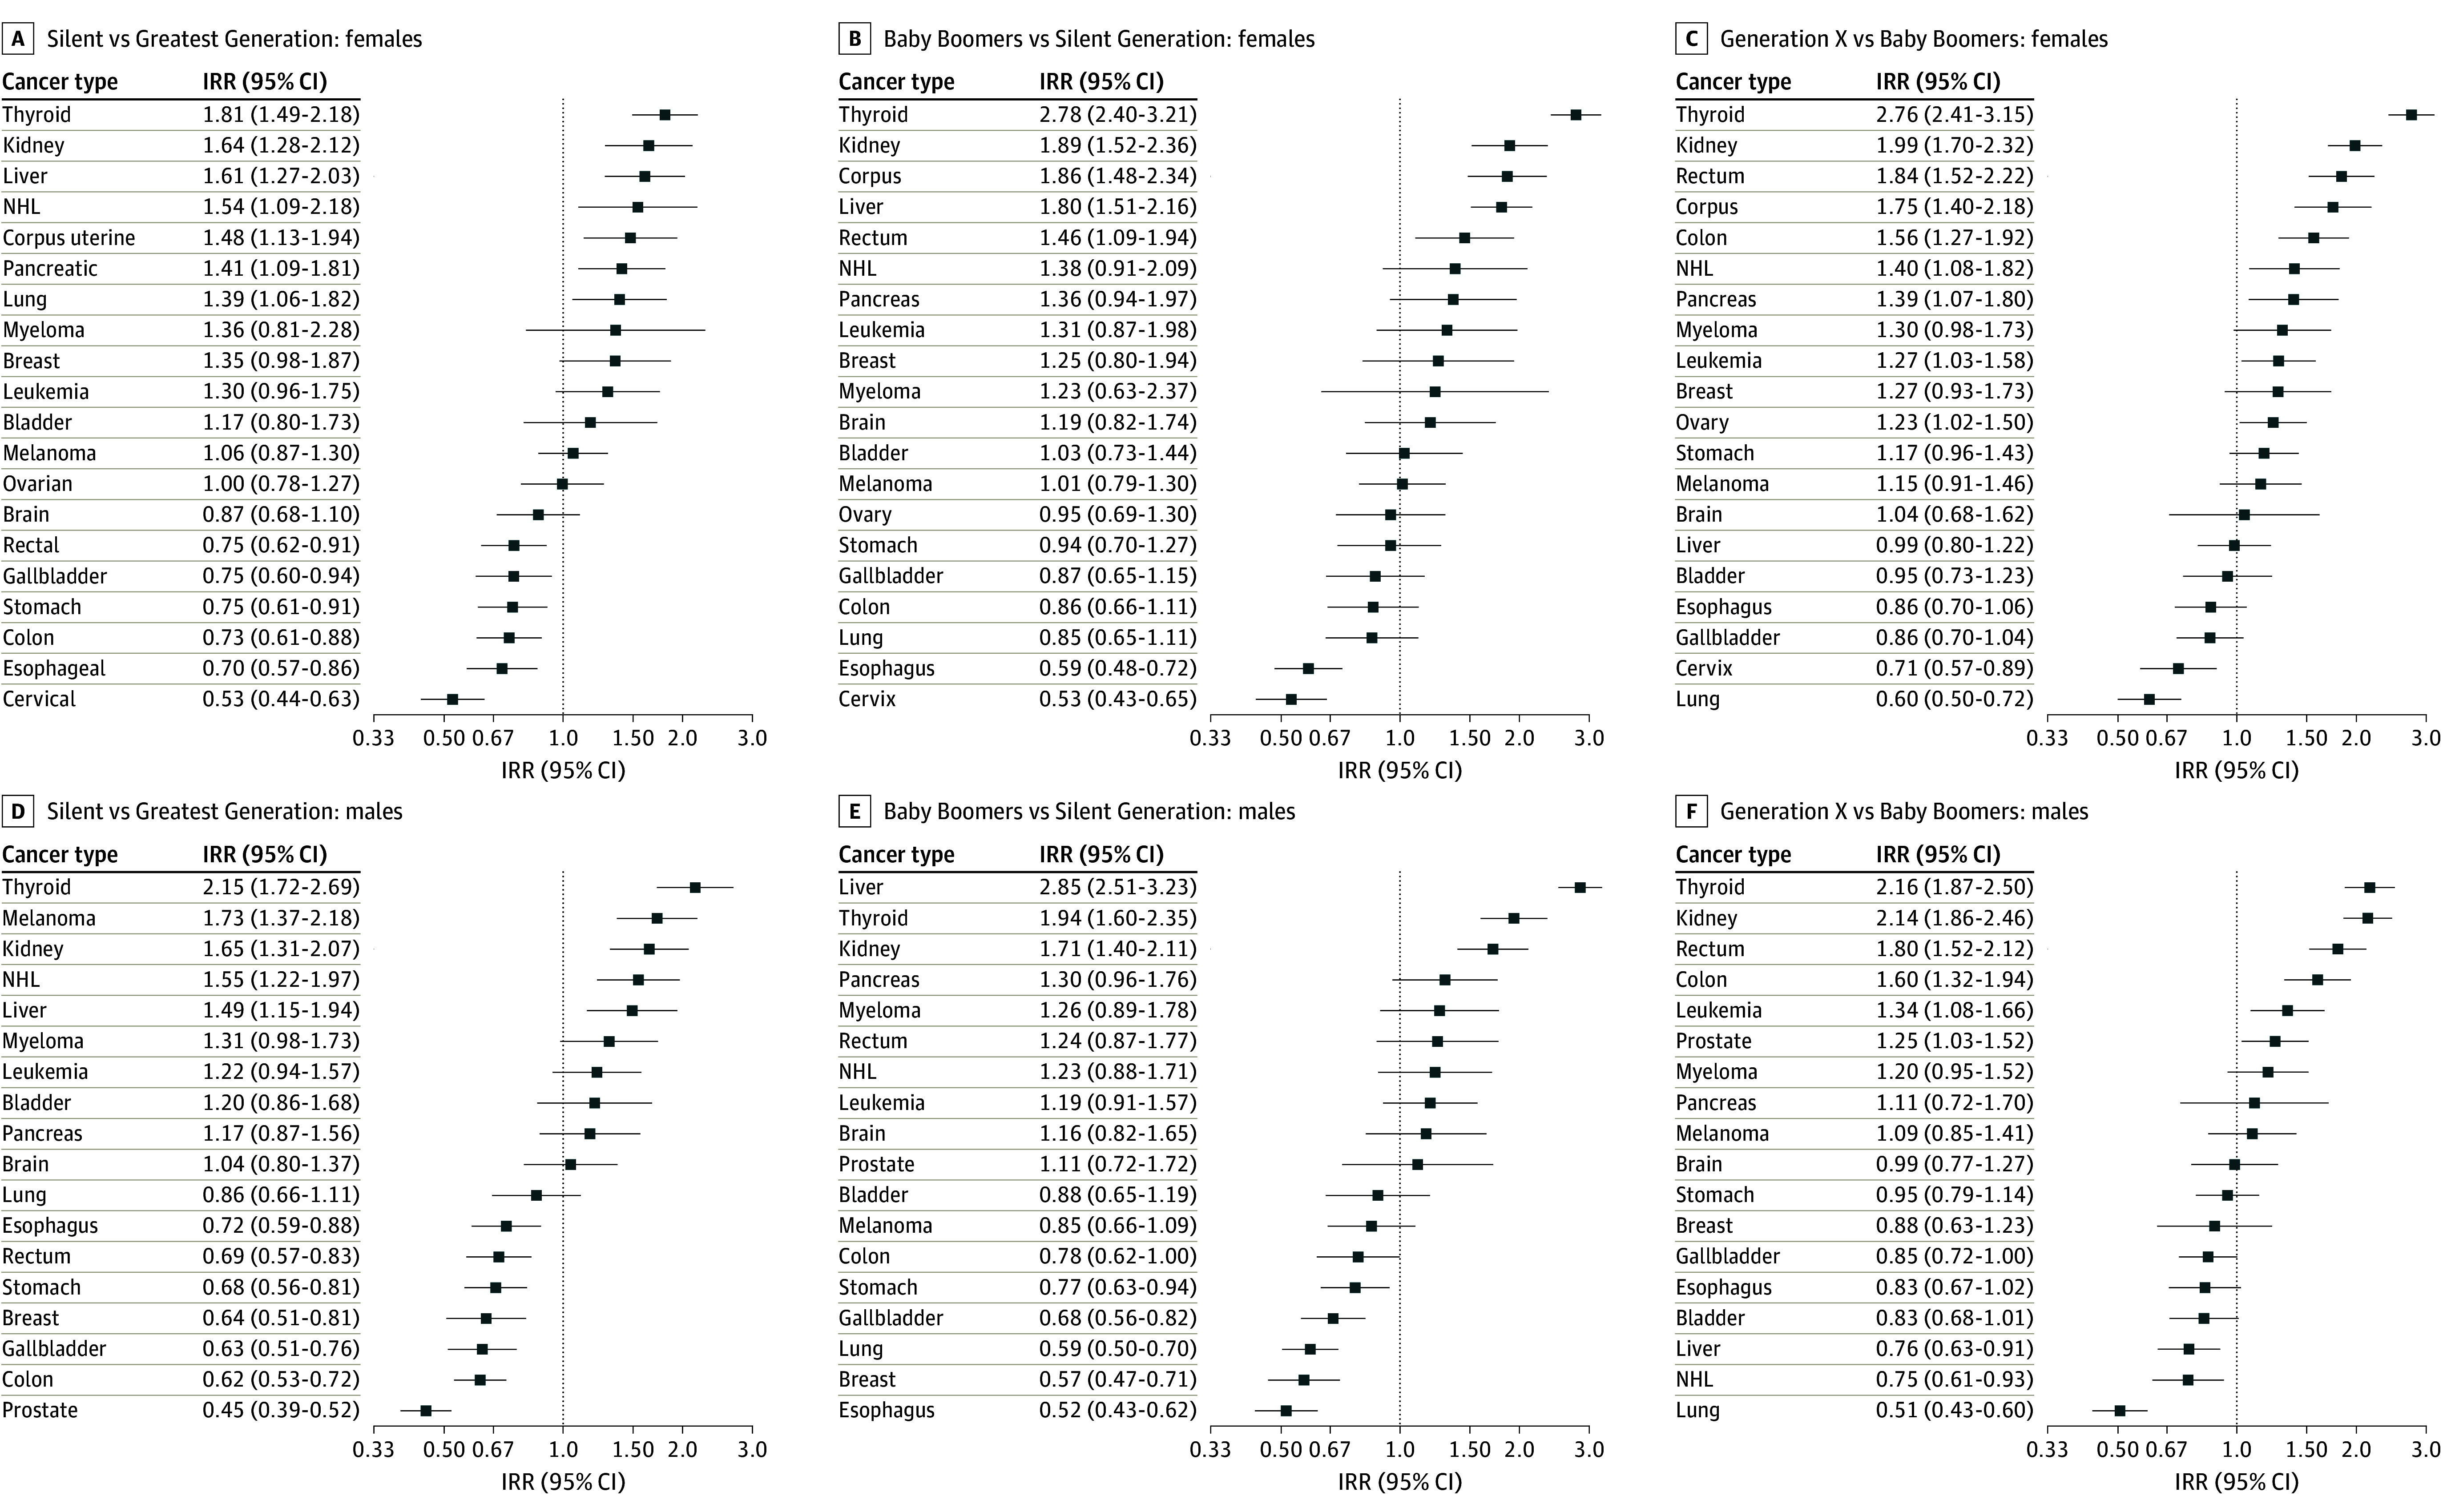
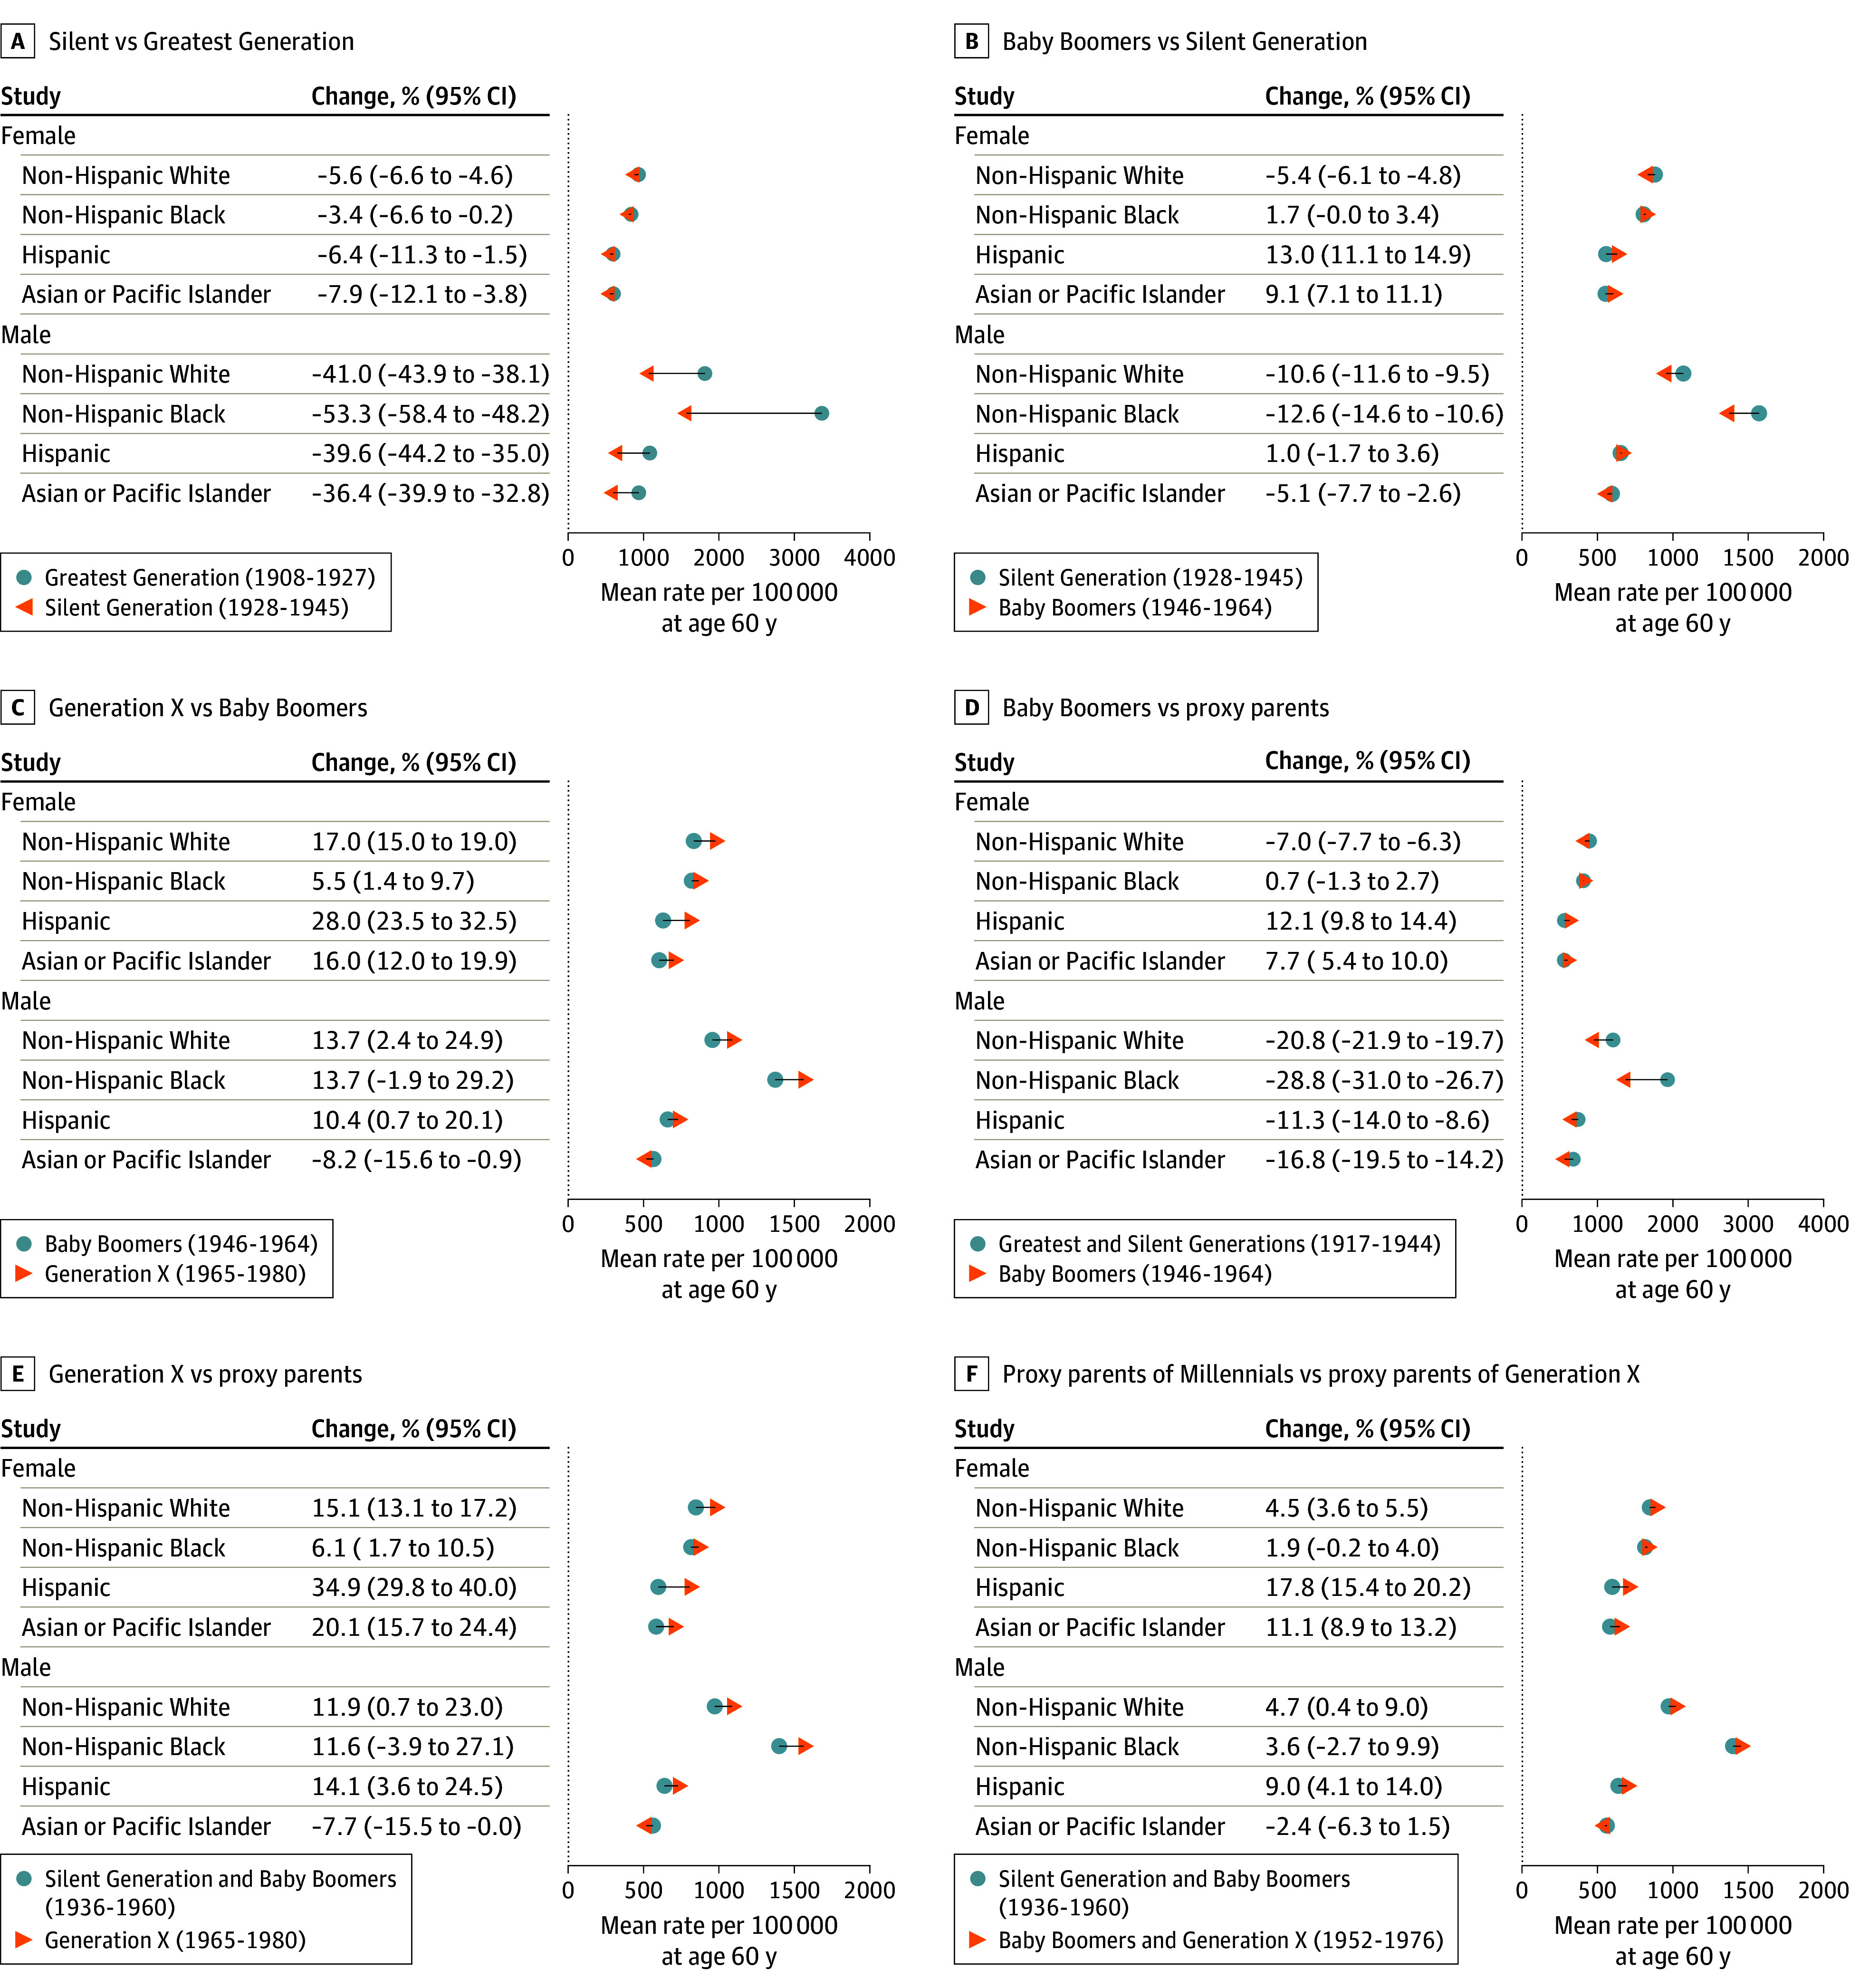
Main outcome and measures: Stratum-specific semiparametric age-period-cohort (SAGE) models were fitted and incidence per 100 000 person-years at the reference age of 60 years was calculated for single-year birth cohorts from 1908 through 1983 (fitted cohort patterns [FCPs]). The FCPs and FCP incidence rate ratios (IRRs) were compared by site for Generation X (born between 1965 and 1980) and Baby Boomers (born between 1946 and 1964).
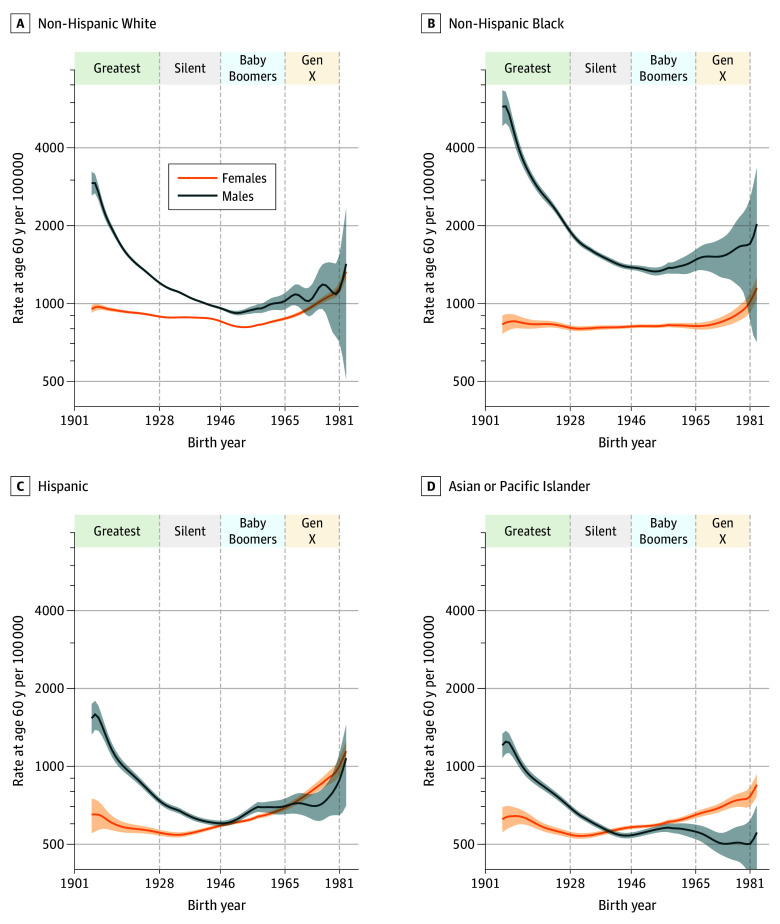
Results: A total of 3.8 million individuals with invasive cancer (51.0% male; 8.6% Asian or Pacific Islander, 9.5% Hispanic, 10.4% non-Hispanic Black, and 71.5% non-Hispanic White) were included in the analysis. In Generation X vs Baby Boomers, FCP IRRs among women increased significantly for thyroid (2.76; 95% CI, 2.41-3.15), kidney (1.99; 95% CI, 1.70-2.32), rectal (1.84; 95% CI, 1.52-2.22), corpus uterine (1.75; 95% CI, 1.40-2.18), colon (1.56; 95% CI, 1.27-1.92), and pancreatic (1.39; 95% CI, 1.07-1.80) cancers; non-Hodgkins lymphoma (1.40; 95% CI, 1.08-1.82); and leukemia (1.27; 95% CI, 1.03-1.58). Among men, IRRs increased for thyroid (2.16; 95% CI, 1.87-2.50), kidney (2.14; 95% CI, 1.86-2.46), rectal (1.80; 95% CI, 1.52-2.12), colon (1.60; 95% CI, 1.32-1.94), and prostate (1.25; 95% CI, 1.03-1.52) cancers and leukemia (1.34; 95% CI, 1.08-1.66). Lung (IRR, 0.60; 95% CI, 0.50-0.72) and cervical (IRR, 0.71; 95% CI, 0.57-0.89) cancer incidence decreased among women, and lung (IRR, 0.51; 95% CI, 0.43-0.60), liver (IRR, 0.76; 95% CI, 0.63-0.91), and gallbladder (IRR, 0.85; 95% CI, 0.72-1.00) cancer and non-Hodgkins lymphoma (IRR, 0.75; 95% CI, 0.61-0.93) incidence decreased among men. For all cancers combined, FCPs were higher in Generation X than for Baby Boomers because gaining cancers numerically overtook falling cancers in all groups except Asian or Pacific Islander men.
Conclusions and relevance: In this model-based cohort analysis of incident invasive cancer in the general population, decreases in lung and cervical cancers in Generation X may be offset by gains at other sites. Generation X may be experiencing larger per-capita increases in the incidence of leading cancers than any prior generation born in 1908 through 1964. On current trajectories, cancer incidence could remain high for decades.
Conflict of interest statement
Figures
References
-
- Registry groupings in SEER data and statistics. National Cancer Institute; 2023. Accessed March 1, 2024. https://seer.cancer.gov/registries/terms.html
Publication types
MeSH terms
LinkOut - more resources
Full Text Sources
Medical
