. 2024 Jun 10:13:RP95297.
doi: 10.7554/eLife.95297.

Secreted antigen A peptidoglycan hydrolase is essential for Enterococcus faecium cell separation and priming of immune checkpoint inhibitor therapy

Affiliations

Secreted antigen A peptidoglycan hydrolase is essential for Enterococcus faecium cell separation and priming of immune checkpoint inhibitor therapy

Steven Klupt et al. Elife. .

Abstract

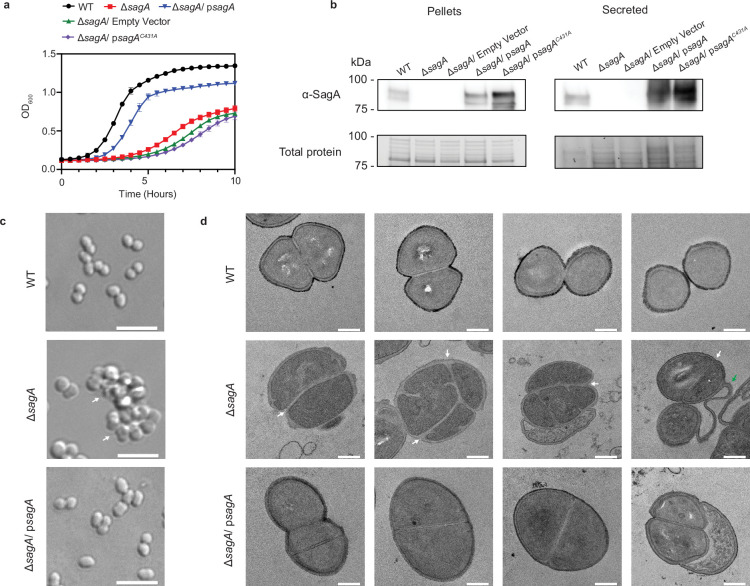
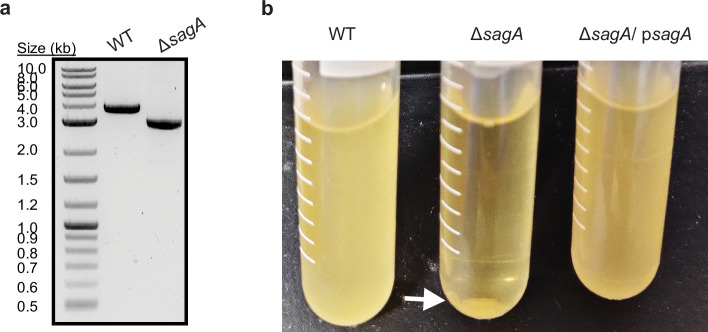
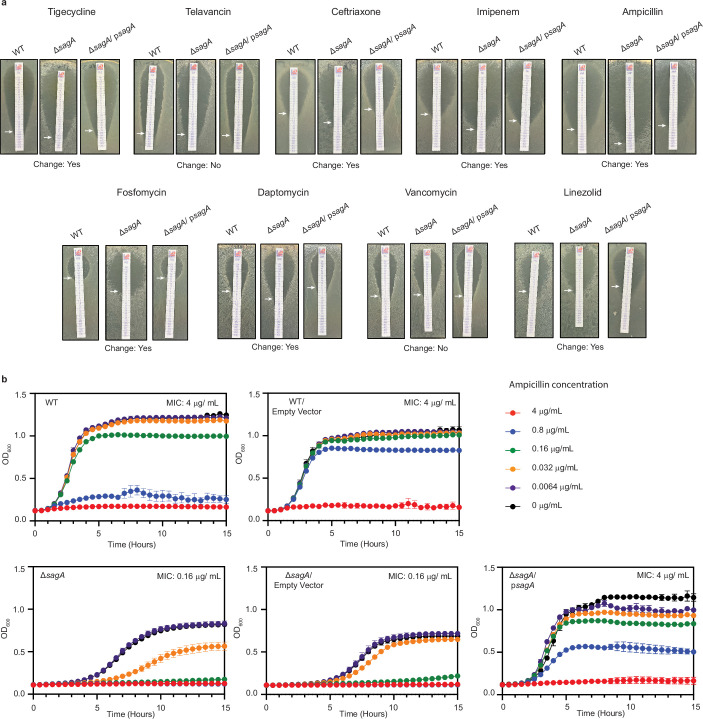
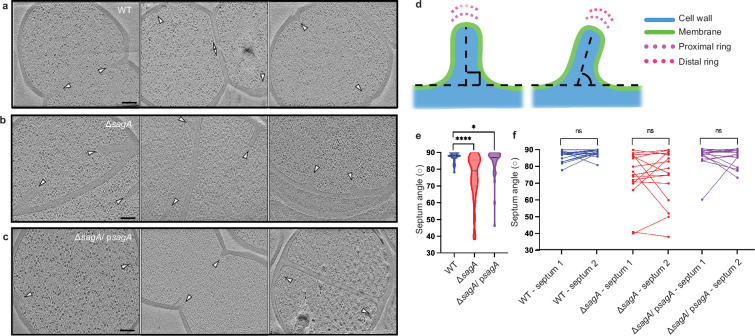
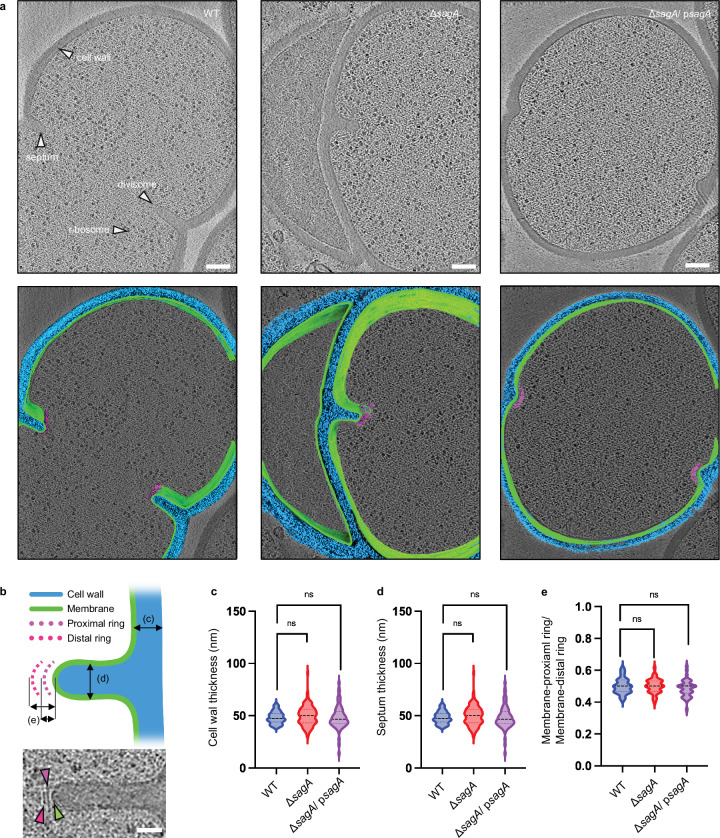
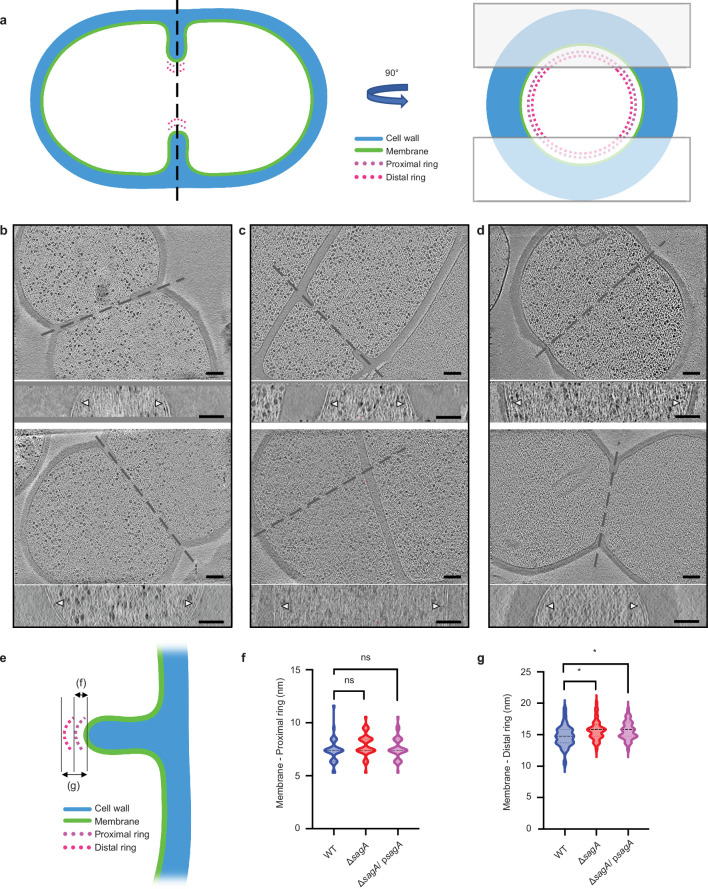
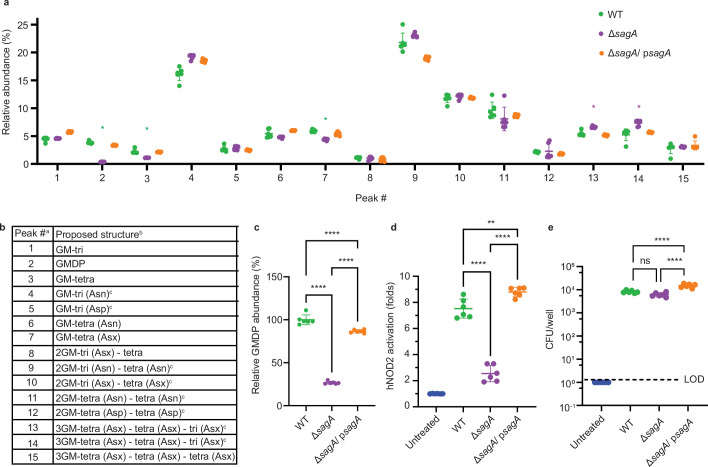
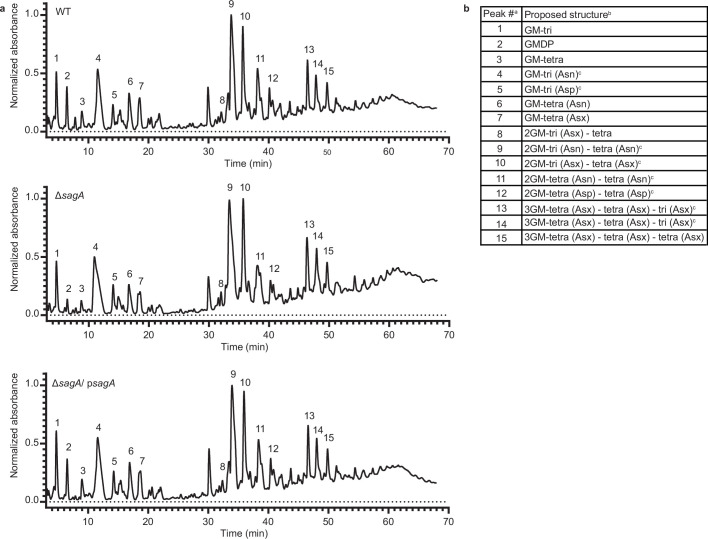
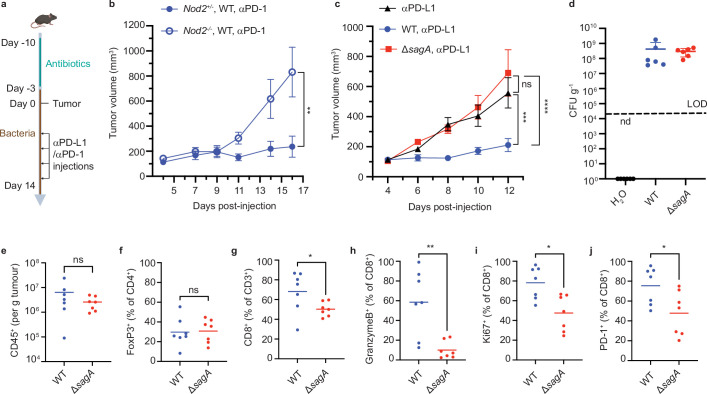
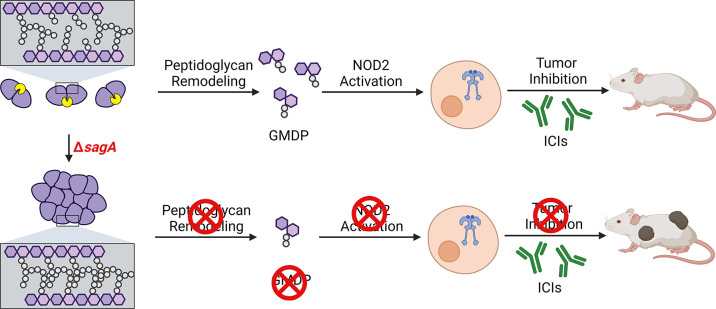
Enterococcus faecium is a microbiota species in humans that can modulate host immunity (Griffin and Hang, 2022), but has also acquired antibiotic resistance and is a major cause of hospital-associated infections (Van Tyne and Gilmore, 2014). Notably, diverse strains of E. faecium produce SagA, a highly conserved peptidoglycan hydrolase that is sufficient to promote intestinal immunity (Rangan et al., 2016; Pedicord et al., 2016; Kim et al., 2019) and immune checkpoint inhibitor antitumor activity (Griffin et al., 2021). However, the functions of SagA in E. faecium were unknown. Here, we report that deletion of sagA impaired E. faecium growth and resulted in bulged and clustered enterococci due to defective peptidoglycan cleavage and cell separation. Moreover, ΔsagA showed increased antibiotic sensitivity, yielded lower levels of active muropeptides, displayed reduced activation of the peptidoglycan pattern-recognition receptor NOD2, and failed to promote cancer immunotherapy. Importantly, the plasmid-based expression of SagA, but not its catalytically inactive mutant, restored ΔsagA growth, production of active muropeptides, and NOD2 activation. SagA is, therefore, essential for E. faecium growth, stress resistance, and activation of host immunity.

Keywords: Enterococcus faecium; NOD2; cancer immunotherapy; immunology; inflammation; mouse.


Conflict of interest statement

SK, KF, XZ, PC, AM, TB, DG, DP No competing interests declared, HH has filed patent applications (PCT/US2016/028836, PCT/US2020/019038) for the commercial use of SagA-bacteria to improve intestinal immunity and checkpoint blockade immunotherapy, which has been licensed by Rise Therapeutics for probiotic development

Figures

Figure 1.
Figure 1.. Growth and morphology phenotypes of wild-type, ΔsagA, and psagA complemented E. faecium Com15 strains.
(a) Growth curves of E. faecium WT, ΔsagA, and complementation strains with functional and nonfunctional sagA genes (n=3). Data are presented as mean value ± standard deviation. (b) ɑ-SagA western blot of E. faecium WT, ΔsagA, and complementation strains with functional and nonfunctional sagA genes, on both whole cell lysate (pellets) and total secreted proteins (secreted). Bottom panel shows total protein loading visualized by Stain-free imaging and serves as protein loading control. (c) Differential interference contrast (DIC) microscopy of E. faecium WT, ΔsagA, and ΔsagA/psagA complemented strains. White arrows point to cell clusters. Scale bar = 5 µm. (d) Transmission electron microscopy (TEM) of E. faecium WT, ΔsagA, and ΔsagA/psagA complemented strains. White arrows point to failed cell separation in ΔsagA. Green arrow points to undegraded peptidoglycan in ΔsagA. Scale bar = 0.2 µm.
Figure 1—figure supplement 1.
Figure 1—figure supplement 1.. Analysis of E.faecium ΔsagA deletion and complementation studies.
(a) PCR validation of ΔsagA deletion. (b) ΔsagA cells are sedimented at the bottom of the tube compared to E. faecium wild-type (WT) and ΔsagA / psagA.
Figure 1—figure supplement 2.
Figure 1—figure supplement 2.. Antibiotic sensitivity of ΔsagA.
(a) Approximate minimum inhibitory concentration (MIC) determinations via antibiotic test strips for E. faecium wild-type (WT), ΔsagA and ΔsagA/ psagA. White arrows point to MIC values (summary of MIC determination is in Figure 1—figure supplement 2—source data 2). (b) Liquid culture MIC determination for ampicillin. Growth curves of E. faecium WT, ΔsagA, and ΔsagA/ psagA in the presence of serially diluted ampicillin (n=3). Data are presented as mean value ± standard deviation. MIC is defined as minimum tested concentration at which no bacterial growth is observed.
Figure 2.
Figure 2.. Deletion of sagA changes the angle of growing septum.
(a-c) Representative tomographic slices (n=3) of E. faecium strains: E. faecium wild-type (WT) (a), ΔsagA (b), and ΔsagA/psagA (c). Cell division septa are indicated by white arrows. Scale bar = 100 nm. (d) A diagram indicating how septum angle measurements were collected. Acute angles are recorded for further analysis. (e) Comparison of septum angle. The violin plot displays the distribution of septum angle, with E. faecium WT (n=40) shown in blue, ΔsagA (n=49) shown in red, and ΔsagA/psagA (n=37) shown in magenta. Black dotted lines represent median (E. faecium WT: 88°, ΔsagA: 79°, ΔsagA/ psagA: 87°) while the colored dotted lines represent quartiles. Welch’s t-test was used to calculate statistical significance. *p< 0.05; ****p< 0.0001. (f), Pairwise comparison of septum angle in opposing septa. The paired plot displays the distribution of septum angle, with E. faecium WT (n=18) shown in blue, ΔsagA (n=16) shown in red, and ΔsagA/ psagA (n=16) shown in magenta. Two septum angles from opposing septa are linked with straight lines. Paired t-test was used to calculate statistical significance. ns, p≥0.05.
Figure 2—figure supplement 1.
Figure 2—figure supplement 1.. E.faecium ΔsagA exhibits no defects in cell wall and septum thickness.
(a) Representative cryo-electron tomography (cryo-ET) images of E. faecium wild-type (WT), ΔsagA, and ΔsagA/psagA are shown in the top row. The cell wall, septum, divisome, and ribosome are indicated by white arrows. 3D segmentations are shown in the bottom row. The cell wall is annotated in blue, the membrane in green, and the divisome in magenta. Scale bar = 100 nm. (b) The upper panel shows a diagram illustrating how measurements are collected. In the lower panel, a representative cryo-ET image of the septum is shown. Scale bar = 50 nm. (c), Comparison of cell wall thickness. The violin plot displays the distribution of cell wall thickness, with E. faecium WT (n=66) shown in blue, ΔsagA (n=96) shown in red, and ΔsagA/psagA (n=69) shown in magenta. Black dotted lines represent median (E. faecium WT: 47.48 nm, ΔsagA: 50.11 nm, ΔsagA/ psagA: 46.42 nm) while the colored dotted lines represent quartiles. Welch’s t-est was used to calculate statistical significance. ns, p≥ 0.05. (d) Comparison of septum thickness. The violin plot displays the distribution of septum thickness, with E. faecium WT (n=26) shown in blue, ΔsagA (n=62) shown in red, and ΔsagA/psagA (n=16) shown in magenta. Black dotted lines represent median (E. faecium WT: 54.33 nm, ΔsagA: 54.86 nm, ΔsagA/psagA: 57.50 nm) while the colored dotted lines represent quartiles. Welch’s t-test was used to calculate statistical significance. ns, p≥ 0.05. (e) Comparison of divisome architecture. To assess potential alterations in the divisome architecture, the distance between the apical end of the septum and the membrane-proximal ring was divided by the distance between the apical end of the septum and the membrane-distal ring. The violin plot displays the distribution of the ratios, with E. faecium WT (n=31) shown in blue, ΔsagA (n=40) shown in red, and ΔsagA/psagA (n=42) shown in magenta. Black dotted lines represent median (E. faecium WT: 0.5, ΔsagA: 0.5, ΔsagA/psagA: 0.5) while the colored dotted lines represent quartiles. Welch’s t-test was used to calculate statistical significance. ns, p≥0.05.
Figure 2—figure supplement 2.
Figure 2—figure supplement 2.. Deletion of sagA alters the position of cell division.
(a) Cartoon model depicting cell division site in the xy coordinate plane (left) and xz coordinate plane (right). The two boxes shown in right represent the cryo-focused ion beam (cryo-FIB) milling patterns used to generate thin sections of E. faecium for subsequent cryo-electron tomography (cryo-ET) imaging. (b–d) Representative tomographic slices (n=2) of E. faecium strains: E. faecium wild-type (WT) (b), ΔsagA (c), and ΔsagA/ psagA. (d). The upper panels show the view of dividing cells in the xy coordinate plane and, while the corresponding bottom panels show the divisome complex (annotated with white arrows) at the highlighted areas in the corresponding upper panels in the xz coordinate plane, obtained by rotating the cell 90° along the highlighted axis. Scale bar = 100 nm. (e) A diagram indicating how measurements were collected. (f) Comparison of membrane to proximal ring distance. The violin plot displays the distribution of distance between the apical end of septum membrane to the proximal ring, with E. faecium WT (n=31) shown in blue, ΔsagA (n=40) shown in red, and ΔsagA/psagA (n=42) shown in magenta. Black dotted lines represent median (E. faecium WT: 7.39 nm, ΔsagA: 7.39 nm, ΔsagA/psagA: 7.39 nm) while the colored dotted lines represent quartiles. Welch’s t-est was used to calculate statistical significance. ns, p≥0.05. (g) Comparison of membrane to distal ring distance. The violin plot displays the distribution of distance between the apical end of septum membrane to the distal ring, with E. faecium WT (n=31) shown in blue, ΔsagA (n=40) shown in red, and ΔsagA/psagA (n=42) shown in magenta. Black dotted lines represent median (E. faecium WT: 14.77 nm, ΔsagA: 15.83 nm, ΔsagA/psagA: 15.83 nm) while the colored dotted lines represent quartiles. Welch’s t-test was used to calculate statistical significance. *p< 0.05.
Figure 3.
Figure 3.. Peptidoglycan profile and NOD2 activation of E.faecium ΔsagA.
(a) Relative abundance of muropeptides isolated from mutanolysin-digested sacculi of E. faecium strains and analyzed by LC-MS (n=6). Green asterisks highlight changes in abundance of small muropeptides, purple asterisks highlight changes in abundance of crosslinked peptidoglycan fragments. Numbers correspond to different muropeptides from LC-MS analysis listed in legend. (b) Composition of muropeptides from E. faecium sacculi. a Peak numbers refer to (a). b GM, disaccharide (GlcNAc-MurNAc); 2 GM, disaccharide-disaccharide (GlcNAc-MurNAc-GlcNAc-MurNAc); 3 GM, disaccharide-disaccharide-disaccharide (GlcNAc-MurNAc-GlcNAc-MurNAc-GlcNAc-MurNAc); GM-Tri, disaccharide tripeptide (L-Ala-D-iGln-L-Lys); GM-Tetra, disaccharide tetrapeptide (L-Ala-D-iGln-L-Lys-D-Ala); GM-Penta, disaccharide pentapeptide (L-Ala-D-iGln-L-Lys-D-Ala -D-Ala). c The assignment of the amide and the hydroxyl functions to either peptide stem is arbitrary. (c) Relative abundance of GMDP relative to wild-type (WT) from LC-MS chromatograms (n=6). (d), NF-κB responses of HEK-Blue hNOD2 cells to live E. faecium strains (MOI = 1, n=6). NOD2 activation is expressed as fold change relative to untreated control. (e) Colony forming units (CFU) of E. faecium strains (MOI = 1) internalized in HEK-Blue hNOD2 cells (n=6). Dashed line indicates Limit of Detection (LOD). Data for (a, c–e) represent mean value ± standard deviation and analyzed with one-way ANOVA and Tukey’s multiple comparison post hoc test. *p≤0.05; **p≤0.01; ***p≤0.005; ****p≤0.001; ns, not significant.
Figure 3—figure supplement 1.
Figure 3—figure supplement 1.. Peptidoglycan profile of E. faecium ΔsagA by LC-MS.
(a) Representative LC-MS chromatograms of mutanolysin-digested peptidoglycan isolated from sacculi of E. faecium wild-type (W)T (top), ΔsagA (middle), and ΔsagA/ psagA (bottom). Numbers correspond to each muropeptide annotated in the table (b) b Composition of mutanolysin-digested peptidoglycan isolated from E. faecium sacculi. a Peak numbers refer to (a). b GM, disaccharide (GlcNAc-MurNAc); 2 GM, disaccharide-disaccharide (GlcNAc-MurNAc-GlcNAc-MurNAc); 3 GM, disaccharide-disaccharide-disaccharide (GlcNAc-MurNAc-GlcNAc-MurNAc-GlcNAc-MurNAc); GM-Tri, disaccharide tripeptide (L-Ala-D-iGln-L-Lys); GM-Tetra, disaccharide tetrapeptide (L-Ala-D-iGln-L-Lys-D-Ala); GM-Penta, disaccharide pentapeptide (L-Ala-D-iGln-L-Lys-D-Ala -D-Ala). c The assignment of the amide and the hydroxyl functions to either peptide stem is arbitrary.
Figure 4.
Figure 4.. Immune checkpoint inhibitor antitumor activity and tumor immune profile of E.faecium ΔsagA colonized mice.
(a) Schematic of tumor growth experiment: mice were provided water containing antibiotics for one week and started drinking bacteria three days before tumor implantation. Once the tumor reaches ~100 mm3, the measurement starts, and two days after treated with anti-PD-1 (MC38) or anti-PD-L1 (B16F10) every other day. (b) MC-38 tumor growth in Nod2+/- or Nod2-/- mice that were colonized with E. faecium WT and treated with anti-PD-1 starting at day 7. +/-=10 for Nod2+/- +/-, n=6 for Nod2-/- mice. (c) B16F10 tumor growth in C57BL/6 mice that were colonized with E. faecium wild-type (WT) or ΔsagA and treated with anti-PD-L1 starting at day 6. No bacterial colonization group as a control (black). n=7–8 mice per group. (d) Fecal colony forming units (CFU) analysis of E. faecium on HiCrome Enterococcus faecium agar plates from (c) at day 6. n=6 per group. Each dot represents one mouse. The line indicates the limit of detection (LOD, 4000 CFU g–1). Nd, not detected. Data represent means ± 95% confidence interval. (e–j) Quantification of tumor infiltrating CD45+ cells (e), FoxP3+ cells (f), CD3+ CD8+ cells (g), GranzymeB+ CD8+ T cells (h), Ki67+ CD8+ T cells (i), and PD-1+ CD8+ T cells (j). For (f, h-j), fluorescence minus one (FMO) control was used to define gates. n=7 mice per group. Data for (b) and (c) represent mean ± SEM and were analyzed using a mixed effects model with Tukey’s multiple comparisons post hoc test. Data for (e–j) represent mean ± SEM and were analyzed by the Mann-Whitney U (one-tail) test. *p<0.05, **p<0.01, ***p<0.001, ****p<0.0001; ns, not significant.
Figure 4—figure supplement 1.
Figure 4—figure supplement 1.. Gating strategy used for flow cytometry analysis of tumor infiltrating lymphocytes (TILs).
We first identified total tumor infiltrating cells by forward and side scatter gating. We then selected single cells using forward scatter area (FSC-A) versus forward scatter height (FSC-H) parameters and side scatter area (SSC-A) versus side scatter height (SSC-H) parameters, respectively. From the single-cell population, we selected live cells by gating on LIVE/DEAD dye events. Then, we selected total leukocytes from live cells, using the pan-leukocyte marker CD45. From the total leukocytes, we identified T cells and NK cells using the pan-T cell marker CD3 and the NK cell marker NK1.1. We then split T cells (CD3+ NK1.1-) into CD4+ and CD8+ populations using CD4 and CD8 expression. From the total CD8+ T cells, we further gated GranzymeB+CD8+ cytotoxic T cells, Ki67+CD8+ T cells, and PD-1+CD8+ T cells. From the total CD4+ T cells, FoxP3+ CD4+ T cells were identified as regulatory T cells. We also gated the GranzymeB+ NK cells from NK (CD3- NK1.1+) cells.
Figure 5.
Figure 5.. Summary of SagA function in E. faecium and impact on host immunity during ICI cancer therapy.
Deletion of sagA impairs peptidoglycan remodeling and cell separation in E. faecium and limits the activation of NOD2 in mammalian cells to promote immune checkpoint inhibitor cancer therapy in mouse models. Created with BioRender.com.

Update of

Similar articles

Cited by

References

    1. Barnett MPG, McNabb WC, Cookson AL, Zhu S, Davy M, Knoch B, Nones K, Hodgkinson AJ, Roy NC. Changes in colon gene expression associated with increased colon inflammation in interleukin-10 gene-deficient mice inoculated with Enterococcus species. BMC Immunology. 2010;11:39. doi: 10.1186/1471-2172-11-39. - DOI - PMC - PubMed
    1. Belloso Daza MV, Cortimiglia C, Bassi D, Cocconcelli PS. Genome-based studies indicate that the Enterococcus faecium Clade B strains belong to Enterococcus lactis species and lack of the hospital infection associated markers. International Journal of Systematic and Evolutionary Microbiology. 2021;71:004948. doi: 10.1099/ijsem.0.004948. - DOI - PubMed
    1. Belloso Daza MV, Almeida-Santos AC, Novais C, Read A, Alves V, Cocconcelli PS, Freitas AR, Peixe L. Distinction between Enterococcus faecium and Enterococcus lactis by a gluP PCR-Based Assay for Accurate Identification and Diagnostics. Microbiology Spectrum. 2022;10:e0326822. doi: 10.1128/spectrum.03268-22. - DOI - PMC - PubMed
    1. Brogan AP, Rudner DZ. Regulation of peptidoglycan hydrolases: localization, abundance, and activity. Current Opinion in Microbiology. 2023;72:102279. doi: 10.1016/j.mib.2023.102279. - DOI - PMC - PubMed
    1. Canfield GS, Chatterjee A, Espinosa J, Mangalea MR, Sheriff EK, Keidan M, McBride SW, McCollister BD, Hang HC, Duerkop BA. Lytic bacteriophages facilitate antibiotic sensitization of Enterococcus faecium. Antimicrobial Agents and Chemotherapy. 2023;65:e00143-21. doi: 10.1128/AAC.00143-21. - DOI - PMC - PubMed

MeSH terms