. 2024 Sep 9;73(10):1712-1724.
doi: 10.1136/gutjnl-2023-331237.

PARP-1 selectively impairs KRAS-driven phenotypic and molecular features in intrahepatic cholangiocarcinoma

Affiliations

PARP-1 selectively impairs KRAS-driven phenotypic and molecular features in intrahepatic cholangiocarcinoma

Friederike L Keggenhoff et al. Gut. .

Abstract

Objective: Intrahepatic cholangiocarcinoma (iCCA) is the second most common primary liver cancer with limited therapeutic options. KRAS mutations are among the most abundant genetic alterations in iCCA associated with poor clinical outcome and treatment response. Recent findings indicate that Poly(ADP-ribose)polymerase1 (PARP-1) is implicated in KRAS-driven cancers, but its exact role in cholangiocarcinogenesis remains undefined.

Design: PARP-1 inhibition was performed in patient-derived and established iCCA cells using RNAi, CRISPR/Cas9 and pharmacological inhibition in KRAS-mutant, non-mutant cells. In addition, Parp-1 knockout mice were combined with iCCA induction by hydrodynamic tail vein injection to evaluate an impact on phenotypic and molecular features of Kras-driven and Kras-wildtype iCCA. Clinical implications were confirmed in authentic human iCCA.

Results: PARP-1 was significantly enhanced in KRAS-mutant human iCCA. PARP-1-based interventions preferentially impaired cell viability and tumourigenicity in human KRAS-mutant cell lines. Consistently, loss of Parp-1 provoked distinct phenotype in Kras/Tp53-induced versus Akt/Nicd-induced iCCA and abolished Kras-dependent cholangiocarcinogenesis. Transcriptome analyses confirmed preferential impairment of DNA damage response pathways and replicative stress response mediated by CHK1. Consistently, inhibition of CHK1 effectively reversed PARP-1 mediated effects. Finally, Parp-1 depletion induced molecular switch of KRAS-mutant iCCA recapitulating good prognostic human iCCA patients.

Conclusion: Our findings identify the novel prognostic and therapeutic role of PARP-1 in iCCA patients with activation of oncogenic KRAS signalling.

Keywords: CARCINOGENESIS; CHOLANGIOCARCINOMA; GENE MUTATION; MOLECULAR ONCOLOGY.


Conflict of interest statement

Competing interests: None declared.

Figures
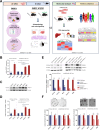
Figure 1
Figure 1
PARP-1 expression in KRAS-mutant and KRAS-wildtype iCCA and effect of siRNA-mediated knockdown of PARP-1 on cell viability, colony and sphere formation capacity. (A) Graphical representation of the experimental design. (B) Relative PARP-1 expression normalised to normal liver tissue in KRAS-mutant (CCC16, HuCCT1, RBE; red) and KRAS-wildtype iCCA cell lines (CCC33, WITT, HuH28; blue). Mean±SD, n=3, *p<0.05, **p<0.01. (C) Representative Western blot and (D) densitometry analysis of basal PARP-1 protein expression in KRAS-mutant and KRAS-wildtype iCCA cell lines. Relative density of PARP-1 expression normalised to β-actin is shown. Mean±SD, n=3, *p<0.05. (E) Representative Western blot and densitometric analysis of siRNA-mediated knockdown of PARP-1 protein expression in KRAS-mutant (CCC16, HuCCT1, RBE; red) and KRAS-wildtype iCCA cell lines (CCC33, WITT; blue). Relative density of PARP-1 expression normalised to β-actin is shown. Mean±SD, n=3, *p<0.05, **p<0.01, ***p<0.001. (F) Representative images of colony and sphere formation assay as well as % of control after siRNA-mediated PARP-1 knockdown in KRAS-mutant and KRAS-wildtype iCCA cell lines. Mean±SD, n=3, *p<0.05, **p<0.01, ***p<0.001. iCCA, intrahepatic cholangiocarcinoma.
Figure 2
Figure 2
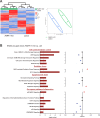
Differential gene expression in KRAS-mutant iCCA cell lines on PARP-1 KO. (A) Unsupervised cluster and PCA of significant genes (p<0.05) of KRAS-mutant iCCA cell lines (HuCCT1, RBE) on PARP-1 KO versus control. (B) Canonical pathways significantly regulated in KRAS-mutant iCCA cell lines on PARP-1 KO versus control identified by IPA. The dashed line indicates the significance threshold of –log (p value >1.3). Shown are z-scores of respective canonical pathways (positive z-score=red/activated, negative z-score=blue/inhibited). iCCA, intrahepatic cholangiocarcinoma; IPA, ingenuity pathway analysis; PCA, principal component analysis.
Figure 3
Figure 3
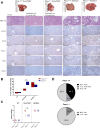
Histology and immunohistochemistry (IHC) of liver sections injected with Kras/Tp53 via HDTV and Akt/Nicd via HDTV and quantification of in vivo tumour growth. (A) Representative images of livers with tumour induction via HDTV (Kras/Tp53; Akt/Nicd) in Parp-1+/+ (n=5/6) and Parp-1−/− mice (n=6). H&E and IHC staining of selected proteins (Sox9, Parp-1, Ki67 and γH2ax) of representative paraffin-embedded tumour sections are shown (3.5 µm). Scale bars indicate 500 µm (×10, H&E) and 1000 µm (×5, IHC). (B) Liver weight/body weight ratio (%) of Parp-1+/+ mice (blue) and Parp-1−/− mice (red) after HDTV of empty vector (EV), Akt/Nicd or Kras/Tp53 plasmid combinations with HSB2. Mean±SD, n=5, **p<0.01, ***p<0.001. (C) Quantification of tumour growth shown as scores: 0=no tumour, 1=small foci/nodules, 2=distinct solid tumour. EV n=5, Akt/Nicd n=5, Kras/Tp53 n=5/6, **p<0.01. (D) Percentage of different lesions in Parp-1+/+ and Parp-1 −/− mice with Kras/Tp53 plasmid combination. HDTV, hydrodynamic tail vein.
Figure 4
Figure 4
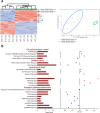
Differential expressed genes after HDTV with Kras/Tp53 in Parp-1−/− versus Parp-1+/+ mice. (A) Unsupervised cluster and PCA plot of significant genes (p<0.05) after HDTV with Kras/Tp53 in Parp-1−/− versus Parp-1+/+ mice. (B) Canonical pathways significantly regulated in tumours induced with Kras/Tp53 in Parp-1−/ versus Parp-1+/+ mice identified by IPA. Dashed line indicated significance threshold of –log (p value >1.3). Shown are z-scores of respective canonical pathways (positive z-score=red/activated, negative z-score=blue/inhibited). HDTV, hydrodynamic tail vein; IPA, ingenuity pathway analysis; PCA, principal component analysis.
Figure 5
Figure 5
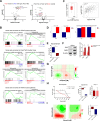
Molecular mechanisms of PARP-1 regulation in KRAS-mutated iCCA. (A) Expression of DNA damage response genes including Chk1 in Parp-1 −/− and Parp-1+/+ mice after Kras/Tp53 injection. Volcano plots are depicted with the log (fold change) of each gene and the –log (p adjusted) was calculated by performing Wald test. Selected genes associated with HR, c-NHEJ and alt-NHEJ are coloured and gene names are displayed. Expression of Chk1 is depicted with red ellipse (B) Gene set enrichment analysis (GSEA) in KRAS-mutated cell lines, Kras/Tp53 Parp-1+/+ mouse model and patient samples. The selection of gene sets was based on statistical significance calculated by nominal p<0.05 and FDR<0.25. NES indicates the degree of overexpression for each group at the peak of the entire gene set. (C) CHK1 gene expression profiles (TCGA) in cholangiocarcinoma versus normal liver tissue (CHOL) presented in box plots and correlation between PARP-1 and CHK1. Values of *p<0.05 were considered as of significant difference. (D) Upper graphs depict gene expression level of CHK1 in KRAS-mutated cell lines and Kras/Tp53 Parp-1+/+/wildtype mouse model, Lower graphs show expression of Chk1 in Kras/Tp53 and Akt/Nicd mouse model with Parp-1 +/+ and Parp-1 −/− genotype. (E) Shown are IC50 concentrations of Rabusertib for KRAS-mutated and non-mutated primary iCCA cell lines. Mean±SD, n=3, *p<0.05. (F) Representative Western blot and densitometric analysis of CHK1 and PARP-1 protein expression on treatment with IC25 concentration of Rabusertib in KRAS-mutant iCCA cell line. Relative density of PARP-1 expression normalised to β-actin is shown. Mean±SD, n=3, *p<0.05, **p<0.01, ***p<0.001. (G) Evaluation of synergistic or antagonistic effects between Rabusertib/Olaparib in primary human cell line. Plots indicate level of synergism between investigated drugs, where red colour represents synergism and green colour antagonism. (H) Dose-response curves of Kras-mutant mouse cell lines with and without functional Parp-1 treated with increasing concentrations of olaparib (left) and their respective IC50 values (middle). Right is shown total number of colonies with and without olaparib treatment. Mean±SD, n=3, *p<0.05. (I) Evaluation of synergistic or antagonistic effects between rabusertib/olaparib in mouse cell lines. Plots indicate level of synergism between investigated drugs, where red colour represents synergism and green colour antagonism. On the right, graph shows average synergy score (ZIP) for both cell lines. iCCA, intrahepatic cholangiocarcinoma; NHEJ, non-homologous end-joining.
Figure 6
Figure 6
Integration of in vitro and in vivo transcriptomic data with prognostic subgroups of CCA patients. (A) The graph shows the integration of KRAS-mutant CRISPR/Cas9 PARP-1 KO clones (dark blue) and respective control clones (light blue) with a previously published dataset of 45 CCA patients with good (pink) and poor (yellow) prognosis. (B) Upper graph shows the integration of Parp-1−/ mice (dark blue) and Parp-1+/+ mice (light blue) with Kras/Tp53-induced carcinogenesis with a previously published dataset of 45 CCA patients with good (pink) and poor (yellow) prognosis. Lower graph shows integration of Parp-1−/− mice (dark green) and Parp-1+/+ mice (light green) with Akt/Nicd -induced carcinogenesis with a previously published dataset of 45 CCA patients with good (pink) and poor (yellow) prognosis. CCA, cholangiocarcinoma.

References

    1. Khan SA, Tavolari S, Brandi G. Cholangiocarcinoma: epidemiology and risk factors. Liver International 2019;39:19–31. 10.1111/liv.14095 - DOI - PubMed
    1. Banales JM, Marin JJG, Lamarca A, et al. . Cholangiocarcinoma 2020: the next horizon in mechanisms and management. Nat Rev Gastroenterol Hepatol 2020;17:557–88. 10.1038/s41575-020-0310-z - DOI - PMC - PubMed
    1. Clements O, Eliahoo J, Kim JU, et al. . Risk factors for Intrahepatic and extrahepatic Cholangiocarcinoma: a systematic review and meta-analysis. J Hepatol 2020;72:95–103. 10.1016/j.jhep.2019.09.007 - DOI - PubMed
    1. Braconi C, Roessler S, Kruk B, et al. . Molecular perturbations in Cholangiocarcinoma: is it time for precision medicine Liver International 2019;39:32–42. 10.1111/liv.14085 - DOI - PubMed
    1. Czauderna C, Kirstein MM, Tews HC, et al. . Molecular subtypes and precision oncology in Intrahepatic Cholangiocarcinoma. J Clin Med 2021;10:2803. 10.3390/jcm10132803 - DOI - PMC - PubMed

MeSH terms

Substances