. 2024 Jun 10;14(1):249.
doi: 10.1038/s41398-024-02947-3.

Pharmacological modulation of developmental and synaptic phenotypes in human SHANK3 deficient stem cell-derived neuronal models

Affiliations

Pharmacological modulation of developmental and synaptic phenotypes in human SHANK3 deficient stem cell-derived neuronal models

Amandine Thibaudeau et al. Transl Psychiatry. .

Abstract

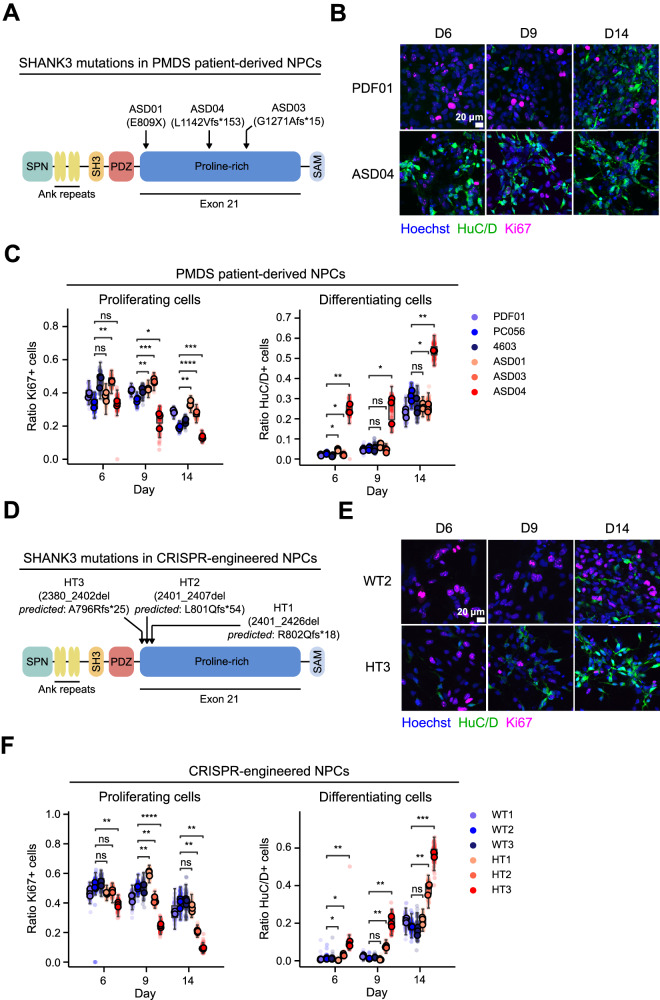
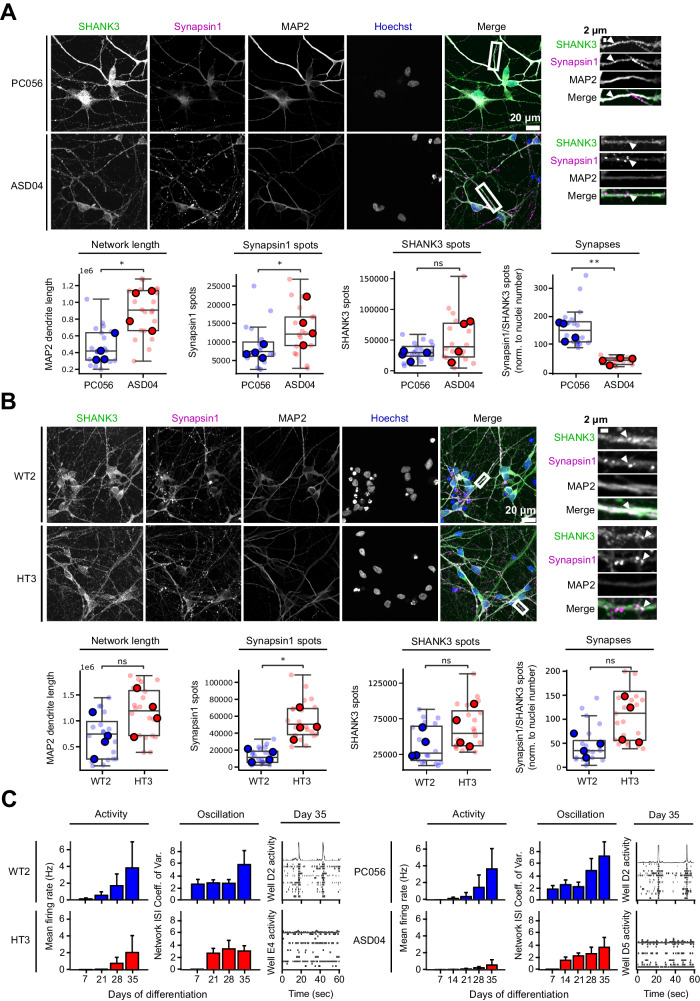
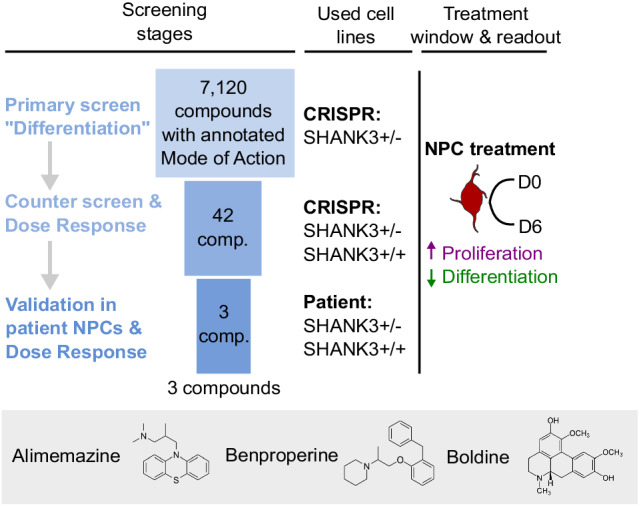
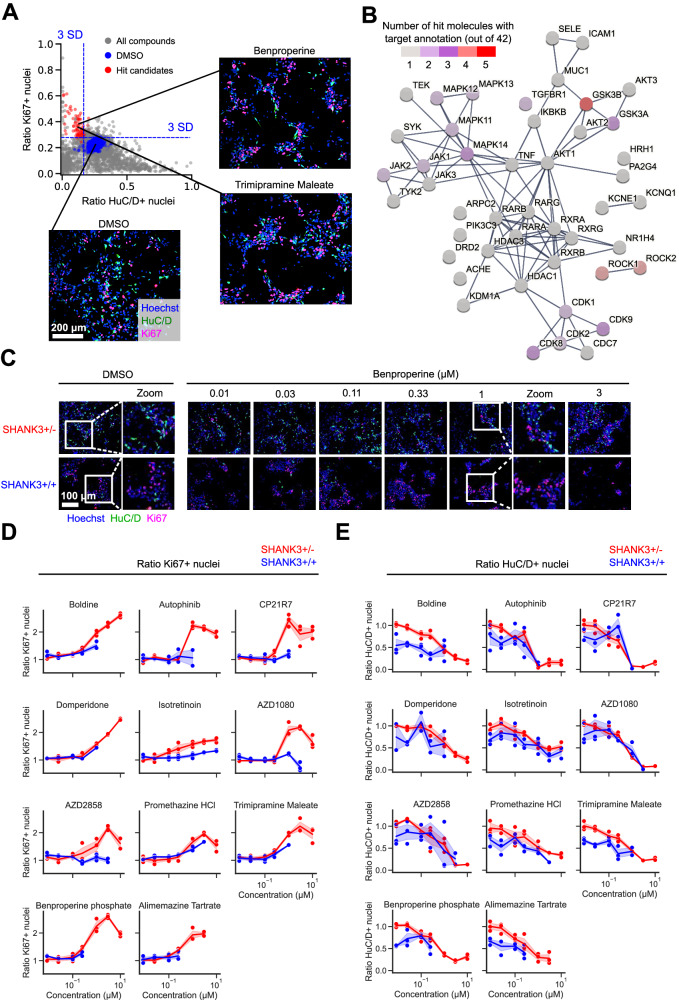
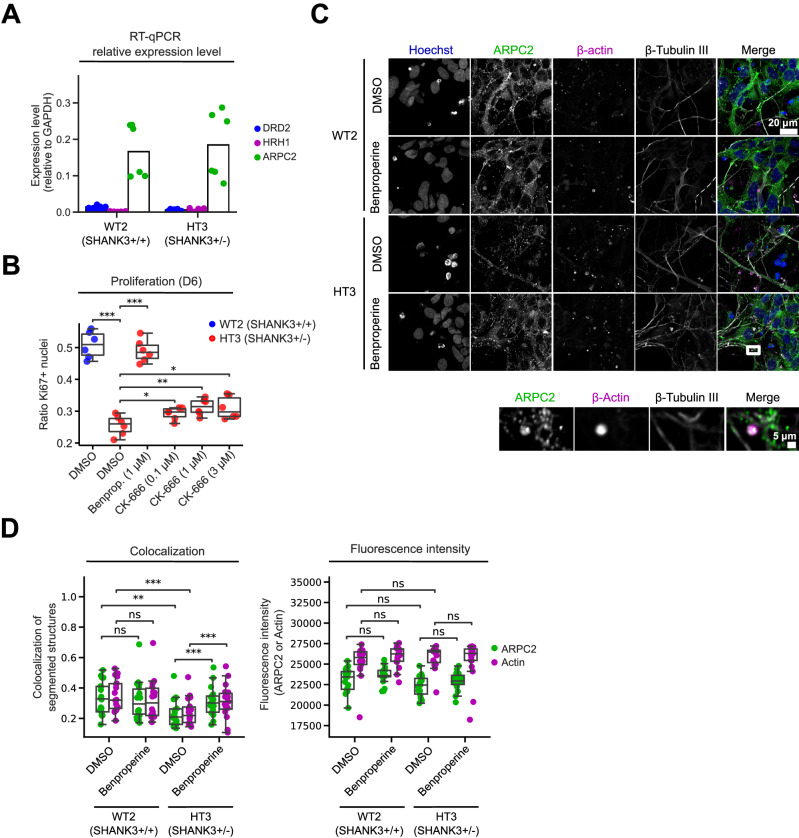
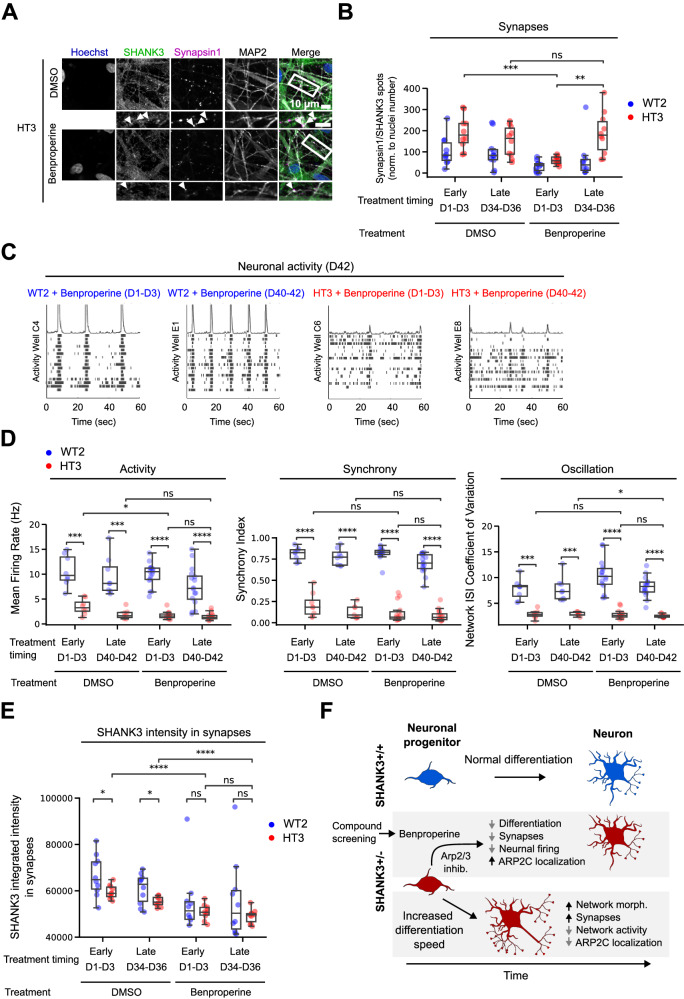
Phelan-McDermid syndrome (PMDS) arises from mutations in the terminal region of chromosome 22q13, impacting the SHANK3 gene. The resulting deficiency of the postsynaptic density scaffolding protein SHANK3 is associated with autism spectrum disorder (ASD). We examined 12 different PMDS patient and CRISPR-engineered stem cell-derived neuronal models and controls and found that reduced expression of SHANK3 leads to neuronal hyperdifferentiation, increased synapse formation, and decreased neuronal activity. We performed automated imaging-based screening of 7,120 target-annotated small molecules and identified three compounds that rescued SHANK3-dependent neuronal hyperdifferentiation. One compound, Benproperine, rescued the decreased colocalization of Actin Related Protein 2/3 Complex Subunit 2 (ARPC2) with ß-actin and rescued increased synapse formation in SHANK3 deficient neurons when administered early during differentiation. Neuronal activity was only mildly affected, highlighting Benproperine's effects as a neurodevelopmental modulator. This study demonstrates that small molecular compounds that reverse developmental phenotypes can be identified in human neuronal PMDS models.


Conflict of interest statement

AT, KS, DH, LCo, AW, AV, CJ, PS, and JW are or were employees of Ksilink. The remaining authors have no conflicts of interest to declare.

Figures

Fig. 1
Fig. 1. SHANK3-deficiency results in hyperdifferentiation in PMDS patient-derived and CRISPR-engineered cell lines.
A Schematic depiction of SHANK3 domains and localization of mutations in the PMDS patient-derived iPSCs. fs* indicates a frame shift and gives the position of the stop codon in the new reading frame. B Fluorescently stained patient-derived NPCs at multiple differentiation timepoints. C Immunostaining-based quantification of the ratio of proliferating and differentiating healthy donor (blues) and patient-derived NPCs (reds). D Same as in (A), but mutations in the CRISPR-engineered cell lines are indicated. Frameshifts are predictions based on the observed deletion. E Same as (B), but in CRISPR-engineered isogenic NPC pairs. F Same as (C), but in CRISPR-engineered isogenic NPC pairs. Each datapoint represents technical replicate data from one 384-well plate well. Larger markers represent the medians of independent differentiation experiments (N = 3). The boxplots show the median and the 2nd and 3rd quartiles of the data. Whiskers indicate 1.5X of the interquartile range. Welch’s unequal variances t-test was performed using the medians of independent differentiation experiments. ns = not significant, * = p < 0.05, ** = p < 0.01, *** = p < 0.001.
Fig. 2
Fig. 2. SHANK3-deficiency leads to increased neurite network length and number of synapses, but decreased neuronal activity.
A The PMDS patient-derived ASD04 and healthy control PC056 NPC lines were differentiated for 30 days and fluorescently stained. The length of the MAP2 neurite network and the number of pre-synaptic Synapsin 1 spots, post-synaptic SHANK3 spots and Synapsin 1/SHANK3 double positive synapses were quantified. B Same as in (A), but in CRISPR-engineered SHANK3-deficient HT3 and isogenic control WT2 NPC lines. Each datapoint represents technical replicate data from one 384-well plate well. Larger markers represent the medians of independent differentiation experiments (N = 4). The boxplots show the median and the 2nd and 3rd quartiles of the data. Whiskers indicate 1.5X of the interquartile range. Welch’s unequal variances t-test was performed using the medians of independent differentiation experiments. ns = not significant, * = p < 0.05. C Neuronal activity was measured at multiple differentiation timepoints in PMDS patient-derived and CRISPR-engineered cell lines using a Multi-Electrode Array (MEA). Activity represents the frequency of action potentials. Oscillations are alternating periods of high and low activity. Bar plots show data means from at least six MEA wells and error bars indicate the standard deviation of independent differentiation experiments (N = 2). Raster plots show single well examples of neuronal activity over 60 s. Each row shows activity data from one electrode. Coordinated activity over multiple electrodes is expressed as a spike in the top row.
Fig. 3
Fig. 3. Overview of the applied screening strategy.
During primary screening 7,120 Mode of Action (MoA)-annotated compounds were assessed based on non-toxic proliferation increase and differentiation decrease in the CRISPR-engineered HT3 SHANK3-deficient NPC line. Dose-response testing and counter screening in isogenic control WT2 and PMDS donor-derived NPCs yielded three candidate compounds.
Fig. 4
Fig. 4. Identification of SHANK3 deficiency-specific hyperdifferentiation rescuing chemical compounds in CRISPR-engineered NPCs.
A The top left quadrant shows 42 selected hit candidates (red) based on a 3 standard deviation (SD) window around the DMSO control’s Ki67 and HuC/D ratio means. Molecules that increased proliferation and decreased differentiation and did not lower the nuclei count < 2,000/well were considered as hit candidates. The primary screen was performed in two independent differentiation experiments (N = 2). B Visualization of known physical and functional interactions of all protein targets attributed to the detected hit candidates annotated in the STRING biological database. The color coding represents the frequency of target annotations in the hit list. Compounds can have multiple targets (see also Table S3). C Representative images of CRISPR-engineered SHANK3 + /- and control SHANK3 + /+ NPCs treated with Benproperine at multiple doses. D Dose-response effects of 11 compounds on the ratio of proliferating Ki67 positive SHANK3 + /- and control SHANK3 + /+ NPCs. E Dose-response effects of 11 compounds on the ratio of differentiating HuC/D positive SHANK3 + /- and control SHANK3 + /+ NPCs. Concentrations that were toxic were not used for ratio calculations. The shaded area in the line graphs corresponds to the 95% confidence interval of triplicate technical replicates of a single differentiation (N = 1).
Fig. 5
Fig. 5. Actin-related protein 2/3 complex subunit 2 (ARPC2) inhibition increases proliferation and alters ARPC2 colocalization with ß-actin.
A RT-qPCR was performed using Taqman probes against the annotated compound targets dopamine-2 receptor (DRD2), histamine H1 receptor (HRH1) and actin-related protein 2/3 complex subunit 2 (ARPC2). The expression level was determined relative to GAPDH. B Measurement of Ki67 positive proliferating WT2 and HT3 NPCs treated with the ARPC2 inhibitors Benproperine and CK-666. C Representative images of DMSO or Benproperine treated D6 NPCs with ARPC2, ß-actin, and ß-tubulin III immunofluorescent staining. D Quantification of ARPC2 and ß-actin colocalization and fluorescent intensity. Two independent differentiations were performed using multiple technical replicates (N = 2). The boxplots show the median and the 2nd and 3rd quartiles of the data. Whiskers indicate 1.5X of the interquartile range. Welch’s unequal variances t-test was applied. ns = not significant, * = p < 0.05, ** = p < 0.01, *** = p < 0.001.
Fig. 6
Fig. 6. Benproperine modulates synapse formation and neuronal activity.
A Representative images of fluorescently stained CRISPR-engineered SHANK3-deficient HT3 neurons after 36 days of differentiation and Benproperine treatment. B HT3 mutant or WT2 isogenic control cells were treated with Benproperine either early (D1-3) or late (D34-36) during differentiation and synapses were quantified. C Representative raster plots showing HT3 mutant or WT2 isogenic control neuron activity on a Multi-Electrode Array (MEA) plate after 42 days of differentiation. The cells were treated with Benproperine either early (D1-3) or late (D40-42) during differentiation. D WT2 and HT3 neuronal activity, synchrony, and oscillation determined by MEA after 42 days of differentiation and after early (D1-3) or late (D40-42) Benproperine treatment. E Quantification of the integrated SHANK3 pixel intensities in synapses (Synapsin 1/SHANK3 double positive puncta on MAP2 dendrites). F Schematic overview of the effects of SHANK3 haploinsufficiency and Benproperine treatment on neuronal differentiation. Two separate differentiations were performed (N = 2). The boxplots show the median and the 2nd and 3rd quartiles of the data. Whiskers indicate 1.5X of the interquartile range. Welch’s unequal variances t-test was performed. ns = not significant, * = p < 0.05, ** = p < 0.01, *** = p < 0.001.

References

    1. Burdeus-Olavarrieta M, San José-Cáceres A, García-Alcón A, González-Peñas J, Hernández-Jusdado P, Parellada-Redondo M. Characterisation of the clinical phenotype in Phelan-McDermid syndrome. J Neurodev Disord. 2021;13:26. doi: 10.1186/s11689-021-09370-5. - DOI - PMC - PubMed
    1. Phelan K, McDermid HE. The 22q13.3 Deletion Syndrome (Phelan-McDermid Syndrome) Mol Syndromol. 2012;2:186–201. doi: 10.1159/000334260. - DOI - PMC - PubMed
    1. Phelan MC, Thomas GR, Saul RA, Rogers RC, Taylor HA, Wenger DA, et al. Cytogenetic, biochemical, and molecular analyses of a 22q13 deletion. Am J Med Genet. 1992;43:872–6. doi: 10.1002/ajmg.1320430524. - DOI - PubMed
    1. Leblond CS, Nava C, Polge A, Gauthier J, Huguet G, Lumbroso S, et al. Meta-analysis of SHANK Mutations in Autism Spectrum Disorders: A Gradient of Severity in Cognitive Impairments. PLoS Genet. 2014;10:e1004580. doi: 10.1371/journal.pgen.1004580. - DOI - PMC - PubMed
    1. Moessner R, Marshall CR, Sutcliffe JS, Skaug J, Pinto D, Vincent J, et al. Contribution of SHANK3 Mutations to Autism Spectrum Disorder. Am J Hum Genet. 2007;81:1289–97. doi: 10.1086/522590. - DOI - PMC - PubMed

Supplementary concepts