. 2024 Jun 10;15(6):406.
doi: 10.1038/s41419-024-06771-x.

Histone acetyltransferase Kat2a regulates ferroptosis via enhancing Tfrc and Hmox1 expression in diabetic cardiomyopathy

Affiliations

Histone acetyltransferase Kat2a regulates ferroptosis via enhancing Tfrc and Hmox1 expression in diabetic cardiomyopathy

Juan Zhen et al. Cell Death Dis. .

Abstract

Diabetic cardiomyopathy (DCM) is a prevalent myocardial microvascular complication of the myocardium with a complex pathogenesis. Investigating the pathogenesis of DCM can significantly contribute to enhancing its prevention and treatment strategies. Our study revealed an upregulation of lysine acetyltransferase 2 A (Kat2a) expression in DCM, accompanied by a decrease in N6-methyladenosine (m6A) modified Kat2a mRNA levels. Our study revealed an upregulation of lysine acetyltransferase 2 A (Kat2a) expression in DCM, accompanied by a decrease in N6-methyladenosine (m6A) modified Kat2a mRNA levels. Functionally, inhibition of Kat2a effectively ameliorated high glucose-induced cardiomyocyte injury both in vitro and in vivo by suppressing ferroptosis. Mechanistically, Demethylase alkB homolog 5 (Alkbh5) was found to reduce m6A methylation levels on Kat2a mRNA, leading to its upregulation. YTH domain family 2 (Ythdf2) played a crucial role as an m6A reader protein mediating the degradation of Kat2a mRNA. Furthermore, Kat2a promoted ferroptosis by increasing Tfrc and Hmox1 expression via enhancing the enrichment of H3K27ac and H3K9ac on their promoter regions. In conclusion, our findings unveil a novel role for the Kat2a-ferroptosis axis in DCM pathogenesis, providing valuable insights for potential clinical interventions.


Conflict of interest statement

The authors declare no competing interests.

Figures

Fig. 1
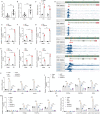
Fig. 1. Kat2a was upregulated in DCM and HG-treated NMVCs.
A Identification of DEGs in GSE173384. B Identification of DEGs in GSE161931. C Identification of abnormally expressed m6A-modified mRNAs in GSE173384. D The upregulated and top 10 downregulated m6A-modified mRNAs were shown in a heat map. E Kat2a mRNA was identified to be anomalously expressed in DCM along with abnormal m6A modification. F Kat2a mRNA expression in heart tissues of control and DCM mice (N = 7 mice/group). G Kat2a expression in heart tissues of control and DCM mice was investigated by IF staining (N = 7 mice/group). Scale bar = 50 μm. H, I Kat2a protein and mRNA expression in NMVCs with or without HG treatment (N = 3 independent experiments). Significance tested using Student’s t-test. Statistical significance is shown as **p < 0.01, ***p < 0.001.
Fig. 2
Fig. 2. Alkbh5 promoted Kat2a expression by reducing m6A modification.
A Predicted binding sites of m6A modification at 3’UTR of Kat2a mRNA according to the online SRAMP database (http://www.cuilab.cn/sramp). B Methylated Kat2a level in heart tissues of Sham and DCM mice (N = 7 mice/group). C Methylated Kat2a level was detected via RIP assay in NMVCs with or without HG treatment (N = 3 independent experiments). D Fto and Alkbh5 protein expression in NMVCs with or without HG treatment (N = 3 independent experiments). E The binding between Alkbh5 protein and Kat2a mRNA was evaluated by RIP assays in NMVCs with or without HG treatment (N = 3 independent experiments). F The binding between Alkbh5 protein and Kat2a mRNA was evaluated by RIP assays in heart tissues of Sham and DCM mice (N = 7 mice/group). GI The changes in Alkbh5 and Kat2a protein levels in NMVCs were evaluated by western blotting (N = 3 independent experiments). J Kat2a mRNA level in NMVCs was evaluated by qPCR (N = 3 independent experiments). K The effect of Alkbh5 overexpression or knockdown on the binding between Alkbh5 protein and Kat2a mRNA (N = 3 independent experiments). L The effect of Alkbh5 overexpression or knockdown on the expression of methylated Kat2a mRNA (N = 3 independent experiments). M Alkbh5 overexpressed or depleted NMVCs were treated with ActD, and then existing Kat2a mRNA was detected at different time points (N = 3 independent experiments). Significance tested using One-way ANOVA. Statistical significance is shown as *p < 0.05, **p < 0.01, ***p < 0.001.
Fig. 3
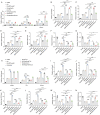
Fig. 3. Ythdf2 promoted the degradation of Kat2a mRNA.
A Ythdf2 protein expression in NMVCs with or without HG treatment (N = 3 independent experiments). B The binding between Ythdf2 protein and Kat2a mRNA was evaluated by RIP assays in NMVCs with or without HG treatment (N = 3 independent experiments). C The binding between Ythdf2 protein and Kat2a mRNA was evaluated by RIP assays in heart tissues of Sham and DCM mice (N = 7 mice/group). D Kat2a mRNA level in NMVCs with Ythdf2 overexpression or knockdown (N = 3 independent experiments). EG The changes of Ythdf2 and Kat2a protein levels in NMVCs with Ythdf2 overexpression or knockdown (N = 3 independent experiments). H The effect of Ythdf2 overexpression or knockdown on the binding between Ythdf2 protein and Kat2a mRNA (N = 3 independent experiments). I Ythdf2 overexpressed or depleted NMVCs were treated with ActD, and then existing Kat2a mRNA was detected at different time points (N = 3 independent experiments). Significance tested using: Student’s t-test (A) and One-way ANOVA (BI). Statistical significance is shown as *p < 0.05, **p < 0.01, ***p < 0.001.
Fig. 4
Fig. 4. Kat2a enhanced ferroptosis of NMVCs under basal and HG conditions.
A The cell death of NMVCs was investigated (N = 3 independent experiments). B The level of labile iron in NMVCs was measured (N = 3 independent experiments). C The level of lipid ROS in the NMVCs (N = 3 independent experiments). D MDA level in NMVCs (N = 3 independent experiments). E, F GSH and GSH/GSSG levels in NMVCs (N = 3 independent experiments). Significance tested using One-way ANOVA. Statistical significance is shown as *p < 0.05, **p < 0.01, ***p < 0.001.
Fig. 5
Fig. 5. Kat2a promoted Tfrc and Hmox1 expression.
A, B Tfrc and Hmox1 mRNA expression in heart tissues of control and DCM mice (N = 7 mice/group). C Tfrc and Hmox1 mRNA expression in NMVCs with or without HG treatment (N = 3 independent experiments). D The enrichment of H3K27ac and H3K9ac signals in the promoter region of Trfc and Hmox1 were visualized by ENCODE. E, H The enrichment of H3K27ac and H3K9ac signals in the promoter region of Trfc and Hmox1 were investigated by ChIP assay (N = 3 independent experiments). I The binding between Kat2a and Hmox1 promoter was verified by ChIP assay (N = 3 independent experiments). J The binding between Kat2a and Trfc promoter was verified by ChIP assay (N = 3 independent experiments). K The mRNA expression of Kat2a, Trfc, and Hmox1 in Kat2a overexpressed or depleted NMVCs (N = 3 independent experiments). L ChIP assay was used to assess the enrichment of H3K27ac, H3K9ac, and Kat2a in Trfc promoter in NMVCs (N = 3 independent experiments). M ChIP assay was used to assess the enrichment of H3K27ac, H3K9ac, and Kat2a in the Hmox1 promoter in NMVCs (N = 3 independent experiments). N Dual luciferase activity assays to analyze the fluorescence intensity of Kat2a-overexpressing and Kat2a-depleted NMVCs with the Trfc or Hmox1 promoter region (N = 3 independent experiments). Significance tested using: Student’s t-test (A, B) and One-way ANOVA (C, EN). Statistical significance is shown as *p < 0.05, **p < 0.01, ***p < 0.001.
Fig. 6
Fig. 6. Kat2a aggravated ferroptosis by enhancing Tfrc and Hmox1 expression.
A The mRNA expression levels of Kat2a, Tfrc, and Hmox1 were assessed in Kat2a-depleted NMVCs with overexpression of either Tfrc or Hmox1 (N = 3 independent experiments). B The cell death of Kat2a-depleted NMVCs with overexpression of either Tfrc or Hmox1 (N = 3 independent experiments). C The level of labile iron in Kat2a-depleted NMVCs with overexpression of either Tfrc or Hmox1 (N = 3 independent experiments). D The level of lipid ROS in Kat2a-depleted NMVCs with overexpression of either Tfrc or Hmox1 (N = 3 independent experiments). E The level of MDA in Kat2a-depleted NMVCs with overexpression of either Tfrc or Hmox1 (N = 3 independent experiments). F, G GSH and GSH/GSSG levels in Kat2a-depleted NMVCs with overexpression of either Tfrc or Hmox1 (N = 3 independent experiments). H The mRNA expression levels of Kat2a, Tfrc, and Hmox1 were assessed in Kat2a-overexpressing NMVCs with knockdown of either Tfrc or Hmox1 (N = 3 independent experiments). I The cell death of Kat2a-overexpressing NMVCs with knockdown of either Tfrc or Hmox1 (N = 3 independent experiments). J The level of labile iron in Kat2a-overexpressing NMVCs with knockdown of either Tfrc or Hmox1 (N = 3 independent experiments). K The level of lipid ROS in Kat2a-overexpressing NMVCs with knockdown of either Tfrc or Hmox1 (N = 3 independent experiments). L The level of MDA in Kat2a-overexpressing NMVCs with knockdown of either Tfrc or Hmox1 (N = 3 independent experiments). M, N GSH and GSH/GSSG levels in Kat2a-overexpressing NMVCs with knockdown of either Tfrc or Hmox1 (N = 3 independent experiments). Significance tested using One-way ANOVA. Statistical significance is shown as *p < 0.05, **p < 0.01, ***p < 0.001.
Fig. 7
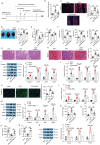
Fig. 7. Kat2a deficiency ameliorated DCM-induced cardiac injury.
A Schematic diagram of animal experiments. B Kat2a mRNA level in cardiac tissues (N = 7 mice/group). C Kat2a protein level in cardiac tissues was assessed by IF staining (N = 7 mice/group). Scale bar = 50 μm. D Representative images of cardiac specimens of each group and the ratio of heart weight to tibia length (HW/TL) were measured (N = 7 mice/group). Scale bar = 5 mm. E Quantitative analysis of LVEF and LVFS (N = 7 mice/group). F Serum CK-MB, LDH, and AST levels in mice (N = 7 mice/group). G Representative images of H&E staining of heart tissues. Scale bar = 50 μm. H Representative images of Masson staining of heart tissues and quantitative analysis of Collagen area (%) of Masson staining (N = 7 mice/group). Scale bar = 50 μm. I Protein levels of fibrosis markers (Collagen 1, α-SMA, Tgf-β1, and Mmp2) in heart tissue were detected by western blotting (N = 7 mice/group). J The mRNA expressions of fibrosis markers in heart tissue were detected by qPCR (N = 7 mice/group). K Representative images of wheat germ agglutinin (WGA) staining of heart tissues and quantitative analysis of cardiomyocytes area (µm2) of WGA staining (N = 7 mice/group). Scale bar = 50 μm. L The mRNA expressions of hypertrophic markers (Rcan1.4, ANP, BNP, and β-MHC) in heart tissue were detected by qPCR (N = 7 mice/group). M Protein levels of hypertrophic markers in heart tissue were detected by western blotting (N = 7 mice/group). NQ The level of labile iron, MDA, GSH, and GSH/GSSG in heart tissues was measured (N = 7 mice/group). R Protein levels of Kat2a, Tfrc, and Hmox1 in heart tissue were detected by western blotting (N = 7 mice/group). Significance tested using One-way ANOVA. Statistical significance is shown as *p < 0.05, **p < 0.01, ***p < 0.001.
Fig. 8
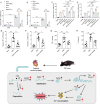
Fig. 8. Kat2a deficiency protected DCM from inflammatory injury by inhibiting ferroptosis.
A, B TNF-α and IL-6 mRNA levels in NMVCs with Kat2a overexpression or Fer-1 treatment under basal or HG conditions (N = 3 independent experiments). C, D TNF-α and IL-6 mRNA levels in NMVCs with Kat2a knockdown along with Tfrc or Hmox1 overexpression (N = 3 independent experiments). E, F TNF-α and IL-6 mRNA levels in cardiac tissues of mice (N = 7 mice/group). G, H TNF-α and IL-6 protein levels in the cardiac tissues of mice were measured by ELISA (N = 7 mice/group). I Graphical summary of the mechanistic study of this study. Significance tested using One-way ANOVA. Statistical significance is shown as *p < 0.05, **p < 0.01, ***p < 0.001.

Similar articles

Cited by

References

    1. Tan Y, Zhang Z, Zheng C, Wintergerst KA, Keller BB, Cai L. Mechanisms of diabetic cardiomyopathy and potential therapeutic strategies: preclinical and clinical evidence. Nat Rev Cardiol. 2020;17:585–607. doi: 10.1038/s41569-020-0339-2. - DOI - PMC - PubMed
    1. Dillmann WH. Diabetic Cardiomyopathy. Circ Res. 2019;124:1160–62. doi: 10.1161/CIRCRESAHA.118.314665. - DOI - PMC - PubMed
    1. Jia G, DeMarco VG, Sowers JR. Insulin resistance and hyperinsulinaemia in diabetic cardiomyopathy. Nat Rev Endocrinol. 2016;12:144–53. doi: 10.1038/nrendo.2015.216. - DOI - PMC - PubMed
    1. Marwick TH, Ritchie R, Shaw JE, Kaye D. Implications of Underlying Mechanisms for the Recognition and Management of Diabetic Cardiomyopathy. J Am Coll Cardiol. 2018;71:339–51. doi: 10.1016/j.jacc.2017.11.019. - DOI - PubMed
    1. Schiano C, Benincasa G, Franzese M, Della Mura N, Pane K, Salvatore M, et al. Epigenetic-sensitive pathways in personalized therapy of major cardiovascular diseases. Pharmacol Ther. 2020;210:107514. doi: 10.1016/j.pharmthera.2020.107514. - DOI - PubMed

MeSH terms