. 2024 Jun 10;15(1):4920.
doi: 10.1038/s41467-024-49342-6.

PR-SET7 epigenetically restrains uterine interferon response and cell death governing proper postnatal stromal development

Affiliations

PR-SET7 epigenetically restrains uterine interferon response and cell death governing proper postnatal stromal development

Haili Bao et al. Nat Commun. .

Abstract

The differentiation of the stroma is a hallmark event during postnatal uterine development. However, the spatiotemporal changes that occur during this process and the underlying regulatory mechanisms remain elusive. Here, we comprehensively delineated the dynamic development of the neonatal uterus at single-cell resolution and characterized two distinct stromal subpopulations, inner and outer stroma. Furthermore, single-cell RNA sequencing revealed that uterine ablation of Pr-set7, the sole methyltransferase catalyzing H4K20me1, led to a reduced proportion of the inner stroma due to massive cell death, thus impeding uterine development. By combining RNA sequencing and epigenetic profiling of H4K20me1, we demonstrated that PR-SET7-H4K20me1 either directly repressed the transcription of interferon stimulated genes or indirectly restricted the interferon response via silencing endogenous retroviruses. Declined H4K20me1 level caused viral mimicry responses and ZBP1-mediated apoptosis and necroptosis in stromal cells. Collectively, our study provides insight into the epigenetic machinery governing postnatal uterine stromal development mediated by PR-SET7.


Conflict of interest statement

The authors declare no competing interests.

Figures
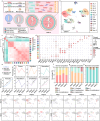
Fig. 1
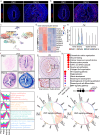
Fig. 1. The dynamic transcriptomic atlas of the postnatal uterus depicted by scRNA-seq.
a Diagram illustrating the dynamic process of postnatal uterine development. b UMAP plot showing cell clusters in the neonatal uterus. c Spearman correlation of transcriptomic profiles of different cell populations. d Bubble plot indicating the expression of marker genes across different cell types. e Line chart showing the proportions of the major cell types at different time points. fh Bar plot showing the stromal (f), epithelial (g), and myometrial (h) subset composition on PND1, PND5, PND10, and PND15. il UMAP visualization indicating the expression of Wnt16 (i), Htra3 (j), Foxa2 (k), and Acta2 (l) at different time points.
Fig. 2
Fig. 2. The descriptions of different stromal subsets in the neonatal uterus.
a, b SCRINSHOT analysis of Wnt16 (a) and Htra3 (b) in the uteri on PND1 and PND15. Dash lines represent the boundary between the epithelium and the stroma, as well as the stroma and the myometrium. Scale bar: 100 μm. c Visualization of RNA velocity analysis. d Heatmap showing the top-ranked regulons in inner stromal cells according to SCENIC analysis. e Violin plot displaying the expression level of Pgr in the inner and outer stroma throughout postnatal uterine development. f LacZ staining showing the expression pattern of Pgr in the uteri on PND1, PND5, PND10, and PND15. Scale bar: 100 μm. g IHC analysis of PR in the uteri on PND15. Dash lines represent the boundary between the stroma and the myometrium. Scale bar: 100 μm. h GO enrichment analysis of the highly expressed genes in the inner and outer stroma. Significance is based on over-representation analysis with clusterProfiler. i Gene expression clustering analysis and GO analysis of inner stromal cells at different time points. j, k CellChat analysis indicating the WNT (j) and BMP (k) signaling pathways among stromal cells and epithelial cells.
Fig. 3
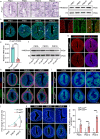
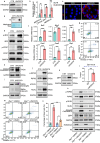
Fig. 3. Uterine-specific ablation of Pr-set7 resulted in hampered stromal growth due to massive cell death.
a ISH analysis of Pr-set7 in the uteri on PND1, PND5, PND10, and PND15. Dash lines represent the boundary between the epithelium and the stroma. LE luminal epithelium, M mesenchyme, S stroma. Scale bar: 100 μm. b IF analysis of H4K20me1 in the uteri on PND1, PND5, PND10, and PND15. LE luminal epithelium, M mesenchyme, S stroma, GE glandular epithelium. Scale bar: 100 μm. c WB analysis of H4K20me1 in the uteri on PND1, PND5, PND10, and PND15. H3 served as a loading control. d Co-staining of H4K20me1 and WT1 in the uterus. LE luminal epithelium, S stroma. Dash lines represent the boundary between the epithelium and the stroma. Scale bar: 100 μm. e QRT-PCR analysis of Pr-set7 mRNA level in Pr-set7f/f (n = 3 mice) and Pr-set7d/d (n = 3 mice) uteri on PND5. The values were normalized to the Gapdh level. Data are presented as mean ± SEM. Two-tailed unpaired Student’s t-test. ***p = 0.0008. f WB analysis of H4K20me1 in Pr-set7f/f and Pr-set7d/d uteri on PND5, PND10 and PND15. H3 was used as a loading control. g IF analysis of H4K20me1 in Pr-set7f/f and Pr-set7d/d uteri on PND5. Scale bar: 100 μm. h IF analysis of VIMENTIN and α-SMA in Pr-set7f/f and Pr-set7d/d uteri on PND5, PND10 and PND15. Scale bar: 100 μm. i IF analysis of PDGFRα in Pr-set7f/f and Pr-set7d/d uteri on PND5, PND10 and PND15. Scale bar: 100 μm. j Fold change of stromal area in Pr-set7f/f (n = 5 mice) and Pr-set7d/d (n = 5 mice) uteri on PND5, PND10, and PND15. Data are presented as mean ± SEM. Two-tailed unpaired Student’s t-test. ***p = 0.0001 (PND10), ***p = 4e-15 (PND15). k TUNEL analysis of the Pr-set7f/f and Pr-set7d/d uteri on PND5, PND10 and PND15. Dash lines represent the boundary between the epithelium and the stroma, as well as the stroma and the myometrium. Scale bar: 100 μm. l Number of TUNEL+ stromal cells per section in the Pr-set7f/f (n = 5 mice) and Pr-set7d/d (n = 5 mice) uteri on PND5, PND10 and PND15. Data are presented as mean ± SEM. Two-tailed unpaired Student’s t-test. ***p = 4e-6 (PND5), ***p = 0.0002 (PND10), ***p = 5e-11 (PND15). Source data are provided as a Source Data file.
Fig. 4
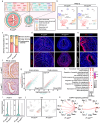
Fig. 4. The deficiency of PR-SET7 led to reduced number and derailed differentiation of inner stromal cells.
a Diagram illustrating uterine heterogeneity in Pr-set7f/f and Pr-set7d/d mice on PND15. b UMAP plot showing cell clusters in Pr-set7f/f and Pr-set7d/d uteri on PND15. c The percentage of stromal subsets in Pr-set7f/f and Pr-set7d/d uteri on PND15. d SCRINSHOT analysis of Wnt16 and Htra3 in the Pr-set7f/f and Pr-set7d/d uteri on PND15. Dash lines represent the boundary between the epithelium and the stroma, as well as the stroma and the myometrium. Scale bar: 100 μm. e IF analysis of PR in Pr-set7f/f and Pr-set7d/d uteri on PND15. Dash lines represent the boundary between the epithelium and the stroma, as well as the stroma and the myometrium. Scale bar: 100 μm. f IHC staining of PR in 4-week-old Pr-set7f/f and Pr-set7d/d uteri. Dash lines represent the boundary between the stroma and the myometrium. Scale bar: 100 μm. g Scatter plot showing the differentially expressed genes in the Pr-set7f/f and Pr-set7d/d inner and outer stroma. h GO functional analysis of the upregulated and downregulated genes in the inner and outer stromal cells due to PR-SET7 loss. Significance is based on over-representation analysis with clusterProfiler. i Violin plot indicating the expressions of Prdm1 and Gli1 in the Pr-set7f/f and Pr-set7d/d inner stroma. j UMAP visualization indicating the expression of Ihh in Pr-set7f/f and Pr-set7d/d uteri. k CellChat analysis showing the ncWNT signaling pathway among different cell clusters in Pr-set7f/f and Pr-set7d/d uteri.
Fig. 5
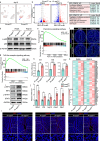
Fig. 5. The uterus experienced overwhelming anti-viral reaction upon Pr-set7 deletion.
a UMAP visualization of Isg15 in the Pr-set7f/f and Pr-set7d/d uteri on PND15. The arrowhead indicates the expression of Isg15 in the inner stroma of the Pr-set7d/d uterus. b Volcano plot indicating the differentially expressed genes in the uteri after Pr-set7 deletion on PND5 and PND10. Significance is based on the negative binomial test with DESeq2. Blue and red dots represent downregulated and upregulated genes, respectively, while genes that were not significantly differentially expressed are shown in gray. c GO functional analysis of the upregulated genes due to PR-SET7 loss. Significance is based on over-representation analysis with clusterProfiler. d WB analysis of p-p65 and t-p65 level in Pr-set7f/f and Pr-set7d/d uteri on PND5 and PND10. β-ACTIN served as a loading control. e GSEA analysis indicating the enrichment of chemokine signaling pathway related genes in the Pr-set7d/d uteri compared with the Pr-set7f/f uteri. Significance is based on functional class scoring with clusterProfiler. NES, normalized enrichment score. f IF analysis of F4/80 in Pr-set7f/f and Pr-set7d/d uteri on PND5 and PND10. Dash lines represent the boundary between the epithelium and the stroma, as well as the stroma and the myometrium. Scale bar: 100 μm. g GSEA analysis assessing the enrichment of toll-like receptor signaling pathway associated genes in the Pr-set7d/d uteri compared with the Pr-set7f/f uteri. Significance is based on functional class scoring with clusterProfiler. NES, normalized enrichment score. h QRT-PCR analysis of Tlr7, Tlr8 and Tlr9 mRNA level in Pr-set7f/f (n = 3 mice) and Pr-set7d/d (n = 3 mice) uteri on PND5. The values were normalized to Gapdh level. Data are presented as mean ± SEM. Two-tailed unpaired Student’s t-test. **p = 0.0063 (Tlr7), ***p = 0.0004 (Tlr8), *p = 0.0421 (Tlr9). i Immunoblotting analysis of p-IRF3, IRF3, p-STAT1 and STAT1 in Pr-set7f/f and Pr-set7d/d uteri. GAPDH was used as a loading control. j QRT-PCR analysis of ISGs in Pr-set7f/f (n = 3 mice) and Pr-set7d/d (n = 3 mice) uteri on PND5. The values were normalized to Gapdh level. Data are presented as mean ± SEM. Two-tailed unpaired Student’s t-test. **p = 0.0085 (Ifitm6), *p = 0.0254 (Irf8), *p = 0.0461 (Isg15), *p = 0.0252 (Oas2), *p = 0.0139 (Zbp1). k Heatmap showing the differentially expressed ISGs between Pr-set7f/f and Pr-set7d/d groups on PND5 and PND10. l SCRINSHOT analysis of Tlr7, Isg15 and Zbp1 in Pr-set7f/f and Pr-set7d/d uteri. Magnified images represent the SCRINSHOT signals in the stromal area. Scale bar: 100 μm. Source data are provided as a Source Data file.
Fig. 6
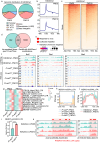
Fig. 6. H4K20me1 repressed the expression of ISGs in both direct and indirect manners.
a Pie chart displaying the genomic distribution of H4K20me1. b Profile plot showing the distribution of normalized H4K20me1 CUT&Tag signals. TSS, transcription start site; TES, transcription end site. c Heatmap indicating the distribution of normalized H4K20me1 CUT&Tag signals. TSS, transcription start site; TES, transcription end site. d Venn diagram showing the upregulated genes upon PR-SET7 loss (n = 1084) and genes with H4K20me1 modifications (n = 10578). e GO enrichment analysis of genes that were directly suppressed by H4K20me1. Significance is based on over-representation analysis with clusterProfiler. f Genome browser view of normalized H4K20me1 CUT&Tag signals as well as Pr-set7f/f and Pr-set7d/d RNA-seq signals on a portion of ISGs that were upregulated upon Pr-set7 ablation and possessed H4K20me1 occupancy. g Heatmap indicating the abnormally upregulated ERVs due to PR-SET7 abrogation on PND5 and PND10. h Profile plot showing Pr-set7f/f and Pr-set7d/d RNA-seq signals on the body region of MER70-int:ERVL:LTR. TSS, transcription start site; TES, transcription end site. i QRT-PCR analysis of MER70-int:ERVL:LTR level in Pr-set7f/f (n = 3 mice) and Pr-set7d/d (n = 3 mice) uteri on PND5. The values were normalized to Gapdh level. Data are presented as mean +/- SEM. Two-tailed unpaired Student’s t-test. ***p = 0.0002. j Profile plot showing normalized H4K20me1 CUT&Tag signals on the body region of MER70-int:ERVL:LTR. TSS, transcription start site; TES, transcription end site. k Genome browser view of normalized H4K20me1 CUT&Tag signals on MER70-int:ERVL:LTR copies. Source data are provided as a Source Data file.
Fig. 7
Fig. 7. Diminished H4K20me1 level led to viral mimicry responses and culminated in ZBP1-mediated apoptosis and necroptosis.
a WB analysis of H4K20me1 level in cultured endometrial stromal cells treated with DMSO (CTR) or UNC0379. GAPDH was used as a loading control. b QRT-PCR analysis of the mRNA level of ERVs in cultured uterine stromal cells treated with DMSO (CTR, n = 3 independent biological replicates) or UNC0379 (n = 3 independent biological replicates). The values were normalized to Gapdh level. Data are presented as mean ± SEM. Two-tailed unpaired Student’s t-test. **p = 0.0064 (MER70-int), ***p = 0.0002 (LTR105_Mam), ***p = 0.0008 (MER68-int). c IF analysis of J2 indicating dsRNA level in cultured endometrial stromal cells treated with DMSO (CTR) or UNC0379. Scale bar: 50 μm. d Dot blotting analysis of dsRNA level in cultured endometrial stromal cells treated with DMSO (CTR) or UNC0379. e Immunoblotting analysis of p-IRF3, IRF3, p-STAT1 and STAT1 in cultured endometrial stromal cells treated with DMSO (CTR) or UNC0379. GAPDH served as a loading control. f QRT-PCR analysis of the mRNA level of ISGs in cultured endometrial stromal cells treated with DMSO (CTR, n = 3 independent biological replicates) or UNC0379 (n = 3 independent biological replicates). The values were normalized to Gapdh level. Data are presented as mean ± SEM. Two-tailed unpaired Student’s t-test. ***p = 6e-5 (Bst2), **p = 0.0074 (Ifitm3), **p = 0.0032 (Isg15), ***p = 0.0001 (Oas2), **p = 0.0029 (Oasl2), **p = 0.0050 (Zbp1). g Annexin V/PI apoptosis analysis of cultured endometrial stromal cells treated with DMSO (CTR) or UNC0379. h–k Immunoblotting analysis of Cleaved CASPASE-3 (h), GSDMD (i), p-RIPK3, RIPK3, p-MLKL and MLKL (j), as well as ZBP1 (k) in cultured endometrial stromal cells treated with DMSO (CTR) or UNC0379. GAPDH served as a loading control. l ChIP-qRT-PCR analysis of H4K20me1 on Zbp1 locus. The data are representative of 3 independent biological replicates. Data are presented as mean ± SEM. Two-tailed unpaired Student’s t-test. ***p = 0.0003. m Annexin V/PI apoptosis analysis of cultured Zbp1+/ stromal cells treated with DMSO or UNC0379 and Zbp1/ stromal cells treated with DMSO or UNC0379. n Percentage of cell death in Zbp1+/ stromal cells treated with DMSO (n = 3 independent biological replicates) or UNC0379 (n = 3 independent biological replicates) and Zbp1/ stromal cells treated with DMSO (n = 3 independent biological replicates) or UNC0379 (n = 3 independent biological replicates). Data are presented as mean ± SEM. Two-tailed unpaired Student’s t-test. ***p = 0.0007, **p = 0.0023, *p = 0.0240. o Immunoblotting analysis of p-RIPK3, RIPK3, p-MLKL, MLKL, Cleaved CASPASE-3, ZBP1 and H4K20me1 in Zbp1+/ stromal cells treated with DMSO or UNC0379 and Zbp1/ stromal cells treated with DMSO or UNC0379. GAPDH and H3 served as loading controls. Source data are provided as a Source Data file.
Fig. 8
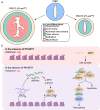
Fig. 8. Schematic diagram illustrating the role of PR-SET7-mediated H4K20me1 in postnatal uterine stromal development.
a Uterine Pr-set7 deletion resulted in impaired inner stromal development after birth. b PR-SET7-mediated H4K20me1 epigenetically restricted exaggerated interferon responses via both direct and indirect manners, protecting stromal cells from ZBP1-mediated apoptosis and necroptosis.

Similar articles

Cited by

References

    1. Kobayashi A, Behringer RR. Developmental genetics of the female reproductive tract in mammals. Nat. Rev. Genet. 2003;4:969–980. doi: 10.1038/nrg1225. - DOI - PubMed
    1. Brody JR, Cunha GR. Histologic, morphometric, and immunocytochemical analysis of myometrial development in rats and mice: I. Normal development. Am. J. Anat. 1989;186:1–20. doi: 10.1002/aja.1001860102. - DOI - PubMed
    1. Gray CA, et al. Developmental biology of uterine glands. Biol. Reprod. 2001;65:1311–1323. doi: 10.1095/biolreprod65.5.1311. - DOI - PubMed
    1. Spencer TE, Hayashi K, Hu J, Carpenter KD. Comparative developmental biology of the mammalian uterus. Curr. Top. Dev. Biol. 2005;68:85–122. doi: 10.1016/S0070-2153(05)68004-0. - DOI - PubMed
    1. Bellessort B, et al. Dlx5 and Dlx6 control uterine adenogenesis during post-natal maturation: possible consequences for endometriosis. Hum. Mol. Genet. 2016;25:97–108. doi: 10.1093/hmg/ddv452. - DOI - PubMed

MeSH terms