. 2024 Jun 10;15(6):404.
doi: 10.1038/s41419-024-06797-1.

The miR-30-5p/TIA-1 axis directs cellular senescence by regulating mitochondrial dynamics

Affiliations

The miR-30-5p/TIA-1 axis directs cellular senescence by regulating mitochondrial dynamics

Hyosun Tak et al. Cell Death Dis. .

Abstract

Senescent cells exhibit a diverse spectrum of changes in their morphology, proliferative capacity, senescence-associated secretory phenotype (SASP) production, and mitochondrial homeostasis. These cells often manifest with elongated mitochondria, a hallmark of cellular senescence. However, the precise regulatory mechanisms orchestrating this phenomenon remain predominantly unexplored. In this study, we provide compelling evidence for decreases in TIA-1, a pivotal regulator of mitochondrial dynamics, in models of both replicative senescence and ionizing radiation (IR)-induced senescence. The downregulation of TIA-1 was determined to trigger mitochondrial elongation and enhance the expression of senescence-associated β-galactosidase, a marker of cellular senescence, in human foreskin fibroblast HS27 cells and human keratinocyte HaCaT cells. Conversely, the overexpression of TIA-1 mitigated IR-induced cellular senescence. Notably, we identified the miR-30-5p family as a novel factor regulating TIA-1 expression. Augmented expression of the miR-30-5p family was responsible for driving mitochondrial elongation and promoting cellular senescence in response to IR. Taken together, our findings underscore the significance of the miR-30-5p/TIA-1 axis in governing mitochondrial dynamics and cellular senescence.


Conflict of interest statement

The authors declare no competing interests.

Figures
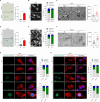
Fig. 1
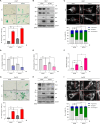
Fig. 1. Enhanced mitochondrial elongation in senescent cells.
A SA β-gal analysis of young (PDL21) and senescent (PDL31) HS27 human skin fibroblasts. B, C Mitochondrial morphology in young and senescent HS27 cells. D SA β-gal analysis of HaCaT human keratinocytes with or without IR exposure (6 Gy, 72 h). E, F Mitochondrial morphology in HaCaT cells. For SA β-gal analysis, cells were incubated with a staining solution (pH 6.0), and the number of SA β-gal-positive cells was counted. Mitochondrial morphology was assessed by staining with MitoTracker (100 nM) and transmission electron microscopy. The number of cells with fragmented, elongated, or intermediated mitochondria was analyzed using Image J software. Quantitation of the mitochondrial perimeter was calculated from more than 25 mitochondria in each experimental group using Image J software. G, H Immunofluorescence microscopy of HS27 and HaCaT cells co-stained with γH2AX, p16INK4a, and MitoTracker with or without IR exposure (6 Gy, 72 h). Images are representative, and data are presented as the mean ± SEM of three independent analyses. Scale bar, 20 μm (A, B, D, E, G, H) and 0.5 μm (C, F). ***p < 0.001.
Fig. 2
Fig. 2. Downregulation of TIA-1 expression during cellular senescence.
A Relative levels of TIA-1 mRNA in several Gene Expression Omnibus (GEO) datasets (GSE38718, GSE181022, and GSE58915). B, C TIA-1 mRNA and protein levels in HS27 cells at various PDLs. D, E TIA-1 mRNA and protein levels in HaCaT cells with or without IR exposure. TIA-1 mRNA was analyzed by RT-qPCR. GAPDH mRNA was used as a reference gene for normalization. Protein expression was determined by Western blotting (WB) and quantified by densitometric analysis using Image J software. β-actin was used as the loading control. F, G Immunofluorescence microscopy of HS27 and HaCaT cells co-stained with γH2AX, p16INK4a, and TIA-1 with or without IR exposure (6 Gy, 72 h). Fluorescent signals against of TIA-1 in each experimental group were analyzed using Image J software and normalized with cell numbers. Images are representative, and the data are presented as the mean ± SEM of two (B, C) or three (DG) independent analyses. Scale bar, 20 μm. **p < 0.01, ***p < 0.001.
Fig. 3
Fig. 3. TIA-1 knockdown enhances IR-induced senescence and mitochondrial dysfunction.
SA β-gal analysis (A), protein expression (B), mitochondrial morphology (C), and mitochondrial function (DF) in HS27 cells. SA β-gal analysis (G), protein expression (H), and mitochondrial morphology (I) in HaCaT cells. Cells were transfected with siRNAs (siCtrl or siTIA-1) and exposed to IR (6 Gy, 72 h). For SA β-gal analysis (A, G), cells were incubated with a staining solution (pH 6.0), and the number of SA β-gal-positive cells was counted. Relative protein expression was determined by WB analysis (B, H). β-actin was used as a loading control for WB. Mitochondrial morphology stained with MitoTracker (100 nM) was analyzed using analyzed Image J software (C, I). Mitochondrial functionality was assessed by measuring mitochondrial membrane potential (Δψm, JC-1 staining) (D), ATP level (Mitochondrial ToxGlo™) (E), and ROS generation (MitoSOX™) (F) in HS27 cells following IR exposure and transfection, according to the manufacturer’s instruction. Images are representative, and the data are presented as the mean ± SEM of three independent analyses. Scale bar, 20 μm. *p < 0.05, **p < 0.01, ***p < 0.001.
Fig. 4
Fig. 4. TIA-1 overexpression attenuates IR-induced senescence and mitochondrial dysfunction.
SA β-gal (A), protein analysis (B), mitochondrial morphology (C), and mitochondrial function (DF) in HS27 cells. SA β-gal (G), protein analysis (H), and mitochondrial morphology (I) in HaCaT cells. Cells were transfected with plasmids (pCtrl or pTIA-1) and exposed to IR (6 Gy, 72 h). For SA β-gal analysis (A, G), cells were incubated with a staining solution (pH 6.0), and the number of SA β-gal-positive cells was counted. Relative protein expression was determined by WB analysis (B, H). β-actin was used as a loading control for WB. Mitochondrial morphology stained with MitoTracker (100 nM) was analyzed using Image J software (C, I). Mitochondrial functionality was assessed by measuring mitochondrial membrane potential (Δψm, JC-1 staining) (D), ATP level (Mitochondrial ToxGlo™) (E), and ROS generation (MitoSOX™) (F) in HS27 cells following IR exposure and transfection, according to the manufacturer’s instruction. Images are representative, and the data are presented as the mean ± SEM of three independent analyses. Scale bar, 20 μm. n.s not significant (p > 0.05), *p < 0.05, **p < 0.01, ***p < 0.001.
Fig. 5
Fig. 5. The miR-30-5p family is responsible for the downregulation of TIA-1.
A Identification of the miR-30-5p family as a putative regulator of TIA-1 expression. In silico prediction with TargetScan (https://www.targetscan.org/vert_80/) and comparative analysis using senescence GSE datasets (GSE14912, GSE22134, GSE48662, and GSE90942) identified the miR-30-5p family. B MiR-30-5p family levels in young and senescent HS27 cells. C MiR-30-5p family levels in HaCaT cells with or without IR exposure (6 Gy, 72 h). Relative levels of each miRNA were determined by RT-qPCR analysis. U6 snRNA was used as the reference gene for normalization. D TIA-1 protein levels were assessed by WB analysis after transfection with miRNAs (48 h). E A schematic diagram of miR-30-5p binding sites on the TIA-1 mRNA 3′UTR. Each identical binding site is represented as a colored rectangle. F, G WB analysis. HS27 cells were transfected with miRNAs (miCtrl, precursor of miR-30-5p, and anti-miR-30-5p) and exposed to IR (6 Gy) (E). HEK293T cells were sequentially transfected with miRNAs and EGFP reporter plasmids (pEGFP-C1, pEGFP-TIA-3U, and pEGFP-TIA-1-3UM) (G). Relative protein levels of each sample were determined by WB analysis. β-actin was used as the loading control for WB. Images are representative, and the data are presented as the mean ± SEM of two (for B) or three independent analyses. n.s not significant (p > 0.05), *p < 0.05.
Fig. 6
Fig. 6. The miR-30-5p/TIA-1/MFF axis regulates cellular senescence and mitochondrial elongation.
A, B SA β-gal analysis and mitochondrial morphology in HS27 cells transfected with miRNAs (miCtrl, precursor of miR-30-5p, and anti-miR-30-5p). After transfection, the cells were exposed to IR (6 Gy, 72 h). C, D SA β-gal analysis and mitochondrial morphology in HS27 cells sequentially transfected with miRNAs (miCtrl and precursor of miR-30-5p) and plasmids (pCtrl and pTIA-1). E, F SA β-gal analysis and mitochondrial morphology in HaCaT cells sequentially transfected with siRNAs (siCtrl and siTIA-1) and plasmids (pCtrl and pMFF). For SA β-gal analysis, cells were incubated with a staining solution (pH 6.0), and the number of SA β-gal-positive cells was counted. Mitochondrial morphology stained with MitoTracker (100 nM) was analyzed using Image J software. Images are representative, and the data are presented as the mean ± SEM of three independent analyses. Scale bar, 20 μm. *p < 0.05, **p < 0.01, ***p < 0.001.

Similar articles

Cited by

References

    1. Collado M, Blasco MA, Serrano M. Cellular senescence in cancer and aging. Cell. 2007;130:223–33. doi: 10.1016/j.cell.2007.07.003. - DOI - PubMed
    1. Kuilman T, Michaloglou C, Mooi WJ, Peeper DS. The essence of senescence. Genes Dev. 2010;24:2463–79. doi: 10.1101/gad.1971610. - DOI - PMC - PubMed
    1. Salama R, Sadaie M, Hoare M, Narita M. Cellular senescence and its effector programs. Genes Dev. 2014;28:99–114. doi: 10.1101/gad.235184.113. - DOI - PMC - PubMed
    1. Spinelli R, Baboota RK, Gogg S, Beguinot F, Bluher M, Nerstedt A, et al. Increased cell senescence in human metabolic disorders. J Clin Investig. 2023;133:e169922. doi: 10.1172/JCI169922. - DOI - PMC - PubMed
    1. McHugh D, Gil J. Senescence and aging: causes, consequences, and therapeutic avenues. J Cell Biol. 2018;217:65–77. doi: 10.1083/jcb.201708092. - DOI - PMC - PubMed

Publication types

MeSH terms