. 2024 Jun 10;15(1):4293.
doi: 10.1038/s41467-024-48513-9.

Design of a water-soluble transmembrane receptor kinase with intact molecular function by QTY code

Affiliations

Design of a water-soluble transmembrane receptor kinase with intact molecular function by QTY code

Mengke Li et al. Nat Commun. .

Abstract

Membrane proteins are critical to biological processes and central to life sciences and modern medicine. However, membrane proteins are notoriously challenging to study, mainly owing to difficulties dictated by their highly hydrophobic nature. Previously, we reported QTY code, which is a simple method for designing water-soluble membrane proteins. Here, we apply QTY code to a transmembrane receptor, histidine kinase CpxA, to render it completely water-soluble. The designed CpxAQTY exhibits expected biophysical properties and highly preserved native molecular function, including the activities of (i) autokinase, (ii) phosphotransferase, (iii) phosphatase, and (iv) signaling receptor, involving a water-solubilized transmembrane domain. We probe the principles underlying the balance of structural stability and activity in the water-solubilized transmembrane domain. Computational approaches suggest that an extensive and dynamic hydrogen-bond network introduced by QTY code and its flexibility may play an important role. Our successful functional preservation further substantiates the robustness and comprehensiveness of QTY code.


Conflict of interest statement

S.Z. is a member of board director of 511 Therapeutics that generates therapeutic monoclonal antibodies against solute carrier transporters. He is also a scientific advisor for OH2 Laboratories that works on generating therapeutic monoclonal antibodies against GPCRs. However, this study does not involve in GPCRs and solute carrier transporters. OH2 Laboratories licensed the QTY code technology from MIT. However, this article does not study GPCRs. S.Z. is the inventor of the QTY code and has a minor equity of OH2 Laboratories and majority equity in 511 Therapeutics shares that works on solute carrier transporters. S.Z. is also a scientific advisor for 3DMatrix Co Ltd, that commercializes self-assembling peptide hydrogels for surgical and accelerated wound-healing applications. MIT filed several patent applications for the QTY code for GPCRs and glucose transporters. The current study does not involve in GPCRs and glucose transporters. S.Z. is a co-founder and board director of Molecular Frontiers Foundation that encourages young people to ask good questions about science and nature and also organizes Molecular Frontiers Symposia around the world. There is no compensation for the activities. The remaining authors declare no competing interests.

Figures

Fig. 1
Fig. 1. QTY design of CpxA.
a Schematic diagram of QTY code. Crystallographic 1.5 Å electron density maps of Leucine(L), Asparagine (N), Glutamine (Q), Isoleucine (I), Valine (V), Threonine (T), Phenylalanine (F), and Tyrosine (Y) and their corresponding relationship defined by QTY code are shown. b Overall architecture of CpxA and comparison between the transmembrane sequences of CpxA and CpxAQTY. Residue numbering is shown on the top of the sequences. The target hydrophobic residues are in orange and the polar residues introduced by QTY design are in blue. TM1/2, the first/second transmembrane helix. c Structural view of comparison between the transmembrane regions before (left) and after (right) QTY design. The structure models are from AlphaFold2 prediction. Only residues targeted by QTY design of one protomer are shown in ball-and-stick and transparent spheres, in yellow for CpxA and in cyan for CpxAQTY.
Fig. 2
Fig. 2. Purification and biophysical characterizations of CpxAQTY.
a Sodium dodecyl-sulfate polyacrylamide gel electrophoresis (SDS–PAGE) image of purification of CpxAQTY. Lane M, molecular weight markers; lane 1/2/3, the fractions of IMAC washed/eluted off by 50/80/300 mM imidazole, 25 mM Tris-HCl, 300 mM NaCl, 5% glycerol, pH = 8.0; lane 4, the collected fraction corresponding to the major peak of gel filtration, in 25 mM Tris-HCl, 150 mM NaCl, 50 mM arginine, 5% glycerol, pH = 7.5. The experiment was repeated three times independently with similar results and the representative result was shown. b Sedimentation velocity AUC data of CpxAQTY. The fitted continuous c(s) distribution curve was shown. E, experimental; D, designed. c Thermostability of CpxAQTY measured by nanoDSF. Technical triplicates of CpxAQTY (red lines) were assayed and the fitted Tm values were indicated by red dashed lines. The control group (green lines) was set as only buffer, no proteins added. d Circular dichroism (CD) results of CpxAQTY. CD spectra (Total, purple solid line) and its α-helix (red) and β-sheet (blue) component spectra. The secondary structure analysis was performed using JASCO multivariate secondary structure (SS) estimation program. The content of α-helix and β-sheet in the AlphaFold2 (AF2) model were determined using PyMOL. Source data are provided as a Source Data file.
Fig. 3
Fig. 3. Functional characterization of CpxAQTY.
a Schematic diagram showing the activities of CpxAQTY (left). Phosphotransferase activity and phosphatase activity involve CpxR (right). The predicted structure of CpxAQTY by AlphaFold2 was shown. The transmembrane region was shown in cyan. Only the receiver domain of CpxR was shown. b Time-course of CpxAQTY autophosphorylation. CpxAQTY (1 μM) were phosphorylated with 1 mM ATP at room temperature (RT). c CpxAQTY has phosphotransferase activity. After the autophosphorylation of 1 μM CpxAQTY with 40 μM [γ−32P]-ATP (1.2 Ci/mmol) for 30 min, 4 μM CpxR was added to initiate the phosphotransfer. “0 + ” means that the sample was taken after the addition of CpxR at t = 0. d CpxAQTY has phosphatase activity, shown by Phos-tag SDS-PAGE. CpxR was phosphorylated by acetyl phosphate (AP) for 40 min, and then AP was removed by desalting. The dephosphorylation was initiated by adding CpxAQTY (1:10 molar ratio)/equivalent buffer and 1 mM ADP. Phosphorylated CpxR (CpxR~P) moved slower than unphosphorylated one. For (bd), each experiment was repeated three times independently with similar results, and the representative result was shown. Source data are provided as a Source Data file.
Fig. 4
Fig. 4. Signal-sensing activities of CpxAQTY.
a CpxAQTY can sense pH variation. CpxAQTY (1 μM) or CpxAc (1 μM) were phosphorylated with 1 mM ATP at RT for 2 min, with indicated pH. The phosphorylation level at pH 8.5 was set as 100% for normalization. b CpxAQTY can sense CpxP. CpxAQTY (1 μM) or CpxAc (1 μM) were phosphorylated with 1 mM ATP at RT for 2 min, with different concentrations of CpxP. The phosphorylation level with no CpxP addition was set as 100% for normalization. c CpxAQTY can sense K+. CpxAQTY (1 μM) or CpxAc (1 μM) were phosphorylated with 1 mM ATP at RT for 2 min, with different concentration of K+. The phosphorylation level with 200 mM KCl was set as 100% for normalization. For all three experiments, representative anti-pHis western blot results were shown (left). The quantified phosphorylation level of the three independent experiments was shown (right). Data are shown as mean ± SEM. Source data are provided as a Source Data file.
Fig. 5
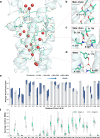
Fig. 5. MD simulations of CpxAQTY identified an extensive and dynamic hydrogen-bond network stabilizing the transmembrane domain.
a The H-bond network inside the transmembrane helical bundle. The backbone is shown as transparent cartoon, the polar side chains and heavy atoms that are engaged in H-bond formation are shown as sticks and water molecules are shown as spheres. Hydrogen atoms are hidden for simplicity. Some representative H-bonds formed with main chains (b), side chains (c) and water (d). Yellow dashed lines indicate H-bonds. “B: T171” indicates T171 in Chain B. The unit of the labeled distance is Å. For the coloring of the elements, carbon atoms are in green, oxygen in red, nitrogen in blue and hydrogen in white. The snapshots were from the 90-ns simulation frame, classified into the largest structure cluster. e Average H-bond formation of QTY side chains in the simulation. “Average H-bond saturation” was defined as the average H-bond number divided by the theoretical maximum H-bond number (Nmax). For Q, Nmax = 4; T/Y, Nmax = 3. The stacking columns indicate the proportions of the H-bonds with different levels of stability. The stability of H-bonds is classified into four levels according to the occupancy: 0–10% (in light gray), 10%–30% (in gray), 30–50% (in blue) and 50–100% (in deep blue). For each residue, the H-bond number is the sum of the occupancy of the H-bonds. The left columns denote the residues in Chain A, and right denote Chain B. f Average relative solvent-accessible surface area (SASA) of QTY side chains in the simulation, indicating how exposed or buried the individual residue is. Gray dashed lines are used to link the relative SASA values to the Average H-bond saturation values of the same residues. Lower and upper box boundaries 25th and 75th percentiles, respectively; line inside box indicates median, lower and upper error lines 10th and 90th percentiles, respectively; “X” indicates the mean. The outliers are not shown for simplicity, considering the large sample size (n = 1001). The detailed data underlying (e, f) and a version of (f) with outliers shown are available in Source data. Source data are provided as a Source Data file.
Fig. 6
Fig. 6. PBMetaD simulation of CpxAQTY identified a common pattern of conformational changes in SHK transmembrane signaling.
a Schematic diagram of collective variable (CV) definition. The TM1 (blue) and TM2 (orange) helices were shown as simple cylinders. The center of mass of the helices were shown as black dots. The CVs, i.e., D1 and D2 were indicated by the dashed lines. b The curves of the CVs with simulation time. The patterns of the CV variation were classified into three states, separated by gray dashed lines. c The conformational transition of the different states of the transmembrane domain. (Left) Top view of the conformations of State-1 (cyan), State-M (transparent gray), and State-2 (red), as viewed from the periplasm looking into the cytoplasm. (Right) Schematic diagram of the conformational transition from State-1 to State-2. The movement is typical diagonal scissoring, which means two opposing helices move inward and concomitantly the other two opposing helices move outward. The helices were simplified as the circles. “TM1” indicates TM1 helix in Chain A and “TM1’” indicates TM1 helix in Chain B. d Snapshots of the top layer of the interhelical H-bond network of State-1 (left) and State-2 (right). The display style is the same as Fig. 5a. The structural snapshots of c and d were from the medoid frames of the clusters, corresponding to Supplementary Fig. 6c. Source data are provided as a Source Data file.
Fig. 7
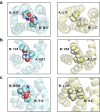
Fig. 7. Interactions of polar residues in CpxAQTY mimicked the packing of the original hydrophobic residues in CpxA, revealed by MD simulations.
a (Left) Q17 in Chain A and Q17 in Chain B of CpxAQTY. (Right) L17 in Chain A and L17 in Chain B of CpxA. b (Left) Q21 in Chain A and T24 in Chain B of CpxAQTY. (Right) L21 in Chain A and V24 in Chain B of CpxA. c (Left) T12 in Chain B and Q182 in Chain B of CpxAQTY. (Right) I12 in Chain B and L182 in Chain B of CpxA. Transmembrane regions are shown as cyan cartoon in CpxAQTY simulation (left) and yellow cartoon in CpxA (right). Highlighted residues are shown as spheres. The structural snapshots were from the simulation medoid frames.

Similar articles

Cited by

References

    1. Qing R, et al. Protein design: from the aspect of water solubility and stability. Chem. Rev. 2022;122:14085–14179. doi: 10.1021/acs.chemrev.1c00757. - DOI - PMC - PubMed
    1. Slovic AM, Kono H, Lear JD, Saven JG, DeGrado WF. Computational design of water-soluble analogues of the potassium channel KcsA. Proc. Natl Acad. Sci. USA. 2004;101:1828–1833. doi: 10.1073/pnas.0306417101. - DOI - PMC - PubMed
    1. Krogh A, Larsson B, von Heijne G, Sonnhammer EL. Predicting transmembrane protein topology with a hidden Markov model: application to complete genomes. J. Mol. Biol. 2001;305:567–580. doi: 10.1006/jmbi.2000.4315. - DOI - PubMed
    1. Tao F, Tang H, Zhang S, Li M, Xu P. Enabling QTY server for designing water-soluble alpha-helical transmembrane proteins. mBio. 2022;13:e03604–e03621. doi: 10.1128/mbio.03604-21. - DOI - PMC - PubMed
    1. Mitra K, Steitz TA, Engelman DM. Rational design of ‘water-soluble’ bacteriorhodopsin variants. Protein Eng. 2002;15:485–492. doi: 10.1093/protein/15.6.485. - DOI - PubMed