

Assessing elevated pressure impact on photoelectrochemical water splitting via multiphysics modeling
- PMID: 38858377
- PMCID: PMC11164907
- DOI: 10.1038/s41467-024-49273-2
Assessing elevated pressure impact on photoelectrochemical water splitting via multiphysics modeling
Abstract
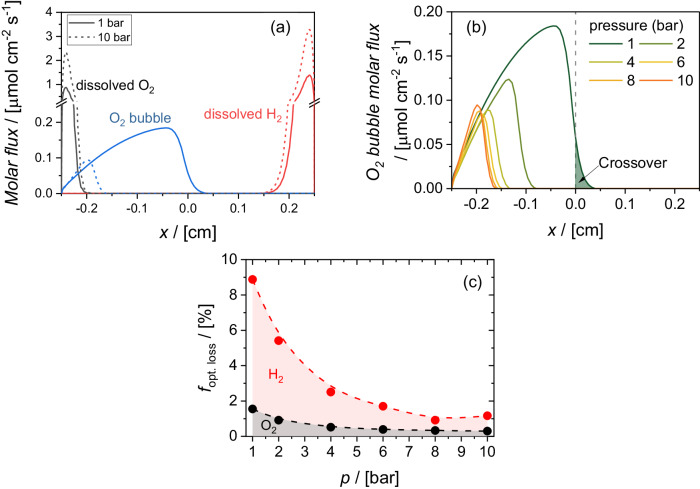
Photoelectrochemical (PEC) water splitting is a promising approach for sustainable hydrogen production. Previous studies have focused on devices operated at atmospheric pressure, although most applications require hydrogen delivered at elevated pressure. Here, we address this critical gap by investigating the implications of operating PEC water splitting directly at elevated pressure. We evaluate the benefits and penalties associated with elevated pressure operation by developing a multiphysics model that incorporates empirical data and direct experimental observations. Our analysis reveals that the operating pressure influences bubble characteristics, product gas crossover, bubble-induced optical losses, and concentration overpotential, which are crucial for the overall device performance. We identify an optimum pressure range of 6-8 bar for minimizing losses and achieving efficient PEC water splitting. This finding provides valuable insights for the design and practical implementation of PEC water splitting devices, and the approach can be extended to other gas-producing (photo)electrochemical systems. Overall, our study demonstrates the importance of elevated pressure in PEC water splitting, enhancing the efficiency and applicability of green hydrogen generation.
© 2024. The Author(s).
Conflict of interest statement
The authors declare no competing interests.
Figures


Similar articles
-
Piezoelectric Materials and Pyroelectric Materials:High Efficient Catalysts for Photoelectrochemical Water Splitting.Chemphyschem. 2024 Sep 2;25(17):e202400227. doi: 10.1002/cphc.202400227. Epub 2024 Jul 10. Chemphyschem. 2024. PMID: 38808500
-
Photoelectrochemical Water Splitting Reaction System Based on Metal-Organic Halide Perovskites.Materials (Basel). 2020 Jan 3;13(1):210. doi: 10.3390/ma13010210. Materials (Basel). 2020. PMID: 31947866 Free PMC article. Review.
-
Perovskite Oxide Based Electrodes for High-Performance Photoelectrochemical Water Splitting.Angew Chem Int Ed Engl. 2020 Jan 2;59(1):136-152. doi: 10.1002/anie.201900292. Epub 2019 Aug 7. Angew Chem Int Ed Engl. 2020. PMID: 30790407 Review.
-
Transition-Metal-Based Electrocatalysts as Cocatalysts for Photoelectrochemical Water Splitting: A Mini Review.Small. 2018 Jun;14(23):e1704179. doi: 10.1002/smll.201704179. Epub 2018 Mar 25. Small. 2018. PMID: 29575653 Review.
-
Organometal Halide Perovskite-Based Photoelectrochemical Module Systems for Scalable Unassisted Solar Water Splitting.Adv Sci (Weinh). 2023 Nov;10(33):e2303106. doi: 10.1002/advs.202303106. Epub 2023 Sep 26. Adv Sci (Weinh). 2023. PMID: 37752753 Free PMC article.
Cited by
-
Neutral buffered electrolytes guarantee ideal band-edge pinning for semiconductor photoanodes.Chem Sci. 2025 Jul 10;16(31):14088-14097. doi: 10.1039/d5sc01816a. eCollection 2025 Aug 6. Chem Sci. 2025. PMID: 40666200 Free PMC article.
References
-
- Würfel, P. & Würfel, U. Physics of Solar Cells: From Basic Principles to Advanced Concepts. (John Wiley & Sons, 2016).
-
- Tembhurne S, Nandjou F, Haussener S. A thermally synergistic photo-electrochemical hydrogen generator operating under concentrated solar irradiation. Nat. Energy. 2019;4:399–407. doi: 10.1038/s41560-019-0373-7. - DOI
-
- Tembhurne S, Haussener S. Integrated photo-electrochemical solar fuel generators under concentrated irradiation. J. Electrochem. Soc. 2016;163:H988. doi: 10.1149/2.0311610jes. - DOI
-
- Tembhurne S, Haussener S. Integrated photo-electrochemical solar fuel generators under concentrated irradiation I. 2-D non-isothermal multi-physics. Modeling. J. Electrochem. Soc. 2016;163:H988–H998. doi: 10.1149/2.0311610jes. - DOI
-
- Tembhurne SY, Haussener S. Integrated photo-electrochemical solar fuel generators under concentrated irradiation-part I: 2-D non-isothermal multiphysics modelling. J. Electrochem. Soc. 2016;163:H988–H998. doi: 10.1149/2.0311610jes. - DOI
Grants and funding
LinkOut - more resources
Full Text Sources
Miscellaneous
