Meta-Analysis
. 2024 Jun 10;14(1):250.
doi: 10.1038/s41398-024-02958-0.

Hippocampal transcriptome-wide association study and pathway analysis of mitochondrial solute carriers in Alzheimer's disease

Affiliations
Meta-Analysis

Hippocampal transcriptome-wide association study and pathway analysis of mitochondrial solute carriers in Alzheimer's disease

Jing Tian et al. Transl Psychiatry. .

Abstract

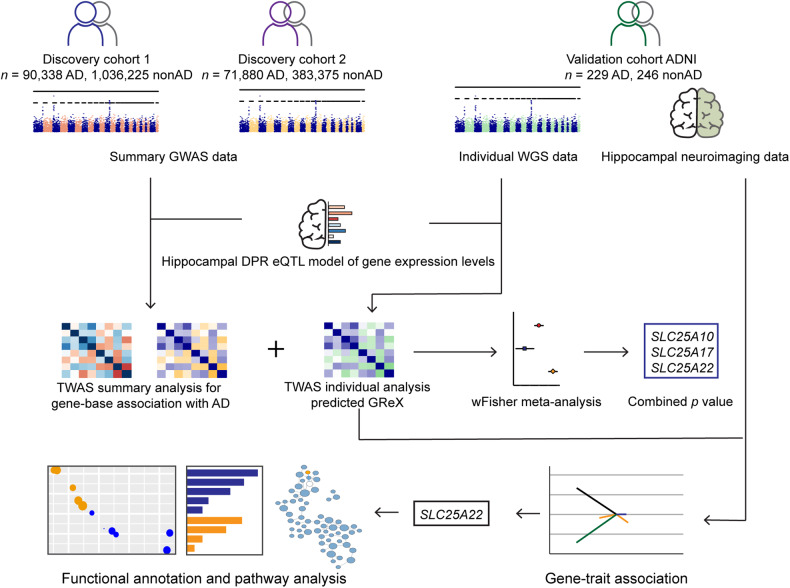
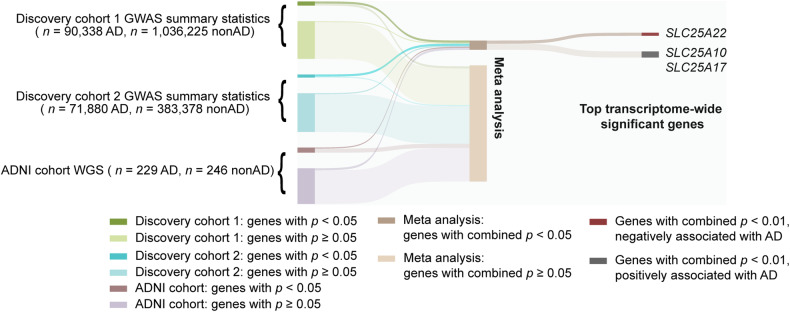
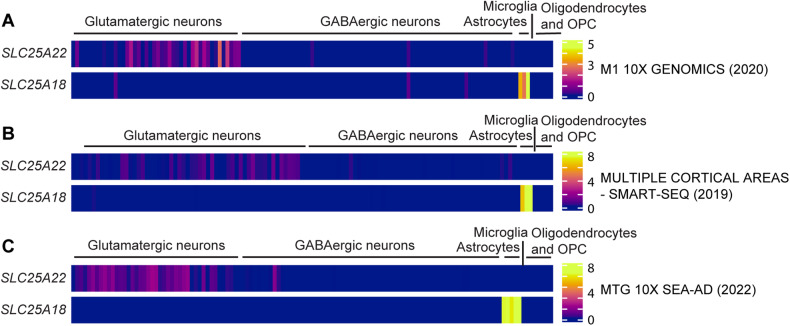
The etiopathogenesis of late-onset Alzheimer's disease (AD) is increasingly recognized as the result of the combination of the aging process, toxic proteins, brain dysmetabolism, and genetic risks. Although the role of mitochondrial dysfunction in the pathogenesis of AD has been well-appreciated, the interaction between mitochondrial function and genetic variability in promoting dementia is still poorly understood. In this study, by tissue-specific transcriptome-wide association study (TWAS) and further meta-analysis, we examined the genetic association between mitochondrial solute carrier family (SLC25) genes and AD in three independent cohorts and identified three AD-susceptibility genes, including SLC25A10, SLC25A17, and SLC25A22. Integrative analysis using neuroimaging data and hippocampal TWAS-predicted gene expression of the three susceptibility genes showed an inverse correlation of SLC25A22 with hippocampal atrophy rate in AD patients, which outweighed the impacts of sex, age, and apolipoprotein E4 (ApoE4). Furthermore, SLC25A22 downregulation demonstrated an association with AD onset, as compared with the other two transcriptome-wide significant genes. Pathway and network analysis related hippocampal SLC25A22 downregulation to defects in neuronal function and development, echoing the enrichment of SLC25A22 expression in human glutamatergic neurons. The most parsimonious interpretation of the results is that we have identified AD-susceptibility genes in the SLC25 family through the prediction of hippocampal gene expression. Moreover, our findings mechanistically yield insight into the mitochondrial cascade hypothesis of AD and pave the way for the future development of diagnostic tools for the early prevention of AD from a perspective of precision medicine by targeting the mitochondria-related genes.


Conflict of interest statement

The authors declare no competing interests.

Figures

Fig. 1
Fig. 1. Schematic graph of the study design.
GWAS: genome-wide association studies, WGS whole genome sequencing, ADNI the Alzheimer’s Disease Neuroimaging Initiative, eQTL expression quantitative trait loci, DPR Dirichlet process regression. GReX genetically regulated gene expression. wFisher weight Fisher method.
Fig. 2
Fig. 2. Flowchart of the meta-analysis.
Each cohort is grouped based on the gene p value at a threshold of 0.05. Discovery cohort 1, n = 90,338 AD cases, n = 1,036,225 nonAD controls; discovery cohort 2, n = 71,880 AD cases, n = 383,378 nonAD controls; ADNI cohort, n = 229 AD cases, n = 246 nonAD controls. Genes including SLC25A10, SLC25A17, and SLC25A22 with a combined p value less than 0.01 via meta-analysis were selected for phenotype association study.
Fig. 3
Fig. 3. Analysis of the relationship between hippocampal SLC25A22 genetic regulation and hippocampal atrophy rate.
A Comparison of hippocampal atrophy rate between SLC25A22 down- and up-regulated subjects in the AD and nonAD combined cohort. Two-tail student t-test. SLC25A22 downregulated n = 38, SLC25A22 upregulated n = 222. * p < 0.05, ** p < 0.01. Data is represented as mean ± 95% CI. B Weighted least square regression (WLSR) analysis for the correlation between hippocampal atrophy rate and the effect size of SLC25A22 genetic regulation. SLC25A22 downregulated n = 38, SLC25A22 upregulated n = 222. * p < 0.05, ** p < 0.01. C Comparison of hippocampal atrophy rate between SLC25A22 down-and up-regulated subjects in AD patients. Two-tail student t-test. SLC25A22 downregulated n = 17, SLC25A22 upregulated n = 79. * p < 0.05. Data is represented as mean ± 95% CI. DF Partial least square regression (PLSR) analysis in the AD cohort. The annualized hippocampal atrophy rate was set as the dependent variable. SLC25A22, age, sex, and ApoE4 status were input as covariables in the analysis. D Variable importance in the projection (VIP) of SLC25A22, age, sex, and ApoE4. E, F GGraphics of latent factors 1 and 3 (E) as well as 2 and 3 (F).
Fig. 4
Fig. 4. Association of susceptibility SLC25 genes with the risk of AD.
Cox proportional hazards regression models for the association of dementia onset with genetic regulation of hippocampal SLC25A22 (A), SLC25A10 (B), and SLC25A17 (C) within the follow-up period of up to ten years. Sex, ApoE4 status, and age were included as covariates in multivariable Cox regression. * p < 0.05. A total of 124 subjects were included for the analysis. HR: hazard ratio.
Fig. 5
Fig. 5. Pathway and network analysis of transcriptomic architecture in SLC25A22 down- and up-regulated subjects.
A Regulation of hippocampal genes in SLC25A22 down- and up-regulated subjects. B Genes with reverse z score directions in SLC25A22 down- and up-regulated subjects. C, D Canonical pathway analysis of genes in SLC25A22 downregulated C and upregulated D subjects. E Comparison analysis of genes with opposite z score directions between SLC25A22 down- and up-regulated subjects. F Hippocampal network analysis of genes with opposite z score directions between SLC25A22 down- and up-regulated subjects in cohesive gene clusters. M1: double-strand DNA stability, M2: developmental growth, M3: lipid metabolism and inflammation, M4: cytosolic transport, M5: regulation of transporter activity.
Fig. 6
Fig. 6. Cell-type enrichment of SLC25A22 mRNA in human brains.
AC Heatmaps of SLC25A22 and SLC25A18 expression in different brain cell types of single cell sequencing data from A M1 10X GENOMICS (2020), B MULTIPLE CORTICAL AREAS-SMART-SEQ (2019), C MTG 10X Seattle Alzheimer’s Disease Brain Cell Atlas (SEA-AD) (2022). OPC: Oligodendrocyte progenitor cell.

References

    1. Querfurth HW, LaFerla FM. Alzheimer’s disease. N Engl J Med. 2010;362:329–44. doi: 10.1056/NEJMra0909142. - DOI - PubMed
    1. Henneman WJ, Sluimer JD, Barnes J, van der Flier WM, Sluimer IC, Fox NC, et al. Hippocampal atrophy rates in Alzheimer disease: added value over whole brain volume measures. Neurology. 2009;72:999–1007. doi: 10.1212/01.wnl.0000344568.09360.31. - DOI - PMC - PubMed
    1. Rao YL, Ganaraja B, Murlimanju BV, Joy T, Krishnamurthy A, Agrawal A. Hippocampus and its involvement in Alzheimer’s disease: a review. 3 Biotech. 2022;12:55. doi: 10.1007/s13205-022-03123-4. - DOI - PMC - PubMed
    1. Xiao Y, Hu Y, Huang K, Alzheimer’s Disease Neuroimaging I. Atrophy of hippocampal subfields relates to memory decline during the pathological progression of Alzheimer’s disease. Front Aging Neurosci. 2023;15:1287122. doi: 10.3389/fnagi.2023.1287122. - DOI - PMC - PubMed
    1. Mueller SG, Schuff N, Yaffe K, Madison C, Miller B, Weiner MW. Hippocampal atrophy patterns in mild cognitive impairment and Alzheimer’s disease. Hum Brain Mapp. 2010;31:1339–47. doi: 10.1002/hbm.20934. - DOI - PMC - PubMed

Publication types

Substances