. 2024 Jun 10;15(1):4772.
doi: 10.1038/s41467-024-48663-w.

Retrotransposons in Werner syndrome-derived macrophages trigger type I interferon-dependent inflammation in an atherosclerosis model

Affiliations

Retrotransposons in Werner syndrome-derived macrophages trigger type I interferon-dependent inflammation in an atherosclerosis model

Sudip Kumar Paul et al. Nat Commun. .

Abstract

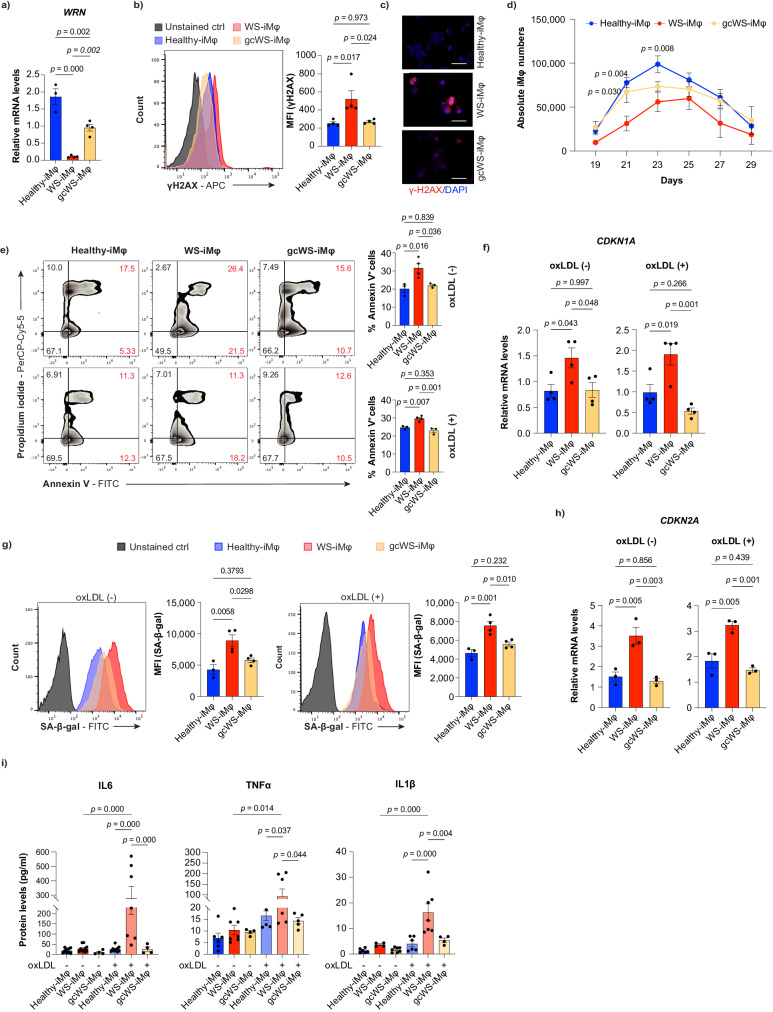
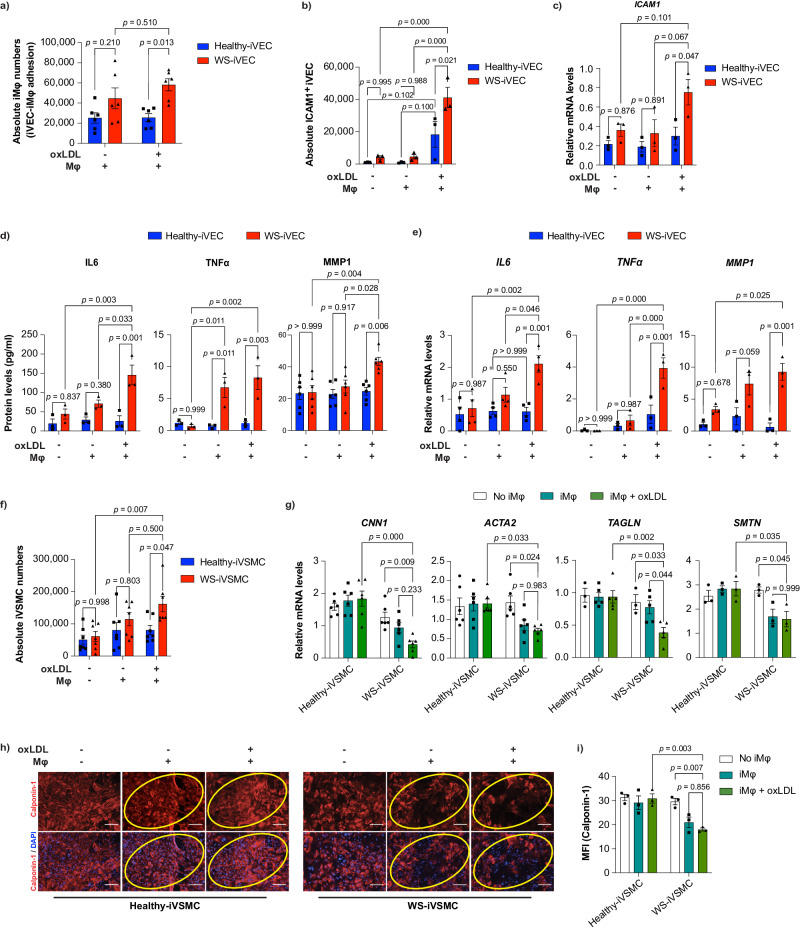
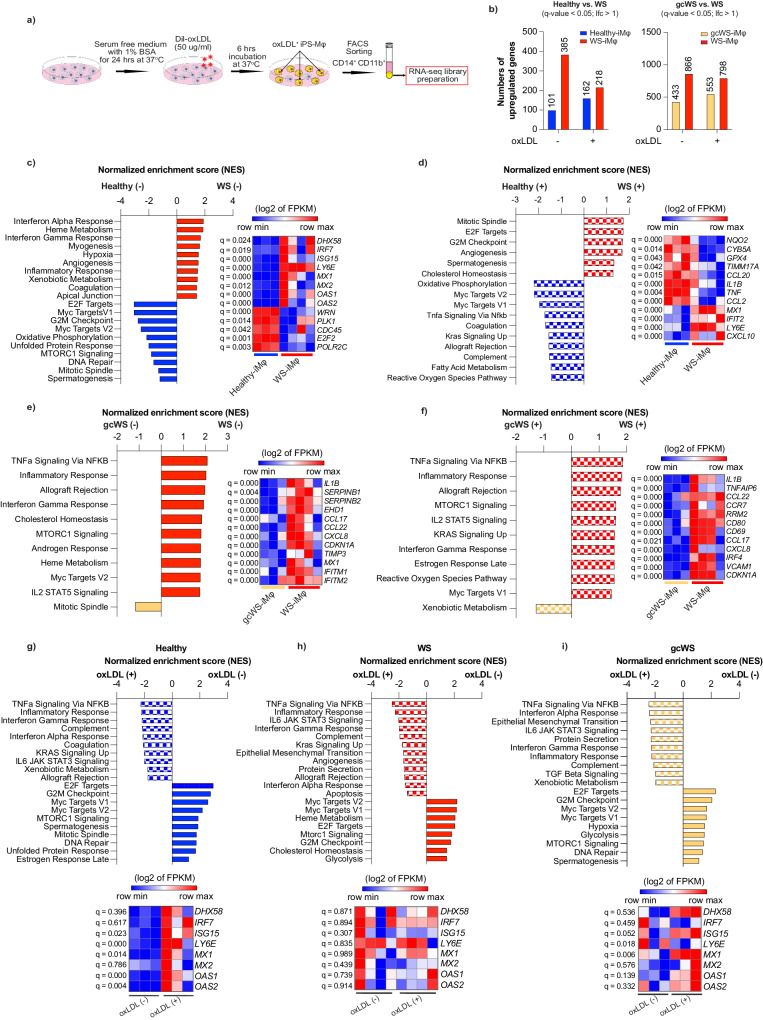
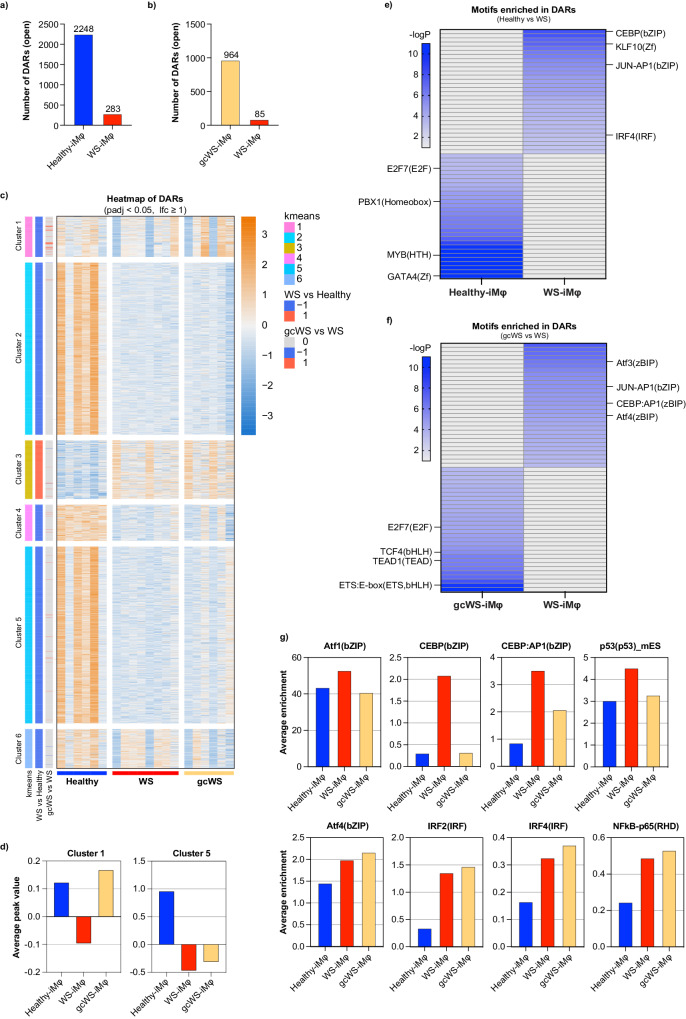
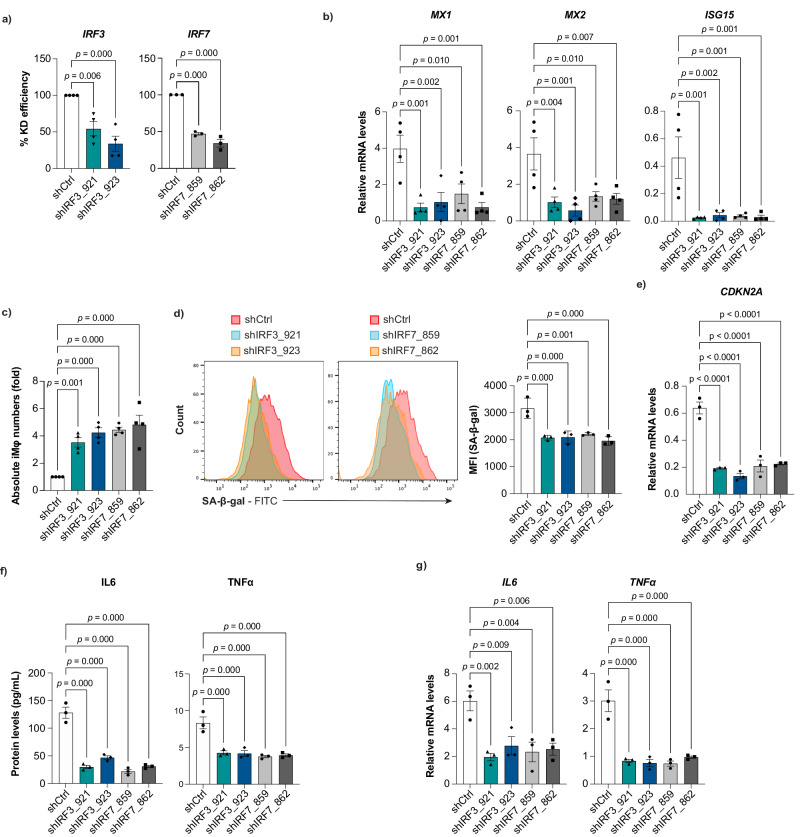
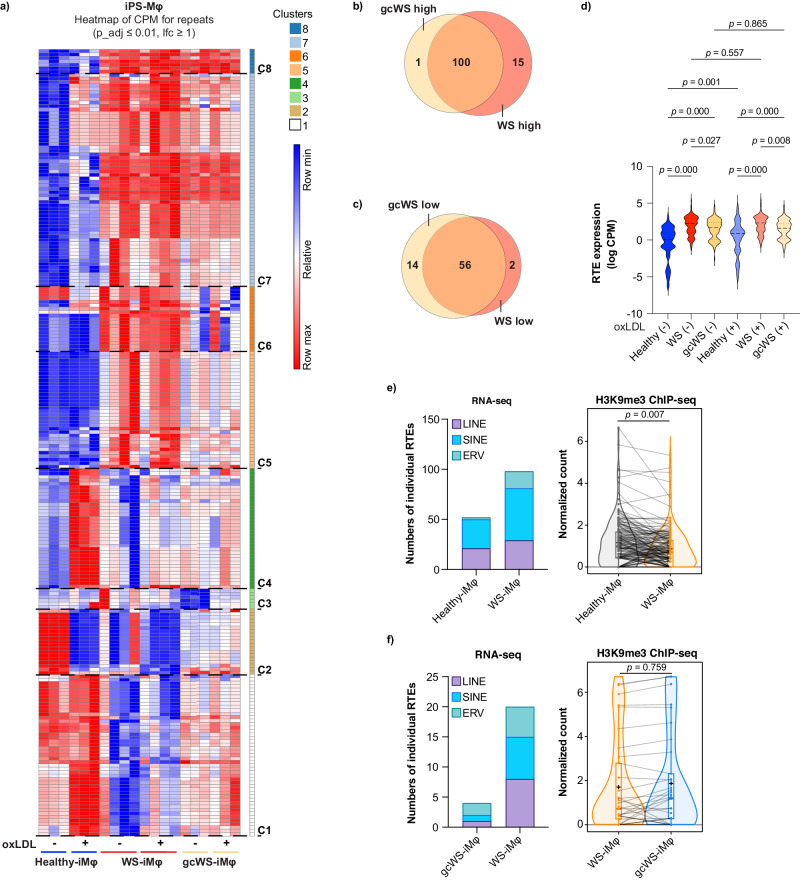
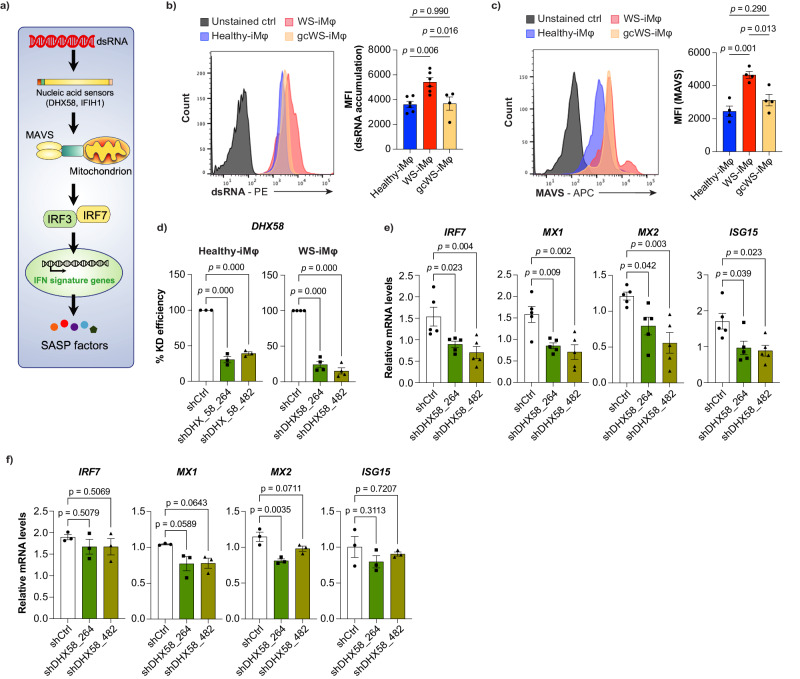
The underlying mechanisms of atherosclerosis, the second leading cause of death among Werner syndrome (WS) patients, are not fully understood. Here, we establish an in vitro co-culture system using macrophages (iMφs), vascular endothelial cells (iVECs), and vascular smooth muscle cells (iVSMCs) derived from induced pluripotent stem cells. In co-culture, WS-iMφs induces endothelial dysfunction in WS-iVECs and characteristics of the synthetic phenotype in WS-iVSMCs. Transcriptomics and open chromatin analysis reveal accelerated activation of type I interferon signaling and reduced chromatin accessibility of several transcriptional binding sites required for cellular homeostasis in WS-iMφs. Furthermore, the H3K9me3 levels show an inverse correlation with retrotransposable elements, and retrotransposable element-derived double-stranded RNA activates the DExH-box helicase 58 (DHX58)-dependent cytoplasmic RNA sensing pathway in WS-iMφs. Conversely, silencing type I interferon signaling in WS-iMφs rescues cell proliferation and suppresses cellular senescence and inflammation. These findings suggest that Mφ-specific inhibition of type I interferon signaling could be targeted to treat atherosclerosis in WS patients.


Conflict of interest statement

The authors declare no competing interests.

Figures

Fig. 1
Fig. 1. Apoptosis and cellular senescence lead to impaired WS-iMφ proliferation.
a mRNA levels of WRN normalized by GAPDH mRNA (n = 4). b Representative flow cytometric histogram of γ-H2AX staining in healthy-, WS-, and gcWS-iMφs without oxLDL treatment (left) and γ-H2AX MFI (right) (n = 4). c Immunofluorescence image of γ-H2AX foci in healthy-, WS-, and gcWS-iMφs. The scale bar is 30 μm. d Absolute numbers of CD14+CD11b+ healthy- (n = 3), WS- (n = 4), and gcWS-iMφs (n = 3). e Representative flow cytometric plots of annexin V staining in healthy-, WS-, and gcWS-iMφs without (left top) or with (left bottom) oxLDL treatment. Bar graphs show the total proportion of annexin V+ cells among healthy- (n = 3), WS- (n = 4), and gcWS-iMφs (n = 3), before (right top) and after (right bottom) oxLDL treatment. f mRNA levels of CDKN1A normalized by GAPDH mRNA before (left) and after (right) oxLDL treatment (n = 4). g Representative flow cytometric plots of SA-β-gal staining before (left) and after (right) oxLDL treatment among healthy-, WS-, and gcWS-iMφs. Bar graphs show the MFI of SA-β-gal among healthy- (n = 3), WS- (n = 4), and gcWS-iMφs (n = 4), before (left) and after (right) oxLDL treatment. h mRNA levels of CDKN2A normalized by GAPDH mRNA before (left) and after (right) oxLDL treatment (n = 3). i Secreted pro-inflammatory cytokine protein levels, determined by ELISA, for healthy-, WS-, and gcWS-iMφs before (n = 9, 10, 4) and after oxLDL treatment (n = 9, 7, 4). Three independent experiments of three independent biological samples were used for Healthy- ans WS- iMφs. Data are shown as the mean ± standard error of the mean (SEM) of biologically independent samples unless otherwise stated. One-way ANOVA with Tukey’s multiple comparisons was performed to calculate the p values. MFI mean fluorescent intensity, oxLDL oxidized low-density lipoprotein. Source data are provided as a Source Data file.
Fig. 2
Fig. 2. Effects of inflammatory iMφs on iPSC-derived vascular cells.
a Absolute numbers of CD14+ adherent iMφs on iVECs after co-culture (n = 6). b Absolute numbers of ICAM1+ VE-cad+ iVECs before and after co-culture with untreated or oxLDL-treated Mφs (n = 3). c mRNA levels of ICAM1 normalized by GAPDH mRNA before and after co-culture with untreated or oxLDL-treated Mφs (n = 3). d IL6 (n = 3), TNFα (n = 3), and MMP1 (n = 6) protein levels quantified by ELISA before and after co-culture with untreated or oxLDL-treated Mφs. e IL6, TNFα, and MMP1 mRNA levels normalized by GAPDH mRNA before and after co-culture with untreated or oxLDL-treated Mφs (n = 3). f Absolute numbers of healthy- and WS-iVSMCs before and after co-culture with untreated or oxLDL-treated Mφs (n = 7). g mRNA levels of VSMC contractile markers (CNN1 (n = 6), ACTA2 (n = 6), TAGLN (n = 3, 5, 5), SMTN (n = 3)) normalized by GAPDH mRNA before and after co-culture with untreated or oxLDL-treated Mφs. h Immunocytochemistry of calponin-1 protein in healthy- and WS-iVSMCs before and after co-culture with untreated or oxLDL-treated Mφs. The scale bar is 100 μm. i MFI of calponin-1 protein expression from (h). ImageJ was used to calculate calponin-1 MFI (n = 3). Data are shown as the mean ± SEM. (n = 6) represents two biologically independent samples over two independent experiments, and (n = 3) represents biologically independent samples. Two-way ANOVA with Tukey’s multiple comparisons was performed to calculate the p values. MFI mean fluorescent intensity, oxLDL oxidized low-density lipoprotein. Source data are provided as a Source Data file.
Fig. 3
Fig. 3. RNA-seq analysis of iMφs.
a Schematic diagram of RNA-seq library preparation. b Numbers of DEGs in healthy- (blue), WS- (red), and gcWS-iMφs (yellow) before and after oxLDL treatment. DEGs were derived from Cuffdiff pairwise analysis (q-value < 0.05, lfc >1). Pairwise GSEA of non-treated healthy- vs. WS-iMφs (c), oxLDL-treated healthy- vs. WS-iMφs (d), non-treated gcWS- vs. WS-iMφs (e), oxLDL-treated gcWS- vs. WS-iMφs (f), non-treated healthy-iMφs vs. oxLDL-treated healthy-iMφs (g), non-treated WS-iMφs vs. oxLDL-treated WS-iMφs (h), and non-treated gcWS-iMφs vs. oxLDL-treated gcWS-iMφs (i). Bar plots show the top 10 enriched pathways in GSEA, and heatmaps show the enriched gene sets in those top 10 pathways. Heatmaps were derived from the log2 of fragments per kilobase of exon per million reads mapped (FPKM) values. Statistical significance was derived from q-values calculated by Cuffdiff. (–) non-treated; (+) oxLDL-treated. All the experiments in this figure were derived from (n = 3, for healthy-; n = 4 for WS-; and n = 3 for gcWS-iMφ biologically independent samples). oxLDL oxidized low-density lipoprotein.
Fig. 4
Fig. 4. Type I IFN-specific chromatin accessibility profile in WS-iMφs.
Numbers of DARs between healthy- (n = 6) and WS-iMφs (n = 8) (a) and between WS- (n = 8) and gcWS-iMφs (n = 6) (b). c Heatmap of counts per million (CPM) of DARs calculated using DESeq2 in healthy-, WS-, and gcWS-iMφs, with each column representing the CPM of each DAR within a sample and each row representing an individual DAR (adjusted p < 0.05, lfc >1). Differential analysis with DESeq2 (v1.36.0 with default parameters). d Clusterwise average peak value in healthy-, WS-, and gcWSiMφs. Heatmaps showing enriched top 30 motifs in DARs by HOMER in healthy- and WS-iMφs (e) and in WS- and gcWS-iMφs (f); Heatmaps were derived from -logP values of each enriched motifs. -logP values over 10 were defined as dark blue in color. Finding Enriched Motifs in Genomic Regions with HOMER findMotifsGenome.pl with default parameters. g Bar plots show average enrichment of individual motifs in healthy-, WS-, and gcWS-iMφs. Finding Enriched Motifs in Genomic Regions with HOMER findMotifsGenome.pl with default parameters. oxLDL oxidized low-density lipoprotein, DAR differtially accessible regions. Source data are provided as a Source Data file.
Fig. 5
Fig. 5. Type I IFN signal-dependent cellular senescence and inflammation in WS-iMφs.
a Percent knockdown (KD) efficiency by shIRF3 (n = 4) and shIRF7 (n = 3). b mRNA levels of type I IFN signature genes normalized by GAPDH mRNA after lentiviral transduction of shIRF3 and shIRF7 (n = 4). c Fold change in absolute numbers of WS-iMφs after lentiviral transduction of shIRF3 and shIRF7 (n = 4). d Representative flow cytometric plots of SA-β-gal staining (left) and MFI (right) after lentiviral transduction of shIRF3 and shIRF7 (n = 3). e CDKN2A mRNA levels normalized by GAPDH mRNA (n = 4). f Pro-inflammatory cytokine levels after lentiviral transduction of shIRF3 and shIRF7 (n = 4). g IL6 and TNFα mRNA levels normalized by GAPDH mRNA after lentiviral transduction of shIRF3 and shIRF7 (n = 4). Data are shown as mean ± SEM of biologically independent samples. One-way ANOVA with Dunnett’s multiple comparisons was performed to calculate the p values. Source data are provided as a Source Data file.
Fig. 6
Fig. 6. Resurrection of retrotransposons in WS-iMφs.
a Heatmap showing differential expression of RTEs obtained using limma-voom in healthy- (n = 3), WS- (n = 4), and gcWS-iMφs (n = 3) before and after oxLDL treatment, with each column representing a sample group and each row representing an individual RTE. Moderated paired t tests were performed using limma, and the p values were corrected for multiple comparisons using Benjamini Hochberg’s method. Venn diagram showing commonly upregulated (b) and downregulated (c) RTEs in gcWS- (n = 3) and WS-iMφs (n = 4) compared with healthy-iMφs (n = 3) in pairwise analysis (adjusted p < 0.01, lfc >1). Pairwise analysis of individual numbers of RTEs was determined by RNA-seq with moderated paired t tests were performed using limma, and the p values were corrected for multiple comparisons using Benjamini Hochberg’s method. d Levels of RTE expression healthy- (n = 3), WS- (n = 4), and gcWS-iMφs (n = 3) (adjusted p < 0.01, lfc >1) before and after oxLDL treatment. Data are presented as logCPM values for each group. One-way ANOVA was performed to calculate the p values. e Numbers of individual RTEs (adjusted p < 0.01, lfc >1) at sub-family (LINE, SINE, and ERV) levels in non-treated healthy- and WS-iMφs (left), for which levels of H3K9me3 were determined by ChIP-seq in non-treated healthy- (n = 3) and WS-iMφs (n = 3) (right). Welch Two Sample t test was performed to calculate the p values. Boxes represent the 25–75 percentile ranges with the median of the horizontal line and the mean of the plus. The ends of vertical lines represent the 10 or 90 percentiles. f Numbers of individual RTEs (adjusted p < 0.01, lfc >1) at sub-family (LINE, SINE, and ERV) levels in non-treated WS- and gcWS-iMφs (left), for which levels of H3K9me3 were determined by ChIP-seq in non-treated WS- (n = 3) and gcWS-iMφs (n = 3) (right). Two Sample t test was performed to calculate the p values. Boxes represent the 25–75 percentile ranges with the median of the horizontal line and the mean of the plus. The ends of vertical lines represent the 10 or 90 percentiles. oxLDL oxidized low-density lipoprotein, CPM counts per million, C1-8; cluster 1-8, long-interspersed nuclear element (LINE), short-interspersed nuclear element (SINE), and endogenous retrovirus (ERV). In this figure, n represents biologically independent samples. Source data are provided as a Source Data file.
Fig. 7
Fig. 7. DHX58-dependent dsRNA sensing pathway initiates transcription of type I IFN signature genes.
a Schematic diagram of DHX58-dependent dsRNA sensing pathway. b Representative FACS plot of dsRNA accumulation (left) and MFI of dsRNA accumulation (right) in healthy- (n = 6), WS- (n = 6), and gcWS-iMφs (n = 4), three biologically independent samples over two independent experiments. c Representative FACS plot of MAVS expression (left) and MFI of MAVS expression (right) in healthy-, WS-, and gcWS-iMφs (n = 4). d Percent knockdown efficiency of lentiviral transduction of shDHX58 in healthy-iMφs (n = 3) (left) and WS-iMφs (n = 4) (right). mRNA levels of type I IFN signature genes normalized by GAPDH mRNA after lentiviral transduction with shDHX58 in WS- iMφs (n = 5) (e) and healthy-iMφs (n = 3) (f). Data are shown as the mean ± SEM biologically independent. One-way ANOVA with Dunnett’s multiple comparisons was performed to calculate the p values. MFI mean fluorescent intensity, oxLDL oxidized low-density lipoprotein, MAVS mitochondrial antiviral-signaling protein, IFN interferon. Source data are provided as a Source Data file.

References

    1. Kudlow BA, Kennedy BK, Monnat RJ. Werner and Hutchinson–Gilford progeria syndromes: Mechanistic basis of human progeroid diseases. Nat. Rev. Mol. Cell Biol. 2007;8:394–404. doi: 10.1038/nrm2161. - DOI - PubMed
    1. Goto M, Ishikawa Y, Sugimoto M, Furuichi Y. Werner syndrome: A changing pattern of clinical manifestations in Japan (1917\ 2008) Biosci. Trends. 2013;7:13–22. - PubMed
    1. Huang S, et al. The spectrum of WRN mutations in Werner syndrome patients. Hum. Mutat. 2006;27:558–567. doi: 10.1002/humu.20337. - DOI - PMC - PubMed
    1. Chang S, et al. Essential role of limiting telomeres in the pathogenesis of Werner syndrome. Nat. Genet. 2004;36:877–882. doi: 10.1038/ng1389. - DOI - PubMed
    1. Wu Z, et al. Differential stem cell aging kinetics in Hutchinson-Gilford progeria syndrome and Werner syndrome. Protein Cell. 2018;9:333–350. doi: 10.1007/s13238-018-0517-8. - DOI - PMC - PubMed

MeSH terms