Multicenter Study
. 2024 Jun 10;14(1):13309.
doi: 10.1038/s41598-024-62543-9.

In situ brain tumor detection using a Raman spectroscopy system-results of a multicenter study

Affiliations
Multicenter Study

In situ brain tumor detection using a Raman spectroscopy system-results of a multicenter study

Katherine Ember et al. Sci Rep. .

Abstract

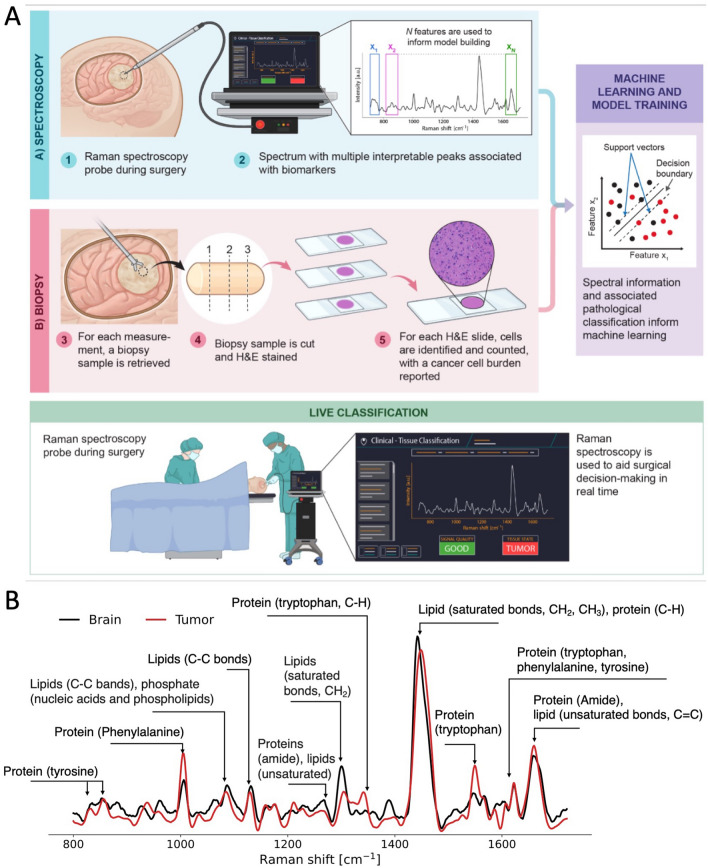
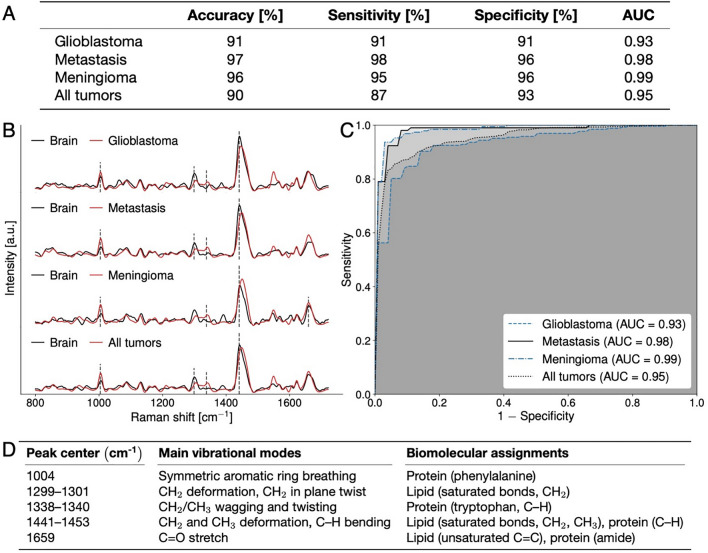
Safe and effective brain tumor surgery aims to remove tumor tissue, not non-tumoral brain. This is a challenge since tumor cells are often not visually distinguishable from peritumoral brain during surgery. To address this, we conducted a multicenter study testing whether the Sentry System could distinguish the three most common types of brain tumors from brain tissue in a label-free manner. The Sentry System is a new real time, in situ brain tumor detection device that merges Raman spectroscopy with machine learning tissue classifiers. Nine hundred and seventy-six in situ spectroscopy measurements and colocalized tissue specimens were acquired from 67 patients undergoing surgery for glioblastoma, brain metastases, or meningioma to assess tumor classification. The device achieved diagnostic accuracies of 91% for glioblastoma, 97% for brain metastases, and 96% for meningiomas. These data show that the Sentry System discriminated tumor containing tissue from non-tumoral brain in real time and prior to resection.


Conflict of interest statement

Frederic Leblond and Kevin Petrecca are co-founders of Reveal Surgical. Authors listed as "Reveal Surgical" worked within the company Reveal Surgical. However, none were involved in data analysis or interpretation. Costantino Hadjipanayis is paid consultant for Synaptive Medical, Stryker Corporation, and Hemerion.

Figures

Figure 1
Figure 1
(A) Experimental workflow for brain tumor detection using the Sentry System. The blue panel shows spectral fingerprint measurements being acquired using the hand-held probe during neurosurgery. The red panel shows the workflow for acquisition of histopathology data associated with each spectral measurement, including estimation of cancer cell burden by the pathologist. Bulk tumor is defined as a > 90% cancer cell burden and non-tumoral brain is a cancer cell burden of 0%. The green panel shows use of the Sentry System for live classification of tumor and non-tumoral brain tissue. (B) Mean spectral fingerprint measurements from 67 patients showing key spectral peaks used for tumor detection. Spectral fingerprints were taken from tumor (red) and non-tumoral brain (black). C-H, carbon-hydrogen single bonds; C=C, carbon–carbon double bonds (unsaturated); C–C, carbon–carbon bonds; CH2, ethyl group; CH3, methyl group.
Figure 2
Figure 2
Schematic diagram of the machine learning workflow. The dataset was split into training (80% of the whole dataset) and holdout (20% of dataset) subsets. Feature selection and classification hyperparameters were optimized by generating machine learning models using support vector machines (SVM) for all predefined combinations of the hyperparameters N and C. The model performance associated with each combination was assessed using a fivefold cross-validation technique based on ROC analyses comparing model predictions with the assigned pathology labels. The final model was trained on the complete training set using the hyperparameters that yielded the lowest number of false positives and false negatives.
Figure 3
Figure 3
(AC) Depiction of the spectral quality factors for brain and tumor samples acquired with the Sentry system. (A) Quality factor (QF) distribution of all Raman spectra with alternating grey and white bands denoting different patients. (B) Spectrogram of Raman spectra from non-tumoral brain (left) and average Raman spectra with their variance (right). Average spectral fingerprints are shown for all samples (no QF cutoff) as well as for high and lower quality spectra. (C) Spectrogram of Raman spectra from tumor samples (left) and average Raman spectra with their variance (right). Higher quality spectra are associated with smaller levels of stochastic (photonic) noise leading to smaller inter-measurement variances (shown by sigma values).
Figure 4
Figure 4
(AD) Machine learning models discriminating between spectral fingerprints from non-tumoral brain and bulk tumor for glioblastoma, metastasis, meningioma and all tumors using data from Montreal Neurological Institute Hospital (MNI-H) and Mount Sinai Hospital (MSH). (A) Table plotting accuracy, sensitivity, specificity, and area under curve (AUC) for all models. (B) Spectral fingerprints from all patients (from MNI-H and MSH) with each specific type of brain tumor. Main spectral features used in model building designated by dotted lines, with (D) peak location and biomolecular origin specified. Mean non-tumoral brain spectra are shown in black and tumor spectra are shown in red. (C) Receiver operating curve (ROC) for the predictive model with area under curve (AUC) for each model. C–H, carbon-hydrogen single bonds; C=C, carbon–carbon double bonds (unsaturated); C–C, carbon–carbon bonds; CH2, ethyl group; CH3, methyl group. Quality factor cutoffs have been applied in all cases.
Figure 5
Figure 5
(AD) Box and whisker plots associated with the five most important bands selected by machine learning to distinguish non-tumoral brain from tumor: (A) non-tumoral brain vs. glioblastoma, B) non-tumoral brain vs. metastases, (B) non-tumoral brain vs. meningioma, (C) non-tumoral brain vs. tumors (glioblastoma, metastases and meningioma measurements lumped together). P-values for all bands on all plots are p < 1e−4 except for the 1659 cm−1 band which had p > 0.05 (p = 0.15).

References

    1. Roelz R, et al. Residual tumor volume as best outcome predictor in low grade glioma—a nine-years near-randomized survey of surgery vs biopsy. Sci. Rep. 2016;6:32286. doi: 10.1038/srep32286. - DOI - PMC - PubMed
    1. Wang Y-C, et al. Long term surgical outcome and prognostic factors of atypical and malignant meningiomas. Sci. Rep. 2016;6:35743. doi: 10.1038/srep35743. - DOI - PMC - PubMed
    1. Yong RL, et al. Residual tumor volume and patient survival following reoperation for recurrent glioblastoma. J. Neurosurg. 2014;121:802–809. doi: 10.3171/2014.6.JNS132038. - DOI - PubMed
    1. Stummer W, et al. Fluorescence-guided surgery with 5-aminolevulinic acid for resection of malignant glioma: A randomised controlled multicentre phase III trial. Lancet Oncol. 2006;7:392–401. doi: 10.1016/S1470-2045(06)70665-9. - DOI - PubMed
    1. Nassiri F, et al. Life after surgical resection of a meningioma: A prospective cross-sectional study evaluating health-related quality of life. Neuro-Oncology. 2019;21:I32–I43. doi: 10.1093/neuonc/noy152. - DOI - PMC - PubMed

Publication types