. 2024 Jun 10;15(6):405.
doi: 10.1038/s41419-024-06781-9.

Aberrant ER-mitochondria communication is a common pathomechanism in mitochondrial disease

Affiliations

Aberrant ER-mitochondria communication is a common pathomechanism in mitochondrial disease

Patricia Morcillo et al. Cell Death Dis. .

Abstract

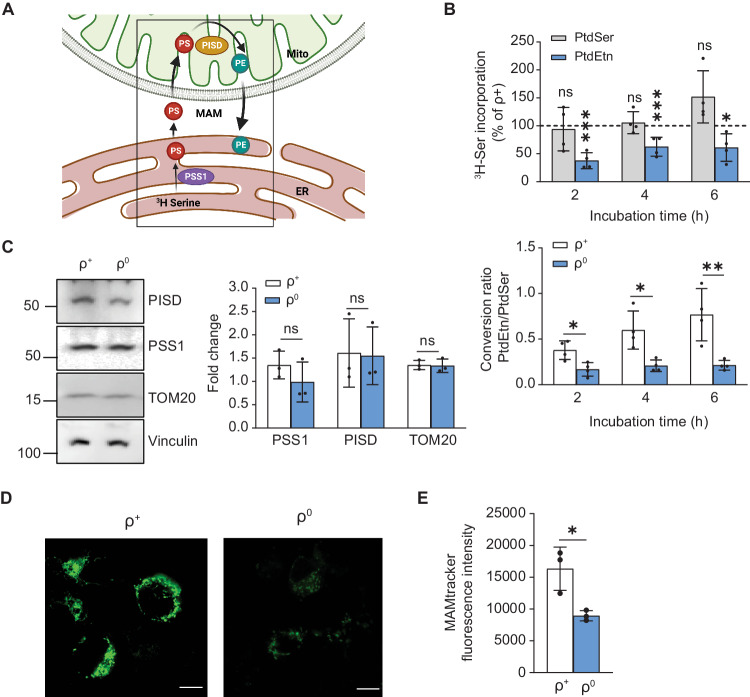
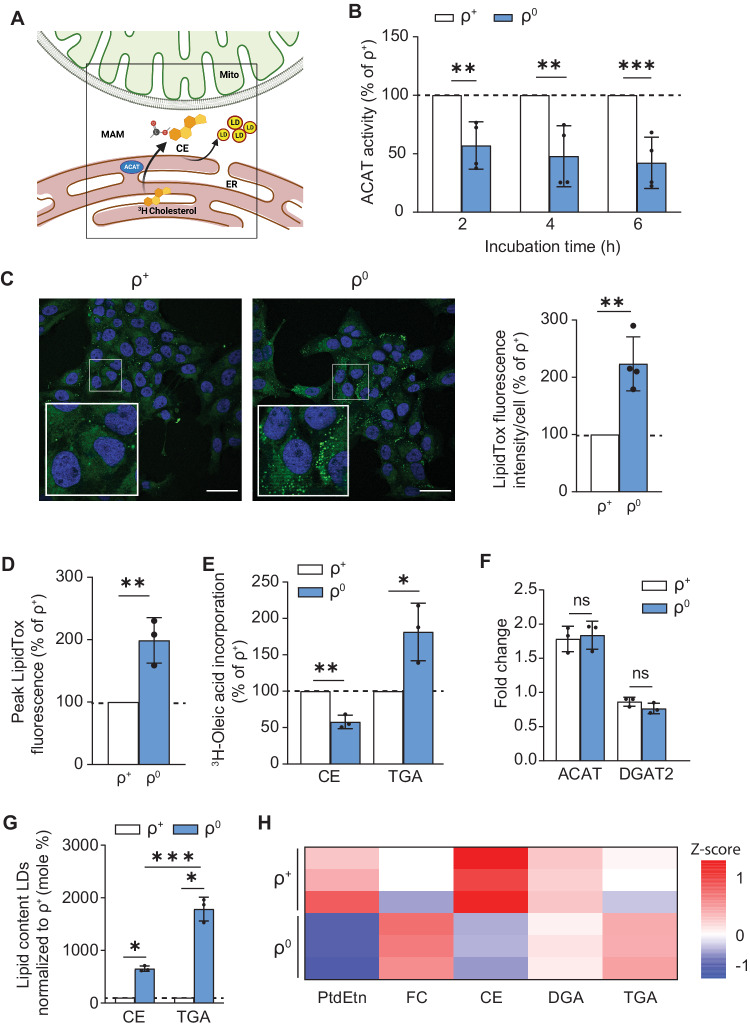
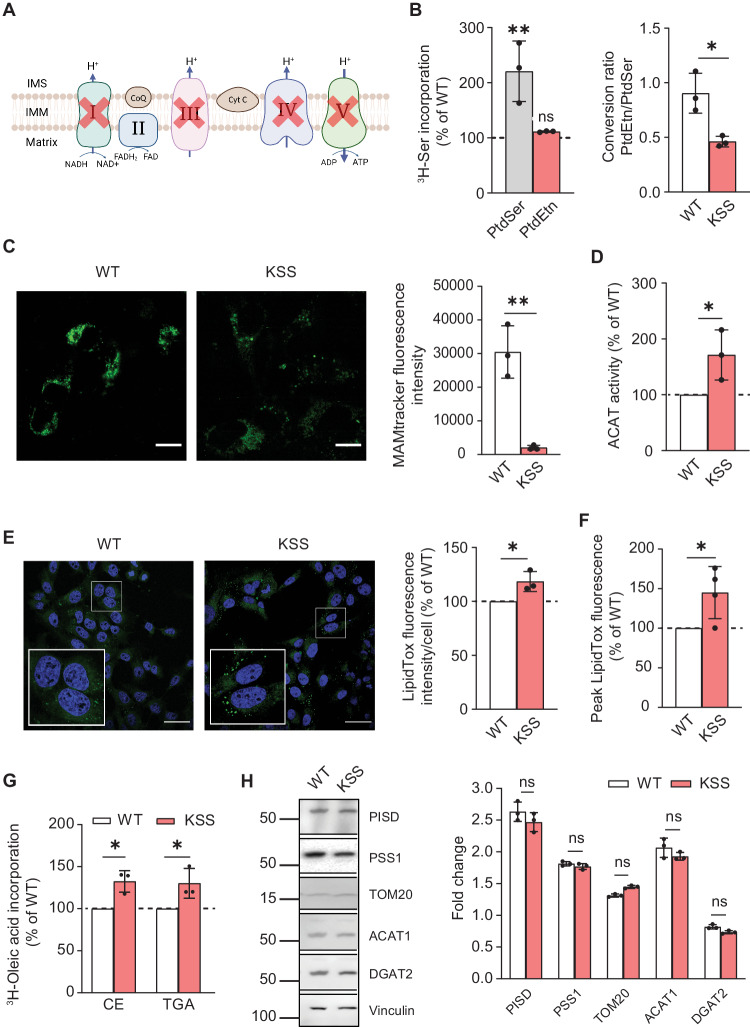
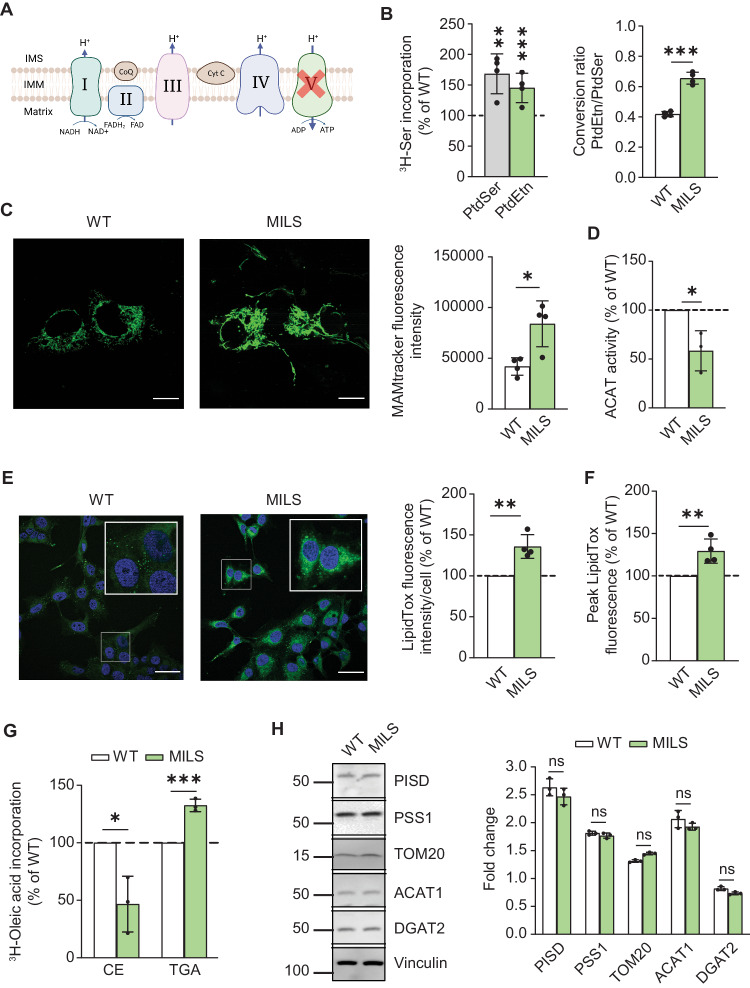
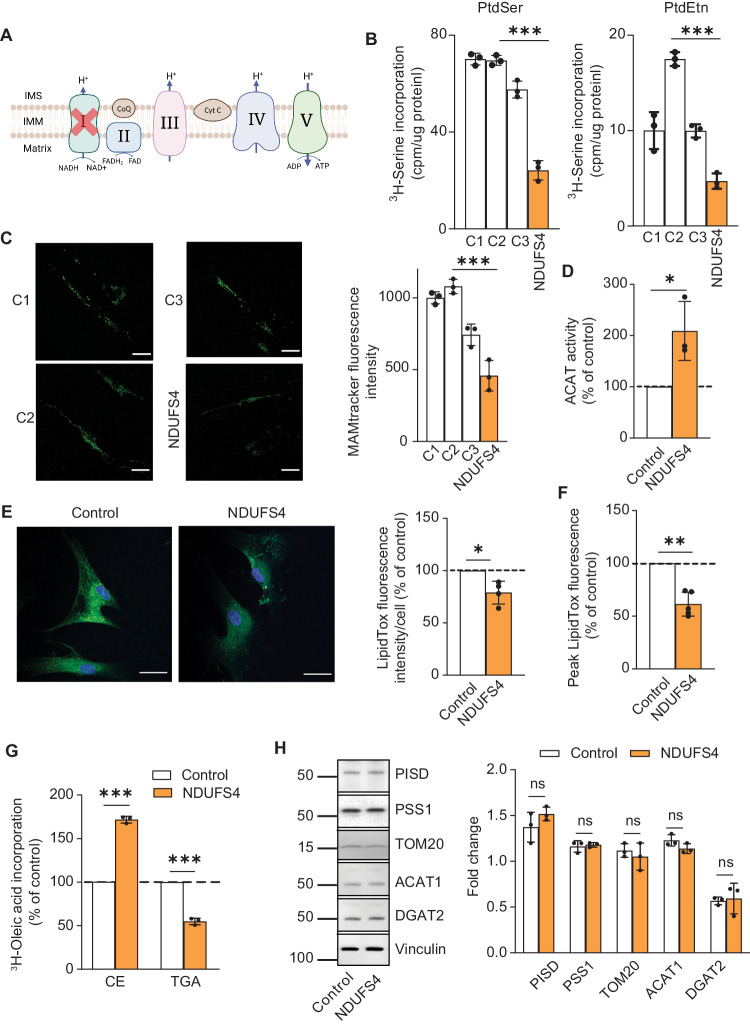
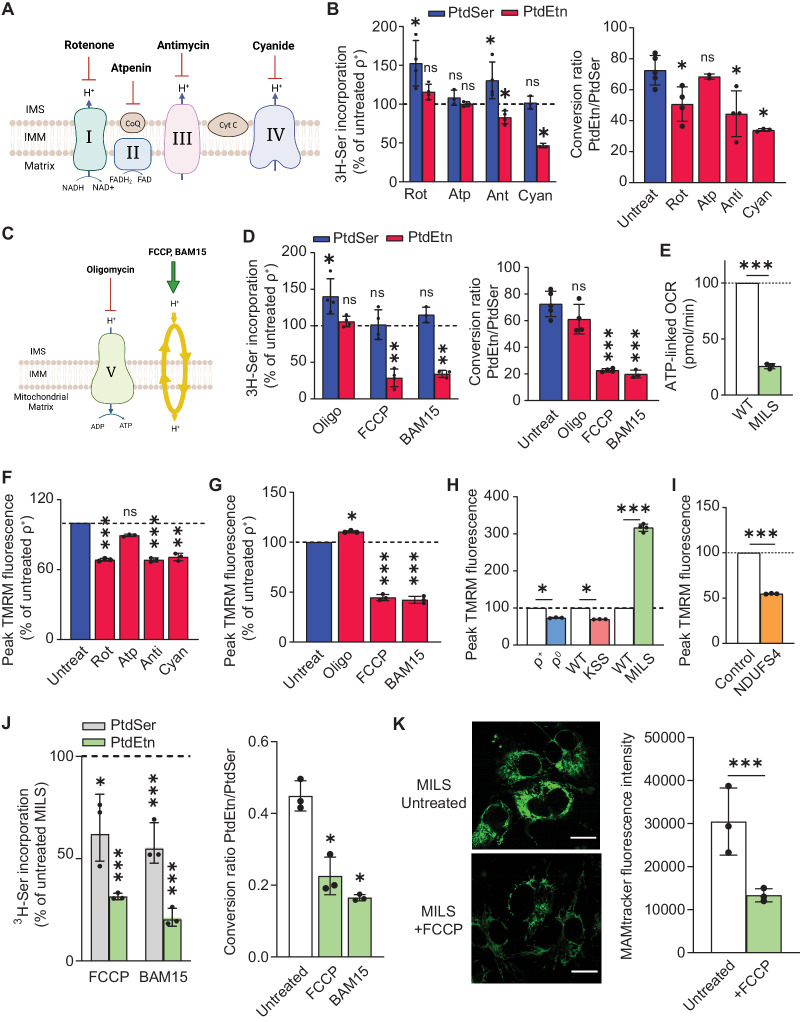
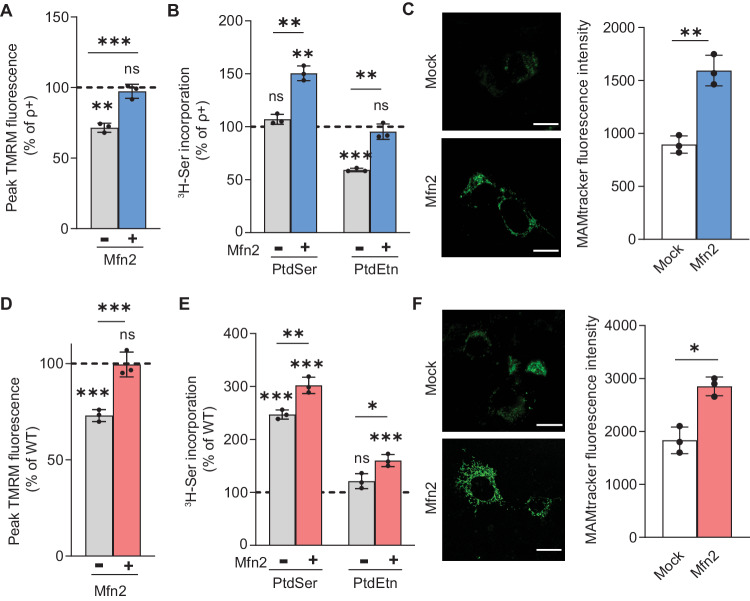
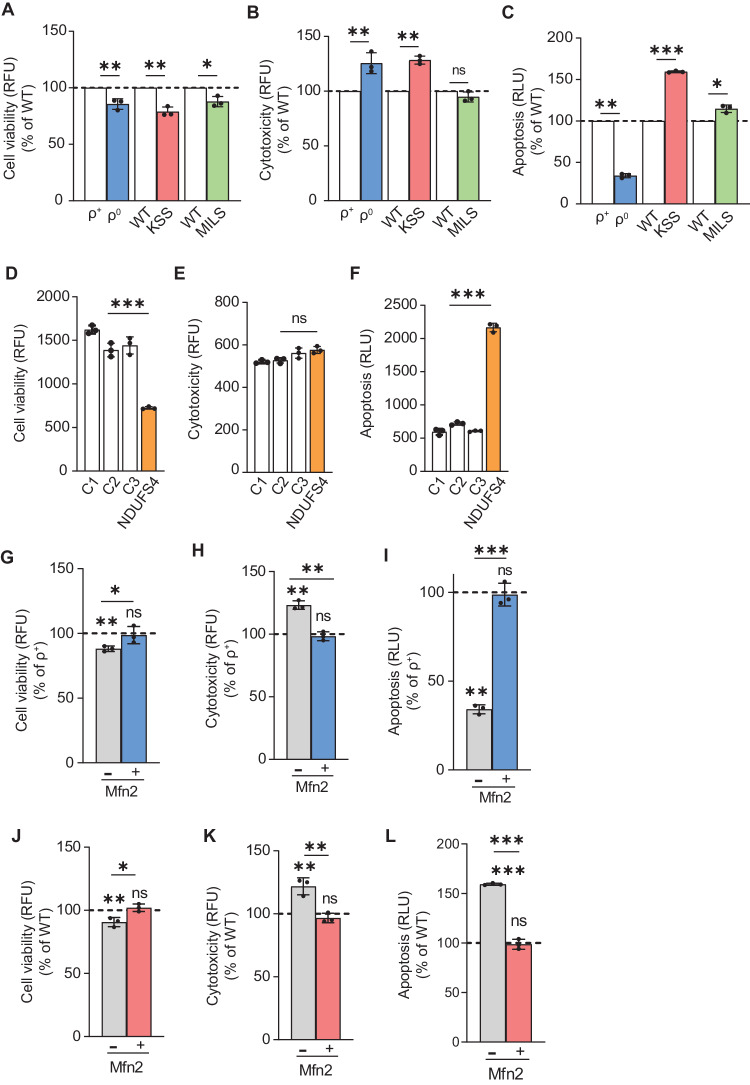
Genetic mutations causing primary mitochondrial disease (i.e those compromising oxidative phosphorylation [OxPhos]) resulting in reduced bioenergetic output display great variability in their clinical features, but the reason for this is unknown. We hypothesized that disruption of the communication between endoplasmic reticulum (ER) and mitochondria at mitochondria-associated ER membranes (MAM) might play a role in this variability. To test this, we assayed MAM function and ER-mitochondrial communication in OxPhos-deficient cells, including cybrids from patients with selected pathogenic mtDNA mutations. Our results show that each of the various mutations studied indeed altered MAM functions, but notably, each disorder presented with a different MAM "signature". We also found that mitochondrial membrane potential is a key driver of ER-mitochondrial connectivity. Moreover, our findings demonstrate that disruption in ER-mitochondrial communication has consequences for cell survivability that go well beyond that of reduced ATP output. The findings of a "MAM-OxPhos" axis, the role of mitochondrial membrane potential in controlling this process, and the contribution of MAM dysfunction to cell death, reveal a new relationship between mitochondria and the rest of the cell, as well as providing new insights into the diagnosis and treatment of these devastating disorders.


Conflict of interest statement

The authors declare no competing interests.

Figures

Fig. 1
Fig. 1. MAM function in ρ0 cells: role of phospholipid transfer.
A Schematic representation of phospholipid synthesis/transport at the MAM. Note that both ER and mitochondria are involved in this process. PISD, phosphatidylserine decarboxylase; PSS1, phosphatidylserine synthase 1; PS, phosphatidylserine; PE, phosphatidylethanolamine; Mito, mitochondria. B Conversion of 3H-Ser into 3H-PtdSer and 3H-PtdEtn in ρ0 cells relative to that in control ρ+ cells (dotted line) for the indicated times (n = 4 independent experiments). Note the severe drop in PtdEtn synthesis in ρ0 vs ρ+ cells, whereas that of PtdSer was unchanged. Quantification of the ratio of PtdEtn/PtdSer in ρ+ and ρ0 cells analyzed in B below. Note the decrease in the conversion of 3H-PtdSer to 3H-PtdEtn in ρ0 cells. C Representative Western blot of phospholipid synthesis-related proteins (PSS1 and PISD), and of TOM20 (a mitochondrial marker), relative to vinculin in ρ+ and ρ0 cells. 20 μg protein loaded/lane. Molecular weight markers at left, in kDa. Quantitation at right. Note similar protein levels in the two cells. D Representative confocal microscopy images of MAM (MAMtracker-Green, green). Scale bars = 10 μm. Note the increase in MAMtracker fluorescence intensity in ρ0 cells compared to ρ+ cells. E Quantitation of the fluorescence intensity of MAMtracker-Green in transfected ρ+ and ρ0 cells (n = 4 independent experiments, examining 7-8 transfected cells in each experiment). Data here and in all other figures are expressed as mean ± SD. Statistical significance was analyzed by Student’s t-test (*, p < 0.05; **, p < 0.01; ***, p < 0.0001; ns, not significant).
Fig. 2
Fig. 2. MAM function in ρ0 cells: role of cholesteryl ester synthesis.
A Schematic representation of CE synthesis at the MAM. Note that MAM, but not mitochondria, is involved in this reaction. ACAT, acyl-CoA:cholesterol acyltransferase 1; CE, cholesteryl ester; LD, lipid droplet. B Conversion of 3H-cholesterol to 3H-CE (a MAM-specific function) in ρ0 cells relative to ρ+ cells (dotted line) for the indicated times (n = 3 independent experiments). Note that the conversion of cholesterol in CE was reduced in ρ0 compared to ρ+ cells. C Representative confocal microscopy images of lipid droplet staining with LipidTox Green (green), and nuclei labeled with DAPI (blue), in ρ+ and ρ0 cells. Scale bars = 45 μm. Expanded images in boxes. Quantitation of fluorescence intensity of LipidTox Green in ρ0 cells relative to ρ+ cells (dotted line) at right (n = 4 independent experiments with >50 cells in each experiment). Note increase in LD formation in ρ0 cells. D Quantitation of fluorescence intensity of LipidTox Green in ρ0 cells relative to ρ+ cells (dotted line) by flow cytometry (n = 3 independent experiments with >20000 cells in each experiment). E Conversion of 3H-oleic acid to 3H-cholesteryl oleate (CE) and 3H-triglycerides (TGA) in ρ0 cells relative to ρ+ cells (dotted line) after 4 hours. Note the increase in the levels of TGA in ρ0 cells and the decrease in CE, consistent with the decrease in 3H-CE in panel B (n = 3 independent experiments). F Quantitation of LD synthesis-related proteins ACAT1 and DGAT2 relative to vinculin in ρ+ and ρ0 cells (n = 3). Note similar protein levels in the two cells. G Quantitation of the lipid content in isolated LDs from ρ0 cells relative to ρ+ cells (dotted line) as measured by lipidomics (n = 3 independent experiments). Note the increase in TGA compared to CE in ρ0 cells, consistent with the increase in 3H-TGA in (E). H Heatmap representation of the lipidomics analysis of crude mitochondria (containing MAM), focusing on PtdEtn, free cholesterol (FC), cholesteryl esters (CE), diacylglycerides (DGA) and triglycerides (TGA) in ρ+ and ρ0 cells (n = 3). Results are expressed as Z-scores.
Fig. 3
Fig. 3. Analysis of MAM function in KSS cybrids.
A Schematic representation of the R.C. complexes compromised in KSS (red X’s). B Incorporation of 3H-Ser into 3H-PtdSer and 3H-PtdEtn in Δ-KSS cybrids compared to WT-KSS cybrids (dotted line) at 4 h (n = 3). Quantitation of the ratio of PtdEtn/PtdSer in WT-KSS and Δ-KSS cybrids analyzed in B at right. Note the decrease in the conversion of 3H-PtdSer to 3H-PtdEtn in Δ-KSS cybrids, similar to what was observed in ρ0 cells. C Representative confocal microscopy images of MAM (MAMtracker-Green, green) in WT-KSS and Δ-KSS cybrids. Scale bars = 15 μm. Quantification of MAMtracker-Green fluorescence intensity in transfected WT-KSS and Δ-KSS cybrids, as in Fig. 1E. D Conversion of 3H-cholesterol to 3H-CE in Δ-KSS relative to WT-KSS cybrids (dotted line) at 4 h (n = 3). Note that the decrease in ACAT activity in Δ-KSS was opposite to what we observed in ρ0 cells. E Representative confocal microscopy images of lipid droplet formation staining with LipidTox Green (green), and nuclei labeled with DAPI (blue), in WT-KSS and Δ-KSS cybrids. Scale bars = 45 μm. Expanded images in boxes. Quantitation of LipidTox Green fluorescence intensity as in Fig. 2C. F Quantitation of LipidTox Green fluorescence intensity in Δ-KSS cybrids compared to WT-KSS cybrids (dotted line) by flow cytometry as in Fig. 2D. Note increase in LDs, consistent with the CE data shown in panel D. G Conversion of 3H-oleic acid to 3H-cholesteryl oleate (CE) and 3H-triglycerides (TGA) in Δ-KSS cybrids compared to that in WT-KSS cybrids (dotted line) at 4 h (n = 3). Note that Δ-KSS cells accumulate both lipid species. H Representative Western blot of phospholipid synthesis-related proteins (PSS1 and PISD), LD-related proteins (ACAT1 and DGAT2), and mitochondria (TOM20), as in Fig. 1C. No change at the proteins level were observed.
Fig. 4
Fig. 4. Analysis of MAM function in MILS cybrids.
A Schematic representation of the T8993G mutation in ATPase6 that causes NARP and MILS. In contrast to KSS, in these cells the respiratory chain is intact and is essentially unaffected; only ATP synthesis is compromised. B Left: Incorporation of 3H-Ser into 3H-PtdSer and 3H-PtdEtn in MILS cybrids compared to WT-MILS cybrids (dotted line) at 4 h (n = 4). Note that in contrast to what we saw in KSS (Fig. 3B), both PtdSer and PtdEtn synthesis were significantly increased in MILS cybrids. Right: Quantitation of the ratio of PtdEtn/PtdSer in WT-MILS and MILS cybrids. Note increase in the conversion of 3H-PtdSer to 3H-PtdEtn in MILS cybrids. C Representative confocal microscopy images of MAM (MAMtracker-Green, green) in WT-MILS and MILS cybrids. Scale bars = 15 μm. Quantification of MAMtracker-Green fluorescent intensity in transfected WT-MILS and MILS cybrids (n = 4 independent experiments with 7-8 transfected cells in each experiment) at right. Note increase in MAMtracker fluorescence intensity, in agreement with the biochemical data shown in (B). D Conversion of 3H-cholesterol to 3H-CE in MILS relative to WT-MILS cybrids (dotted line) at 4 h (n = 3). Note that MILS cells mimic the CE results seen in ρ0 cells (Fig. 2B). E Representative confocal microscopy images of lipid droplet staining with LipidTox Green (green), and nuclei labeled with DAPI (blue), in WT-MILS and MILS cybrids. Scale bars = 45 μm. Expanded images in boxes. Quantitation at right, as in Fig. 2C. F Quantitation of fluorescence intensity of LipidTox Green in MILS cybrids compared to WT-MILS cybrids (dotted line) by flow cytometry, as in Fig. 2D. Note increase in LDs, in contrast with the CE data shown in (D). G Conversion of 3H-oleic acid to 3H-cholesteryl oleate (CE) and 3H-triglycerides (TGA) in MILS cybrids compared to WT-MILS cybrids (dotted line) at 4 h (n = 3). Note that MILS cells accumulate TGA but not CE. H Representative Western blot of phospholipid- and LD-related proteins, as in Fig. 3H. No changes at the protein level were observed.
Fig. 5
Fig. 5. Analysis of MAM function in NDUFS4-mutant fibroblasts.
A Schematic representation of the mutation in the nucleus-encoded NDUFS4 subunit of complex I. B Incorporation of 3H-Ser into 3H-PtdSer and 3H-PtdEtn in control fibroblasts (C1, WT001; C2, KR003; C3, FC8) and NDUFS4 fibroblasts at 4 h (n = 3). Left: Note that both PtdSer and PtdEtn synthesis were significantly decreased in mutant fibroblasts. Right: Quantification of the ratio of PtdEtn/PtdSer. Note that no change in the conversion efficiency of 3H-PtdSer to 3H-PtdEtn was observed in mutant fibroblasts. C Representative confocal microscopy images of MAM (MAMtracker-Green, green) in controls and NDUFS4 fibroblasts. Scale bars = 15 μm. Quantitation at right, as in Fig. 2C. Note decrease in MAMtracker fluorescence intensity, in agreement with the biochemical data shown in panel B. D Conversion of 3H-cholesterol to 3H-CE in NDUFS4 fibroblasts relative to control (dotted line) at 4 h (n = 3). E Representative confocal microscopy images of lipid droplet staining with LipidTox Green (green), and nuclei labeled with DAPI (blue), in control and NDUFS4 fibroblasts. Scale bars = 45 μm. Quantification at right, as in Fig. 2C. Note decrease in LD formation. F Quantitation of fluorescence intensity of LipidTox Green in NDUFS4 fibroblasts relative to control (dotted line), as in Fig. 2D. G Conversion of 3H-oleic acid into 3H-cholesteryl oleate (CE) and 3H-triglycerides (TGA) in mutant NDUFS4 fibroblasts compared to control (dotted line) at 4 h (n = 3). Note that mutant fibroblasts accumulate only CE, consistent with the biochemical CE data shown in (D). H Representative Western blot as in Fig. 3H. No changes in the protein levels were observed.
Fig. 6
Fig. 6. MAM function in R.C. complexes: the role of membrane potential.
A Schematic representation of the specific R.C. inhibitors used in the present study. B Incorporation of 3H-Ser into 3H-PtdSer and 3H-PtdEtn in 143B (ρ+) cells exposed to the indicated inhibitors compared to untreated cells (dotted line) at 6 h (n = 3). Quantitation of PtdEtn/PtdSer at right. Note reduction in phospholipid transport after inhibition of CI, CIII, and CIV, but not of CII. C Schematic representation of the specific OxPhos inhibitors (oligomycin for CV) and uncouplers (FCCP and BAM15) used here. D Incorporation of 3H-Ser into 3H-PtdSer and 3H-PtdEtn in ρ+ cells exposed to oligomycin and uncouplers (dotted line) at 6 h (n = 3). Quantification of PtdEtn/PtdSer at right. E Quantification of ATP-linked OCR in WT-MILS and mut-MILS cybrids (n = 3). Note the decrease in ATP production in mut-MILS cybrids. F Quantitation of the mitochondrial membrane potential (MMP) measured by TMRM after exposing ρ+ cells to the R.C. inhibitors (n = 3). Note that inhibition of complexes I, III, and IV induced a reduction of MPP compared to untreated cells, whereas inhibition of complex II had little effect. G Quantitation of MMP after exposing ρ+ cells to oligomycin and to uncouplers (n = 3). Note that inhibition of complex V induced an increase in MMP compared to untreated cells, whereas both uncouplers induced mitochondrial depolarization. H Quantitation of MMP in the cells and cybrids studied here (n = 3). Note that ρ0 cells and KSS cybrids (both with essentially no respiratory chain function) maintained lower MMP, whereas MILS cybrids (with complex V affected, but with an intact respiratory chain) exhibited a higher MMP, consistent with the pharmacological inhibition of OxPhos complexes, as shown in panels F and G. I Quantitation of MMP in control and NDUFS4 fibroblasts (n = 3). Note the decrease in MMP. J Incorporation of 3H-Ser into 3H-PtdSer and 3H-PtdEtn in mut-MILS cybrids exposed to uncouplers compared to that in untreated mut-MILS cybrids at 6 h (n = 3). Quantitation of PtdEtn/PtdSer at right. Note the significant reduction in MPP in MILS cells exposed to the uncouplers. K Representative confocal microscopy images of MAM (MAMtracker-Green, green) in mut-MILS cells untreated or treated with FCCP. Scale bars = 15 μm. Quantitation at right, as in Fig. 2E. Note decrease in MAMtracker fluorescence intensity, in agreement with the uncoupling data shown in (J).
Fig. 7
Fig. 7. Increased MMP reverses deficiencies in ER-mitochondrial communication.
A Quantitation of MMP in ρ0 mock-transfected or transfected with Mfn2 compared to that in ρ+ cells (dotted line) (n = 3). Note that ρ0 cells expressing Mfn2 showed an increase in MMP to essentially normal levels. B Incorporation of 3H-Ser into 3H-PtdSer and 3H-PtdEtn in ρ0 cells expressing Mfn2 compared to that in mock-transfected ρ0 cells (n = 3). Note that the decreased incorporation into 3H-PtdEtn in ρ0 cells was restored to essentially normal levels when Mfn2 was expressed. C Representative confocal microscopy images of MAM (MAMtracker-Green, green) in ρ0 mock-transfected or transfected with Mfn2. Scale bars = 20 μm. Quantitation at right, as in Fig. 2E. Note increase in MAMtracker fluorescence intensity in ρ0 cells expressing Mfn2, in agreement with the phospholipid transfer assay shown in (B). D Quantitation of MMP in Δ-KSS cybrids mock-transfected or transfected with Mfn2 compared to that in WT-KSS cells (dotted line) (n = 3). Note that Δ-KSS cells expressing Mfn2 showed an increase in MMP to essentially normal levels, similar to what we observed in ρ0 cells. E Incorporation of 3H-Ser into 3H-PtdSer and 3H-PtdEtn in Δ-KSS cells expressing Mfn2 compared to mock-transfected Δ-KSS cells (n = 3). Note the increase in 3H-Ser incorporation into 3H-PtdSer and 3H-PtdEtn in Δ-KSS when Mfn2 was expressed. F Representative confocal microscopy images of MAM (MAMtracker-Green, green) in Δ-KSS cells mock-transfected or transfected with Mfn2. Scale bars = 20 μm. Quantitation at right, as in Fig. 2E. Note increase in MAMtracker fluorescence intensity in Δ-KSS cells expressing Mfn2, in agreement with the phospholipid transfer assay shown in (E).
Fig. 8
Fig. 8. Alterations in MAM have consequences for cell survivability.
A Quantitation of cell viability in ρ0, Δ-KSS and MILS cells relative to their WT counterparts (dotted line) (n = 3 independent experiments). Note that cell viability was reduced in all the mutant cells compared to their controls. B Quantitation of cytotoxicity in ρ0, Δ-KSS and MILS cells relative to their WT counterparts (dotted line) (n = 3 independent experiments). Note that cytotoxicity increased in ρ0 and Δ-KSS while no changes were observed in MILS cells compared to their controls. C Quantitation of apoptosis in ρ0, Δ-KSS and MILS cells relative to their WT counterparts (dotted line) (n = 3 independent experiments). Note that caspase activity was reduced in ρ0 cells while it was increased in Δ-KSS and MILS cybrids. D Quantitation of cell viability in NDUFS4 fibroblasts and control fibroblasts (C1, WT001; C2, KR003; C3, FC8) (n = 3 independent experiments). Note that cell viability was reduced in NDUFS4 fibroblast compared to the controls. E Quantitation of cytotoxicity in NDUFS4 fibroblasts and control fibroblasts. (n = 3 independent experiments). Note that cytotoxicity was unaltered in NDUFS4 fibroblasts compared to the controls. F Quantitation of apoptosis in NDUFS4 fibroblasts and control fibroblasts. Note that apoptosis significantly increased in NDUFS4 fibroblasts compared to the control fibroblasts. G Quantitation of cell viability in ρ0 mock-transfected or transfected with Mfn2 compared to that in ρ+ cells (dotted line) (n = 3). Note that ρ0 cells expressing Mfn2 showed an increase in cell viability to essentially normal levels. H Quantitation of cytotoxicity in ρ0 mock-transfected or transfected with Mfn2 compared to that in ρ+ cells (dotted line) (n = 3). Note that ρ0 cells expressing Mfn2 restored the cytotoxicity to essentially normal levels. I Quantitation of apoptosis in ρ0 mock-transfected or transfected with Mfn2 compared to that in ρ+ cells (dotted line) (n = 3). Note that ρ0 cells expressing Mfn2 restored the apoptosis to essentially normal levels. J Quantitation of cell viability in Δ-KSS cybrids mock-transfected or transfected with Mfn2 compared to that in WT-KSS cells (n = 3). Note that Δ-KSS expressing Mfn2 showed an increase in cell viability to essentially normal levels. K Quantitation of cytotoxicity in Δ-KSS cybrids mock-transfected or transfected with Mfn2 compared to that in WT-KSS cells (n = 3). Note that Δ-KSS expressing Mfn2 restored the cytotoxicity to essentially normal levels. L Quantitation of apoptosis in Δ-KSS cybrids mock-transfected or transfected with Mfn2 compared to that in WT-KSS cells (n = 3). Note that Δ-KSS cybrids expressing Mfn2 restored the apoptosis to essentially normal levels. RFU relative fluorescence units, RLU relative luminescence units.

Similar articles

Cited by

References

    1. Gorman GS, Chinnery PF, DiMauro S, Hirano M, Koga Y, McFarland R, et al. Mitochondrial diseases. Nat Rev Dis Prim. 2016;2:16080. doi: 10.1038/nrdp.2016.80. - DOI - PubMed
    1. Schaefer AM, McFarland R, Blakely EL, He L, Whittaker RG, Taylor RW, et al. Prevalence of mitochondrial DNA disease in adults. Ann Neurol. 2008;63:35–9. doi: 10.1002/ana.21217. - DOI - PubMed
    1. Moraes CT, Ricci E, Petruzzella V, Shanske S, DiMauro S, Schon EA, et al. Molecular analysis of the muscle pathology associated with mitochondrial DNA deletions. Nat Genet. 1992;1:359–67. doi: 10.1038/ng0892-359. - DOI - PubMed
    1. Attardi G, Yoneda M, Chomyn A. Complementation and segregation behavior of disease-causing mitochondrial DNA mutations in cellular model systems. BBA—Mol Basis Dis. 1995;1271:241–8. doi: 10.1016/0925-4439(95)00034-2. - DOI - PubMed
    1. Sciacco M, Bonilla E, Schon EA, DiMauro S, Moraes CT. Distribution of wild-type and common deletion forms of mtDNA in normal and respiration-deficient muscle fibers from patients with mitochondrial myopathy. Hum Mol Genet. 1994;3:13–19. doi: 10.1093/hmg/3.1.13. - DOI - PubMed

Publication types

MeSH terms

Substances