. 2024 Jun 10;10(1):66.
doi: 10.1038/s41540-024-00391-z.

interFLOW: maximum flow framework for the identification of factors mediating the signaling convergence of multiple receptors

Affiliations

interFLOW: maximum flow framework for the identification of factors mediating the signaling convergence of multiple receptors

Ron Sheinin et al. NPJ Syst Biol Appl. .

Abstract

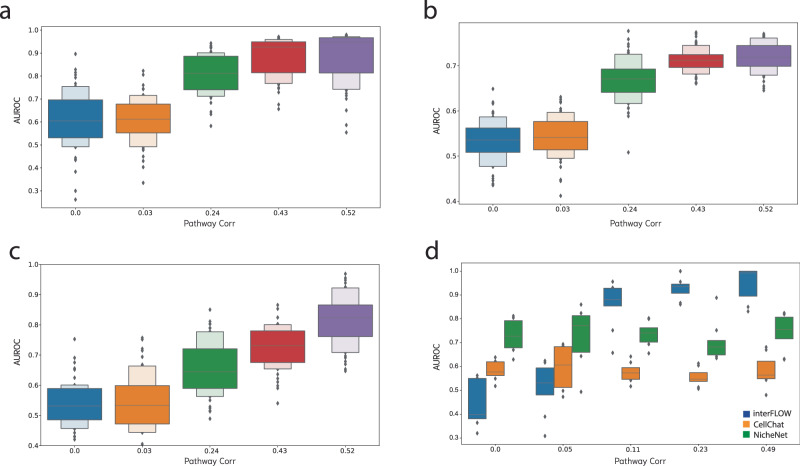
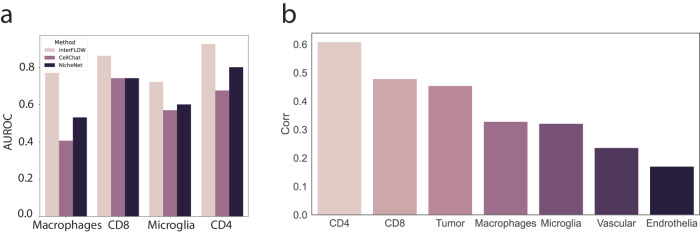
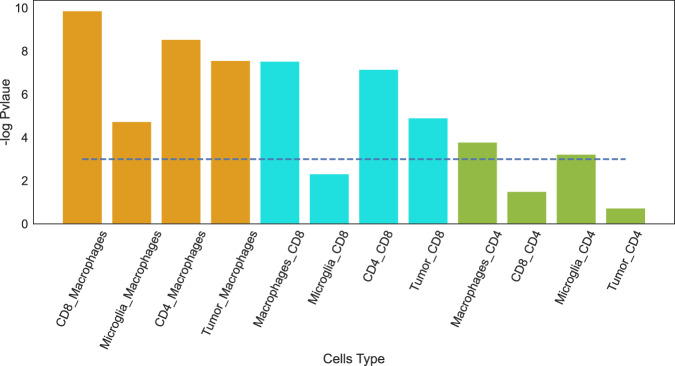
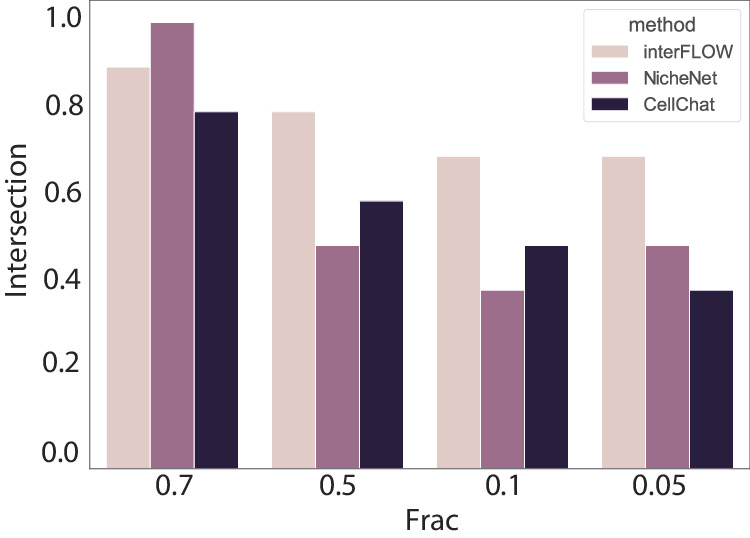
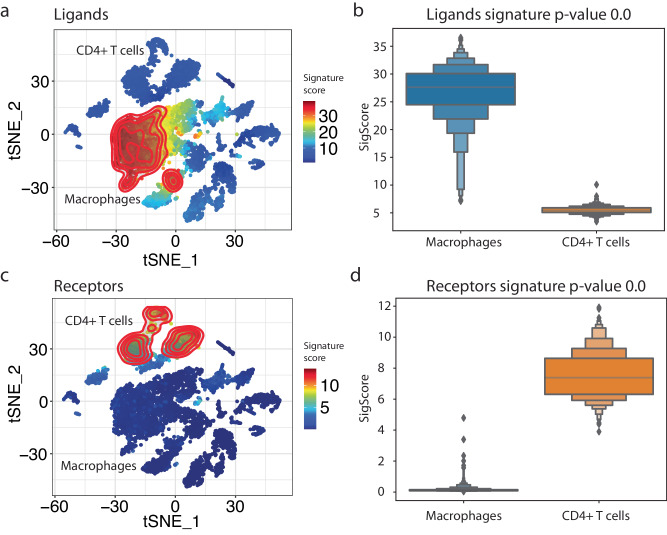
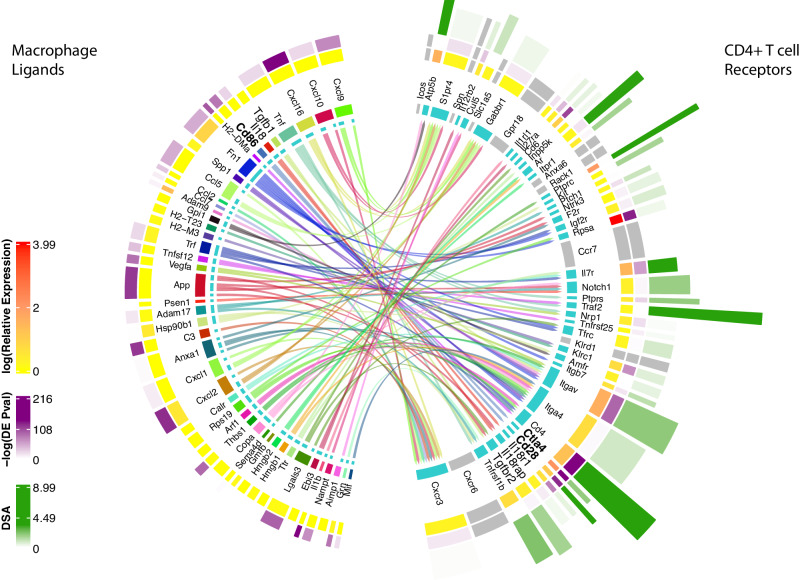
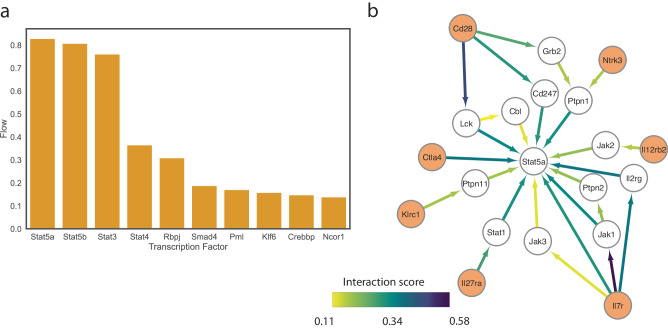
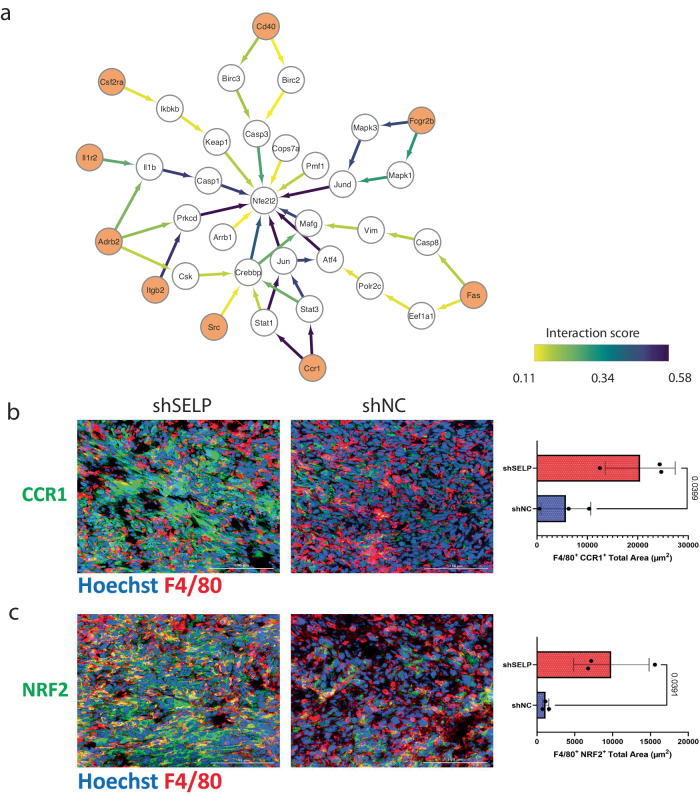
Cell-cell crosstalk involves simultaneous interactions of multiple receptors and ligands, followed by downstream signaling cascades working through receptors converging at dominant transcription factors, which then integrate and propagate multiple signals into a cellular response. Single-cell RNAseq of multiple cell subsets isolated from a defined microenvironment provides us with a unique opportunity to learn about such interactions reflected in their gene expression levels. We developed the interFLOW framework to map the potential ligand-receptor interactions between different cell subsets based on a maximum flow computation in a network of protein-protein interactions (PPIs). The maximum flow approach further allows characterization of the intracellular downstream signal transduction from differentially expressed receptors towards dominant transcription factors, therefore, enabling the association between a set of receptors and their downstream activated pathways. Importantly, we were able to identify key transcription factors toward which the convergence of multiple receptor signaling pathways occurs. These identified factors have a unique role in the integration and propagation of signaling following specific cell-cell interactions.


Conflict of interest statement

R.S.-F. is a board member at TEVA Pharmaceuticals Ltd. And receives unrelated research funding from Merck KGaA. All other authors have no competing interests to declare.

Figures

Fig. 1
Fig. 1. Workflow summary.
interFLOW starts with a normalized, clustered, and annotated scRNAseq dataset. For each cell cluster pair, we define a “signal sender” and a “signal receiver” cluster, then identify ligands and receptors between them. For each receptor, we estimate its potential downstream signaling impact by calculating the maximum flow directed to a group of transcription factors within the Protein-Protein Interaction (PPI) network. The significance of these receptors, along with their converging transcription factors, is assessed using permutation tests. Conclusively, the algorithm determines an average interaction score between clusters, culminating in the construction of a comprehensive global interaction map for the dataset.
Fig. 2
Fig. 2. Simulation results.
Across all plots, the horizontal axis represents the mean Spearman correlation of the genuine downstream activation pathway. a Accurate TF identification through multi-source maximum flow from all receptors to all TFs. b Precise identification of all genes within the authentic downstream activation pathway. c Effective recognition of true receptors using the FLOW score within the signal-receiving cluster. d Comparative assessment of interFLOW, CellChat, and NicheNet’s performance in the identification of genuine receptors within our simulation framework. In panels a–c the 90% and the 10% percentiles are also presented.
Fig. 3
Fig. 3. Validation of converging receptors and TFs.
a AUROC of different methods tasked with the identification cell-type specific receptors. b Spearman correlation between TFs flow score normalized by node degree and the gene target enrichment score per cell type.
Fig. 4
Fig. 4. Validation against MSigDB C7 immunological signature database.
interFLOW was applied to the interaction between each two cell types, and a signature containing significant genes in the receiving cell type was defined. Enrichment of each gene signature associated with the correct corresponding cell type from the MSigDB C7 immunological database was calculated. The blue line represents the significant threshold as -log(0.05) using Fisher exact test.
Fig. 5
Fig. 5. Robustness evaluation.
Intersection between the 10 highest predictions in the full dataset to the highest prediction of the sampled dataset at different fractions.
Fig. 6
Fig. 6. Identification of potential ligand-receptor pairs between macrophage and CD4 + T cell clusters.
a Signature projection of identified receptors on the CD4 + T cell projected on the tSNE space. b Receptors signature distribution and Wilcoxon Rank-Sum p-value results. c Signature projection of identified ligands on the macrophage cells. d Ligands signature distribution and Wilcoxon Rank-Sum p-value results. The bar plots were generated as letter-value plots, better suited for dispelling larger datasets, presenting the following percentiles: 6.25, 12.5, 18.75, 25 (Q1), 31.25, 37.5, 50 (Q2), 62.5, 68.75, 75 (Q3), 81.25, 87.5.
Fig. 7
Fig. 7. Ligand-receptor interaction with integrated receptor downstream activation signaling score.
Detailed analysis of the differentially enriched ligand-receptor interactions between macrophage (signal-sender) and CD4 + T cell (signal-receiving) clusters. Inner lines indicate potential ligand-receptor connections and the width of the inner circle ribbon indicates the number of potential connections. The second circle ribbon reflects the expression level, the third outer ribbon indicates the Wilcoxon Rank-Sum p-value of upregulation compared to all other clusters in the dataset and the outer ribbon indicates the downstream activation score (DSA). Eight receptors that did not show significant value in the permutation test are colored in grey.
Fig. 8
Fig. 8. Identification of downstream signaling converging transcription factors for CD4 T cells.
a A bar plot showing the top-ranking TFs in the interaction between macrophages and CD4 + T cell clusters shown in Fig. 7. b Subnetwork of the flow from multiple receptors (orange) to Stat5 transcription factor. The edge color and width represent the amount of flow that is passing through the edge as a proxy for the significance of the pathway in the subnetwork.
Fig. 9
Fig. 9. Silencing SELP in GL261 glioblastoma tumors alters the macrophages’ co-stimulation of CD4 T cells.
Immunostaining analysis of GL261 glioblastoma tumors showed increased expression of CD86 in macrophages (a) and higher levels of CD28 and pSTAT5 in CD4 + T cells (b, c) in SELP knockdown GL261 tumors (shSELP) compared to the negative control (shNC). For all panels, data are represented as the mean ± s.d. Each dot (N = 3) indicates the average of five fields in the tissue. The analysis was carried out using an unpaired two-tailed T-test.
Fig. 10
Fig. 10. Silencing SELP in GL261 glioblastoma tumors alters macrophage activation.
a Subnetwork of the flow from multiple receptors on macrophages (orange) to Nfe2l2 (NRF2) transcription factor. The edge color and width represent the amount of flow that is passing through the edge as a proxy for the significance of the pathway in the subnetwork. b Immunostaining analysis of GL261 glioblastoma tumors showed increased expression of CCR1 and (c) NRF2 (Nfe2l2) in macrophages in SELP-knockdown GL261 tumors (shSELP) compared to the negative control (shNC). For all panels, data are represented as the mean ± s.d. Each dot (N = 3) indicates the average of five fields in the tissue. The analysis was carried out using an unpaired two-tailed T-test.
Fig. 11
Fig. 11. Global interaction map.
a Global interaction plot, demonstrating interactions between the different clusters in the dataset. Edges radiate from the signal sender cluster to the signal receiving cluster, edge colors and width represent the strength of the interaction. b Top 25 ligand-receptor interactions that were identified as active between multiple cell types in the dataset.

Similar articles

Cited by

References

    1. Fen, M. et al. Applications and analytical tools of cell communication based on ligand-receptor interactions at single cell level. Cell Bio. 11.1, 121 (2021). - PMC - PubMed
    1. Browaeys, R., Saelens, W. & Saeys, Y. NicheNet: modeling intercellular communication by linking ligands to target genes. Nat. Methods10.1038/s41592-019-0667-5 (2020). - PubMed
    1. Jin, S. et al. Inference and analysis of cell-cell communication using CellChat. Nat. Commun.10.1038/s41467-021-21246-9 (2021). - PMC - PubMed
    1. Yeini, E. et al. P-selectin axis plays a key role in microglia immunophenotype and glioblastoma progression. Nat. Commun.10.1038/s41467-021-22186-0 (2021). - PMC - PubMed
    1. Liberzon, A. et al. Molecular signatures database (MSigDB) 3.0. Bioinformatics27 (2011). - PMC - PubMed

MeSH terms