. 2024 Jul;56(7):1371-1376.
doi: 10.1038/s41588-024-01787-7. Epub 2024 Jun 10.

Systematic rare variant analyses identify RAB32 as a susceptibility gene for familial Parkinson's disease

Affiliations

Systematic rare variant analyses identify RAB32 as a susceptibility gene for familial Parkinson's disease

Paul J Hop et al. Nat Genet. 2024 Jul.

Abstract

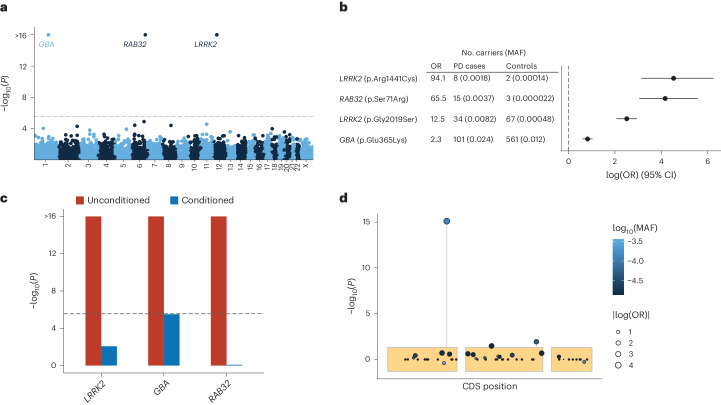
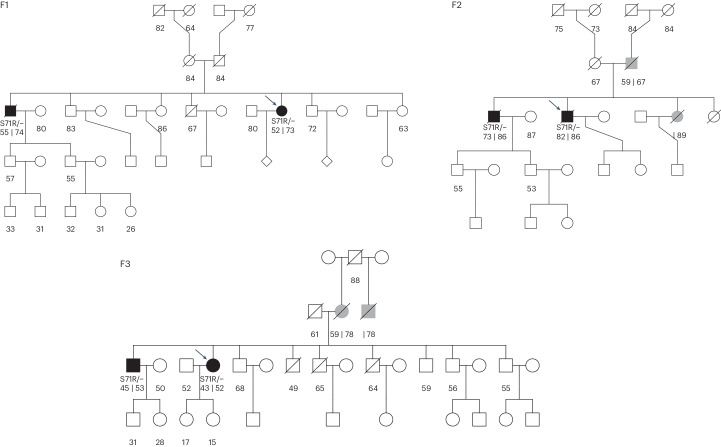
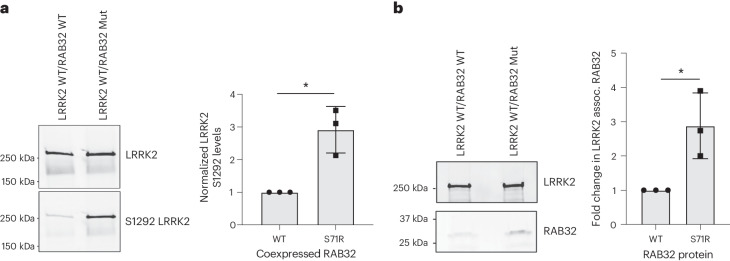
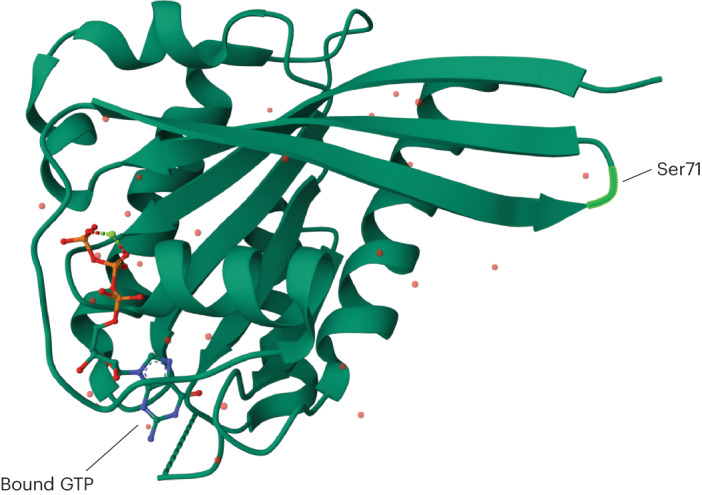
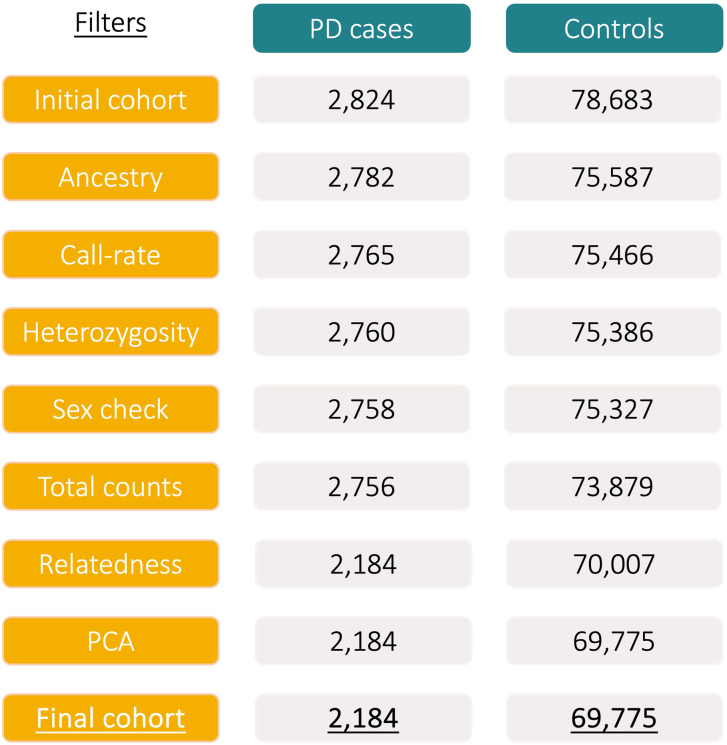
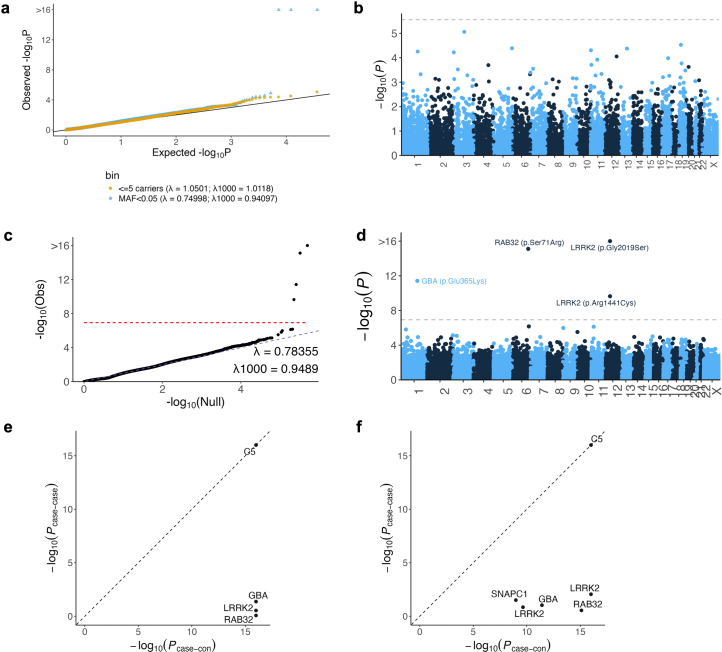
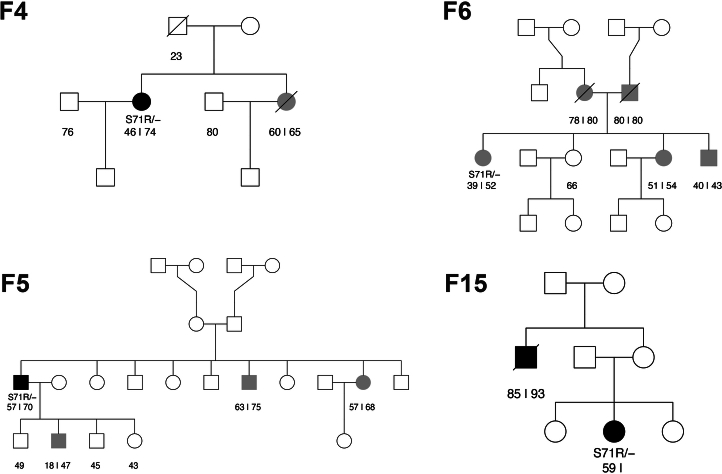
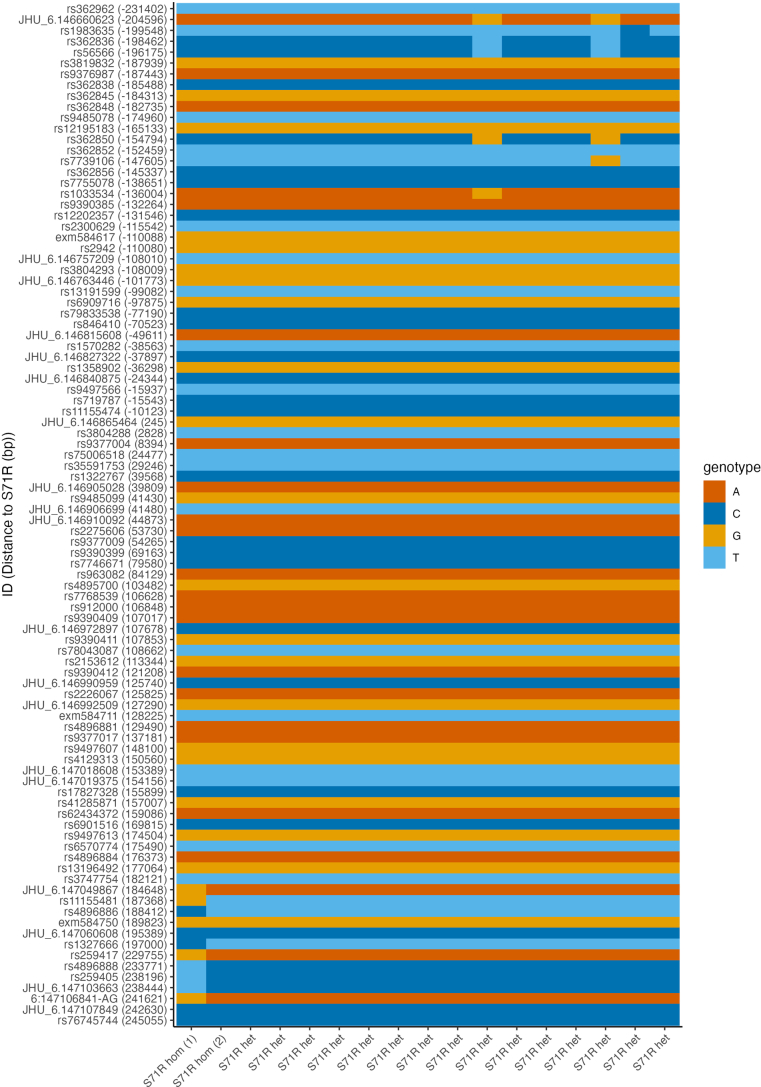
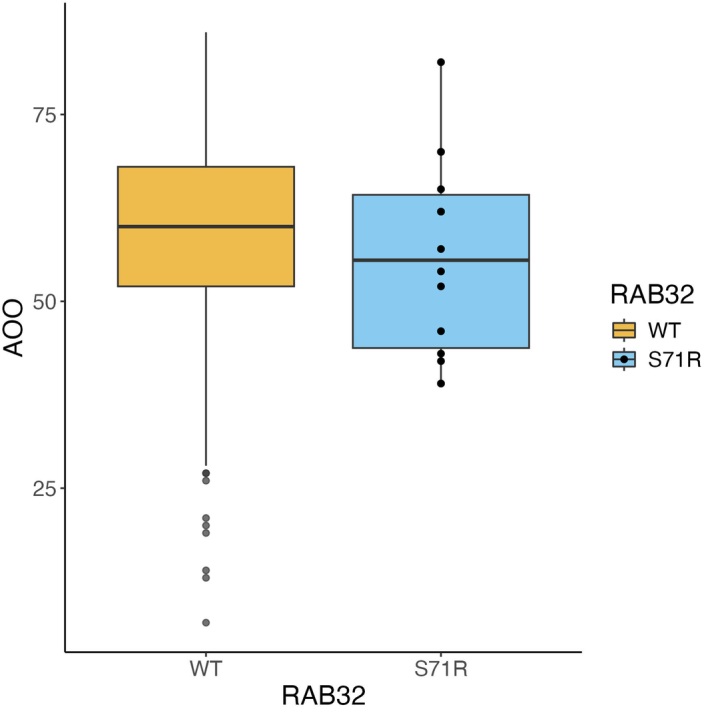
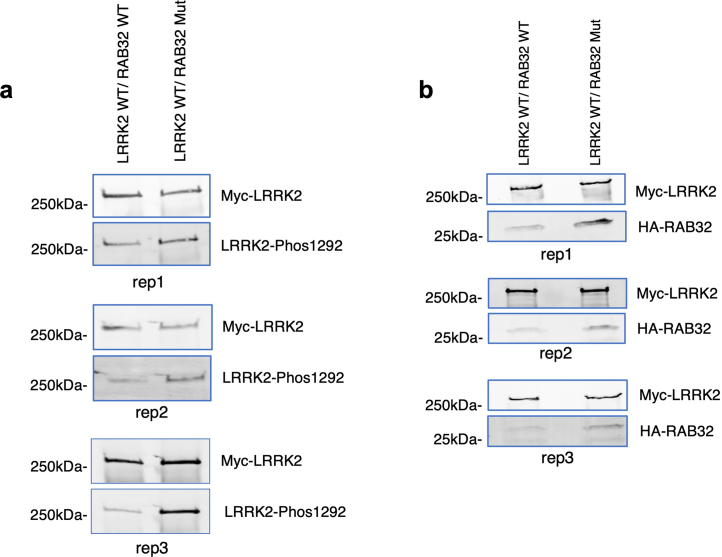
Despite substantial progress, causal variants are identified only for a minority of familial Parkinson's disease (PD) cases, leaving high-risk pathogenic variants unidentified1,2. To identify such variants, we uniformly processed exome sequencing data of 2,184 index familial PD cases and 69,775 controls. Exome-wide analyses converged on RAB32 as a novel PD gene identifying c.213C > G/p.S71R as a high-risk variant presenting in ~0.7% of familial PD cases while observed in only 0.004% of controls (odds ratio of 65.5). This variant was confirmed in all cases via Sanger sequencing and segregated with PD in three families. RAB32 encodes a small GTPase known to interact with LRRK2 (refs. 3,4). Functional analyses showed that RAB32 S71R increases LRRK2 kinase activity, as indicated by increased autophosphorylation of LRRK2 S1292. Here our results implicate mutant RAB32 in a key pathological mechanism in PD-LRRK2 kinase activity5-7-and thus provide novel insights into the mechanistic connections between RAB family biology, LRRK2 and PD risk.


Conflict of interest statement

Z.K.W. serves as principal investigator (PI) or co-PI on Biohaven Pharmaceuticals, Inc. (BHV4157-206) and Vigil Neuroscience, Inc. (VGL101-01.002, VGL101-01.201, positron emission tomography tracer development protocol, Csf1r biomarker and repository project, and ultrahigh field magnetic resonance imaging in the diagnosis and management of CSF1R-related adult-onset leukoencephalopathy with axonal spheroids and pigmented glia) projects/grants. He serves as co-PI of the Mayo Clinic APDA Center for Advanced Research and as an external advisory board member for the Vigil Neuroscience, Inc., and as a consultant on neurodegenerative medical research for Eli Lilli and Company. J.H.V. reports to have sponsored research agreements with Biogen and Astra Zeneca. J.E.L. is a consultant for Illios Therapeutics, WCG Clinical and Biogen. The other authors declare no competing interests.

Figures

Fig. 1
Fig. 1. Rare nonsynonymous gene-based and single-variant analyses in 2,184 PD cases and 69,775 controls identify RAB32, LRRK2 and GBA.
a, The y axis shows the gene-based associations from the ACAT omnibus test including Firth’s logistic regression, SKAT and ACAT-V (two-tailed −log10(P value)) plotted against genomic coordinates on the x axis (GRCh38). The dashed line indicates the exome-wide significance threshold (P = 2.7 × 10−6). b, Estimated odds ratios (OR) (log transformed, x axis) and 95% confidence intervals (CI) of the exome-wide significant single variants obtained from Firth’s logistic regression. c, Conditional analyses (MAF <0.05) of significant genes using the ACAT omnibus test including Firth’s logistic regression, SKAT and ACAT-V (two-tailed). In red are the unconditioned gene associations and in blue are the conditioned gene associations, adjusted for the significant single variants within the respective gene (p.E365K in GBA, p.G2019S and p.R1441C in LRRK2, and p.S71R in RAB32). d, Single-variant associations in RAB32 estimated using Firth’s logistic regression (y axis; two-tailed −log10(P value)), plotted against coding sequence positions (CDS; x axis).
Fig. 2
Fig. 2. Pedigrees of families with multiple sequenced individuals.
Unaffected family members are indicated by white symbols, affected family members with verified PD are indicated by black symbols and family members with nonverified or reported PD are indicated by gray symbols. For individuals with PD, the age of onset is displayed at the left and age at death or last follow-up is displayed on the right (separated by ‘|’). For nonaffected individuals, the age at death or last follow-up is displayed. Probands are indicated by arrows. Pedigrees for which only the proband was sequenced are presented in Extended Data Fig. 6.
Fig. 3
Fig. 3. RAB32 S71R triggers increased LRRK2 kinase activity.
Western blot analyses of cotransfections in HEK293 cells, where Myc-LRRK2 WT was introduced alongside either HA-RAB32 WT or HA-RAB32 S71R. The bar plots show mean ± s.d. a, LRRK2 S1292 phosphorylation; n = 3 biological replicates are shown (two-tailed one-sample t-test, P = 0.02; Extended Data Fig. 9). b, LRRK2 and RAB32 coimmunoprecipitation; n = 3 biological replicates are shown (two-tailed one-sample t-test, P = 0.034; Extended Data Fig. 9). *P < 0.05. Full-length blots are provided as source data. Mut, mutant. Source data
Fig. 4
Fig. 4. Three-dimensional protein structure of RAB32 highlighting the phosphorylation site at Ser71.
Crystal structure of uncomplexed Rab32 in the active GTP-bound state at 2.13 Å resolution,.
Extended Data Fig. 1
Extended Data Fig. 1. Overview of the sample quality control (QC) steps leading to the final cohort of 2,184 individuals with PD and 69,775 controls.
For each filter, the number of samples retained after applying the filter is shown. First, samples of broad European ancestry were retained, then samples were excluded in case of low call rate (<0.9), outlying heterozygosity rate (F < − 0.1 or F > 0.1), genetically predicted sex that did not match reported sex, a deviant number of SNVs, INDELs, singletons or outlying Ti/Tv or SNV/INDEL ratio, ≤2nd degree relatedness (one of each pair is kept) or outlying values on the first five principal components.
Extended Data Fig. 2
Extended Data Fig. 2. Sample QC.
a,b, Projection of all samples onto PCA coordinates of a reference ancestry space comprising 1000 Genomes samples. Grey dots indicate the 81,507 samples included in this study. Colored dots indicate the 1000 Genomes samples, colored by superpopulation label, onto which the study samples were projected. c, Sample call-rate distribution. Samples with a call-rate < 0.9 were excluded. d, Heterozygosity. Samples with F < − 0.1 or F > 0.1 were excluded. e, X-chromosome homozygosity. Samples with ambiguous sex (0.4 < F < 0.6) or where genetically predicted sex did not match reported sex were excluded (F < 0.4 = female; F > 0.6 = male). f, Principal component analysis (PCA). A distinct cluster was identified on the fifth principal component, samples with PC5 < −0.02 were excluded. g, Total variant count distributions. Samples were excluded if nSNV > 4000, nINDEL > 400, nSNV (Singletons) > 250, nINDEL (Singletons) > 100, Ti/Tv ratio < 2.4 or > 3.7 or INDEL/SNV ratio > 0.165.
Extended Data Fig. 3
Extended Data Fig. 3. Principal components analysis of final analysis cohort consisting of 2,184 individuals with PD and 69,775 controls.
a, Principal component 1 and 2. b, Principal component 3 and 4.
Extended Data Fig. 4
Extended Data Fig. 4. Variant quality control.
ad, Calibration of quality score thresholds for variants that pass basic quality control (VQSR-pass, per-supercohort call-rate > 0.9, HWE equilibrium P-value in controls > 0.0001). Plots show the cumulative fraction of variants split by case-control P-value (two-tailed; Firth’s logistic regression). Thresholds were set at inflection points so that the majority of variants were retained while excluding a high proportion of variants strongly associated with case-control status. The following thresholds were applied: QD ≥ 6, MQRankSum ≥ −0.5, FS ≤ 14, and control-control minimum P-value ≥ 0.0001 (two-tailed; Firth’s logistic regression). e, Overview of variant QC steps. The first row shows the total number of called variants, the second row shows the number of variants passing basic QC, and the third row shows the number of variants passing strict QC. The strict QC variant filters were used in all analyses presented in this manuscript.
Extended Data Fig. 5
Extended Data Fig. 5. Rare variant analyses.
a, Quantile-quantile (qq) plot of observed gene two-tailed −log10 (P-values) versus expected two-tailed −log10 (P-values) under the null model. Gene-based associations of low-frequency (MAF < 0.05) variants were estimated using the ACAT omnibus test including Firth’s logistic regression, SKAT and ACAT-V. Gene-based associations of ultra-rare variants (≤5 carriers) were estimated using Firth’s logistic regression. b, Gene-based analysis of ultra-rare (≤5 carriers) non-synonymous variants. The y-axis shows the gene-based associations (two-tailed −log10(P-value)) plotted against genomic coordinates on the x-axis (GRCh38). The dashed line indicates exome-wide significance (P = 2.74 × 10⁻⁶). c, Quantile-quantile (qq) plot of observed single variant two-tailed −log10 (P-values) versus expected two-tailed −log10 (P-values) under the null model. The red dotted line indicates the exome-wide significance threshold (P = 1.17 × 10⁻⁷). λ indicates the observed genomic inflation factor, λ1000 indicates the genomic inflation factor for an equivalent study of 1,000 cases and 1,000 controls. d, The y-axis shows the single variant associations estimated using Firth’s logistic regression (two-tailed −log10(P-value)) plotted against genomic coordinates on the x-axis (GRCh38). The dashed line indicates the exome-wide significance threshold (P = 1.17 × 10⁻⁷). e,f, Significant genes and single variants were screened for technical biases arising from different sequencing centers by testing for an association with sequencing center (n = 1,048 and n = 1,136) among PD cases. The y-axis shows the two-tailed −log10 (P-values) from this case-case analysis compared to the two-tailed −log10 (P-values) from the case-control analysis. Genes and single variants were excluded if Pcase-casePcase-con. In both gene-based (e) and single-variant analyses (f), technical bias was observed in the C5 gene. This was caused by one variant (C5; c.3127 C > A), of which all 44 carriers were sequenced in the same sequencing center.
Extended Data Fig. 6
Extended Data Fig. 6. Pedigrees of families with one sequenced individual.
Unaffected family members are indicated by white symbols, affected family members with verified PD are indicated by black symbols, family members with non-verified or reported PD are indicated by grey symbols. For individuals with PD, age of onset is displayed at the left and age at death or last follow-up is displayed on the right (separated by a ‘|’). For non-affected individuals, the age at death or last follow-up is displayed.
Extended Data Fig. 7
Extended Data Fig. 7. Shared haplotype for RAB32 p.S71R.
The figure shows the shared haplotype in a ± 250-kb window surrounding the p.S71R variant based on common markers on the Infinium Global Diversity Array-8 (available for 16 out of 18 p.S71R carriers). The y-axis shows SNP IDs with the distance to the p.S71R variant in parentheses, and the x-axis shows the p.S71R genotype (both alleles are shown for the homozygous carrier). The minimal common region extends from -131,546 bp downstream to 182,121 bp upstream of the p.S71R variant.
Extended Data Fig. 8
Extended Data Fig. 8. Age of onset (AOO) distribution of RAB32 p.S71R carriers versus RAB32 wild-type patients.
Age at onset was known for 1,414 unrelated individuals. The box edges represent the interquartile range (75th and 25th percentile) with the horizontal line indicating the median. The whiskers extend to 1.5 times the IQR from the box edges. Individual data points beyond the ends of the whiskers are shown for RAB32 wild-type (WT); all individual data points are shown for RAB32 S71R. No statistically significant difference was observed in a linear regression adjusting for cohort (b = −2.7 years, two-tailed P = 0.38).
Extended Data Fig. 9
Extended Data Fig. 9. Western blots for all biological replicates.
a,b, Western blots for all three biological replicates of LRRK2 S1292 phosphorylation (a) and LRRK2 and RAB32 co-immunoprecipitation (b). Full-length blots are provided as Source Data. Source data

Comment in

References

    1. Blauwendraat C, Nalls MA, Singleton AB. The genetic architecture of Parkinson’s disease. Lancet Neurol. 2020;19:170–178. - PMC - PubMed
    1. Rehm HL, et al. ClinGen—the clinical genome resource. N. Engl. J. Med. 2015;372:2235–2242. - PMC - PubMed
    1. Waschbüsch D, et al. LRRK2 transport is regulated by its novel interacting partner Rab32. PLoS ONE. 2014;9:e111632. - PMC - PubMed
    1. McGrath E, Waschbüsch D, Baker BM, Khan AR. LRRK2 binds to the Rab32 subfamily in a GTP-dependent manner via its armadillo domain. Small GTPases. 2021;12:133–146. - PMC - PubMed
    1. Berwick DC, Heaton GR, Azeggagh S, Harvey K. LRRK2 biology from structure to dysfunction: research progresses, but the themes remain the same. Mol. Neurodegener. 2019;14:49. - PMC - PubMed

Substances