. 2024 Jun;26(6):1003-1018.
doi: 10.1038/s41556-024-01428-5. Epub 2024 Jun 10.

Tumour microenvironment programming by an RNA-RNA-binding protein complex creates a druggable vulnerability in IDH-wild-type glioblastoma

Affiliations

Tumour microenvironment programming by an RNA-RNA-binding protein complex creates a druggable vulnerability in IDH-wild-type glioblastoma

Lele Wu et al. Nat Cell Biol. 2024 Jun.

Retraction in

Abstract

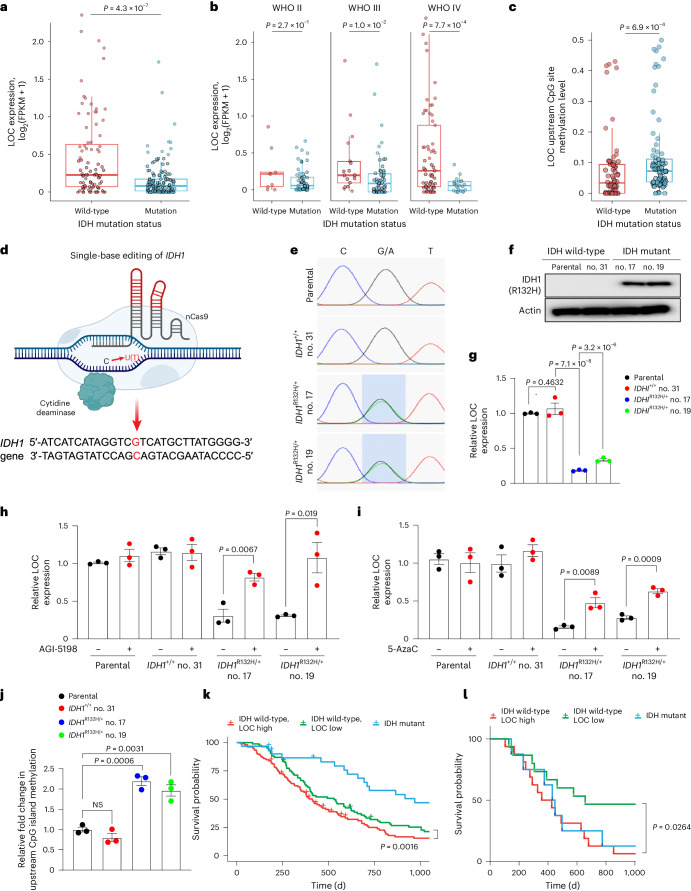
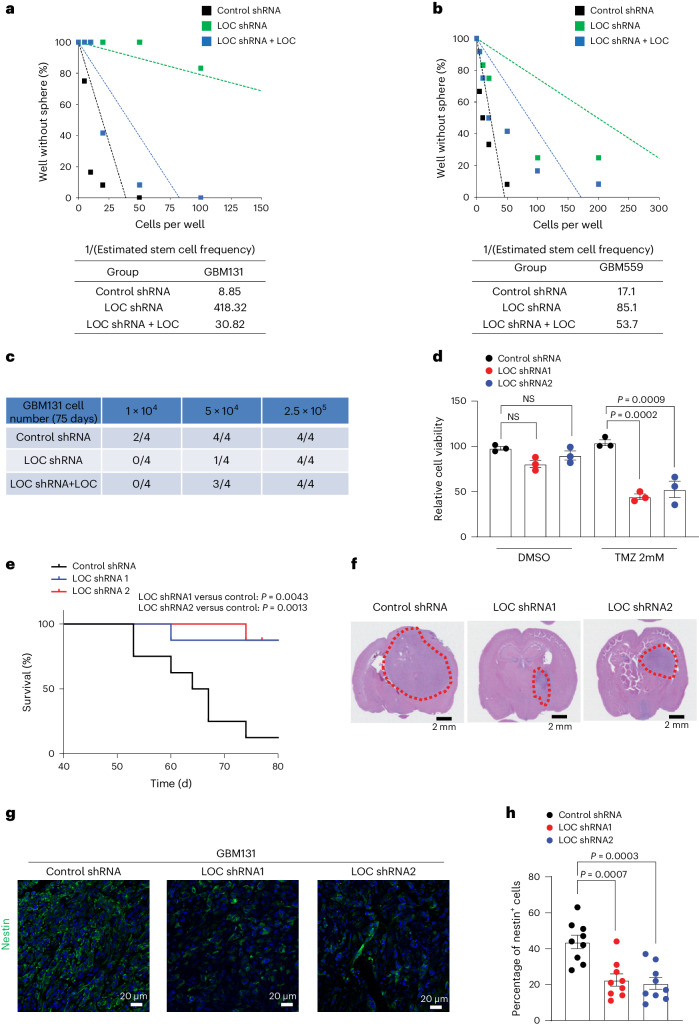
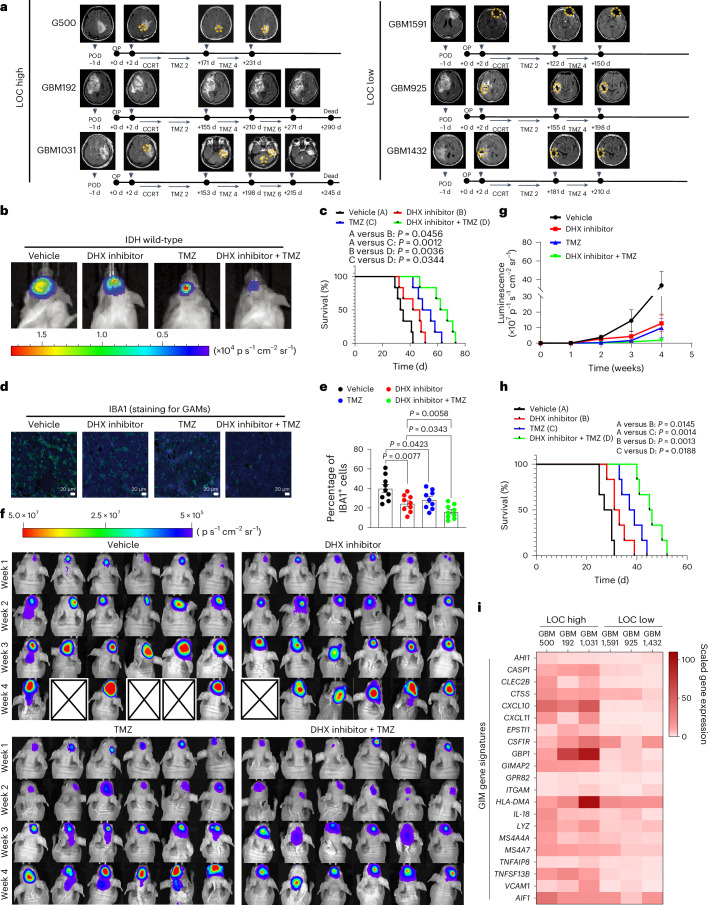
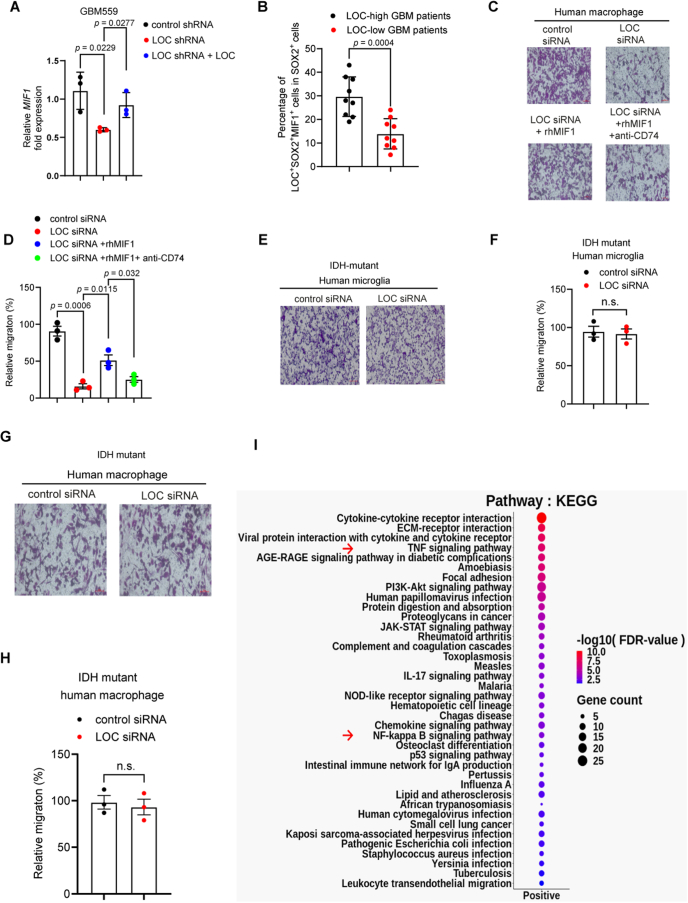
Patients with IDH-wild-type glioblastomas have a poor five-year survival rate along with limited treatment efficacy due to immune cell (glioma-associated microglia and macrophages) infiltration promoting tumour growth and resistance. To enhance therapeutic options, our study investigated the unique RNA-RNA-binding protein complex LOC-DHX15. This complex plays a crucial role in driving immune cell infiltration and tumour growth by establishing a feedback loop between cancer and immune cells, intensifying cancer aggressiveness. Targeting this complex with blood-brain barrier-permeable small molecules improved treatment efficacy, disrupting cell communication and impeding cancer cell survival and stem-like properties. Focusing on RNA-RNA-binding protein interactions emerges as a promising approach not only for glioblastomas without the IDH mutation but also for potential applications beyond cancer, offering new avenues for developing therapies that address intricate cellular relationships in the body.


Conflict of interest statement

The authors declare no competing interests.

Figures

Fig. 1
Fig. 1. Identification of LOC as a vulnerability in IDH-wild-type glioblastoma.
a, Schematic of the experimental design and workflow of data analysis using bulk RNA-seq of 1,018 patients, whole-exome sequencing of 286 patients with glioma and methylation profiling of 159 patients (CGGA cohort). b, Methylation levels of CpG islands upstream of genes with upregulated expression in the IDH-wild-type group compared with the IDH-mutant group. Only significant (P < 0.05) differentially methylated CpG islands were plotted. c, Analysis of the correlation between candidate RNA expression levels and GIM gene signatures (RNA candidates derived from b) for the CGGA bulk RNA-seq data of patients with primary glioblastoma (n = 198). Details of the GIM gene signature are in Supplementary Table 1. The red text indicates those long non-coding RNAs that positively correlate with GIM score. The blue text indicates those long non-coding RNAs that negatively correlate with GIM score. d, GIM score comparison of patients with high and low LOC expression (n = 99 in each group; CGGA cohort). Horizontal lines indicate median value; bottom boundary indicates Q1; top boundary indicates Q3; whiskers extend from the box and show the range of the data. e, Kyoto Encyclopedia of Genes and Genomes pathway analysis of genes with a positive correlation (P < 0.05) with LOC expression. f, Representative images of migration assays. Microglial cells were co-cultured with IDH-wild-type human LN18 cells that had been pretreated with control siRNA, or siRNA to LOC, SNHG18 or WWTR1-AS1. Scale bar, 100 µm. g, Relative migration levels for f. The data represent the mean ± s.e.m. of n = 3 biologically independent samples. hj, Analysis of the correlation between LOC and the microglia markers ITGAM (h), CSF1R (i) and AIF1 (j) using CGGA bulk RNA-seq data of patients with primary glioblastoma (n = 198). FPKM, fragments per kilobase of transcript per million mapped reads. Grey bands indicate 95% confidence intervals for predictions from a Pearson linear model. c,d,gj, P values were determined using Pearson’s correlation test (c,hj), a two-sided Wilcoxon test (d) or a two-tailed Student’s t-test (g). NS, not significant. Source numerical data are provided. Source data
Fig. 2
Fig. 2. LOC expression is regulated by IDH-dependent methylation.
a, LOC expression levels in patients with IDH-wild-type (n = 87) and IDH-mutant (n = 141) gliomas (CGGA cohort). Horizontal lines indicate the median value; bottom boundary indicates Q1; top boundary indicates Q3; whiskers extend from the box and show the range of the data. b, Patients (CGGA cohort) were grouped according to tumour source and WHO grading and the LOC expression levels of the IDH-wild-type and IDH-mutant groups were compared. WHO grade II, IDH wild-type (n = 59) and IDH mutant (n = 9); WHO grade III, IDH wild-type (n = 58) and IDH mutant (n = 17); and WHO grade IV, IDH wild-type (n = 24) and IDH mutant (n = 61). Horizontal lines indicate the median value; bottom boundary indicates Q1; top boundary indicates Q3; whiskers extend from the box and show the range of the data. c, Methylation levels of the CpG island (cg23512958) upstream of LOC in IDH-wild-type (n = 64) and IDH-mutant (n = 81) tumour samples (CGGA cohort). ssGSEA, single-sample gene set enrichment analysis. Horizontal lines indicate median value; bottom boundary indicate Q1; top boundary indicates Q3; whiskers extend from the box and show the range of the data. d, Schematic of the process to generate IDH-mutant cells using single-base editing technology. e, Sanger sequencing was used to verify successful base editing of IDH-wild-type LN18 cells to generate the IDH-mutant heterozygotes. f, Protein lysates from LN18 IDH-wild-type and IDH-mutant clones were analysed by western blot using anti-IDH1(R132H). g, LOC expression levels, determined by qPCR, of the LN18 IDH-wild-type and IDH-mutant clones. h, LOC expression levels, determined by qPCR, of LN18 IDH-wild-type and IDH-mutant clones following treatment with or without 10 μM AGI-5198. i, LOC expression levels, determined by qPCR, of IDH-wild-type and IDH-mutant clones following treatment with or without 10 μM 5-AzaC. j, Methylation profiling of the upstream CpG island of LOC of the different clones (determined using digestion with methylation-sensitive restriction enzymes and real-time PCR). gj, The data represent the mean ± s.e.m. of n = 3 biologically independent samples. k, Kaplan–Meier survival curve of patients in the CGGA cohort with IDH-mutant or IDH-wild-type glioblastomas with high or low LOC expression. l, Kaplan–Meier survival curve of patients in the SMC cohort with glioblastoma, grouped as in k. P values were determined using the Wilcoxon rank-sum test (ac), a two-tailed Student’s t-test (gj) or a log-rank test (k,l). Source numerical data and unprocessed blots are provided. Source data
Fig. 3
Fig. 3. LOC levels correlate with infiltration of GAMs in glioblastoma.
a, The t-distributed stochastic neighbor embedding (t-SNE) plot representation of all cell populations detected in patients in the CGGA cohort with glioblastoma as well as one patient with lung squamous cell carcinoma with brain metastasis (used as a control). b, Relative proportions of each cell type, colour-coded as in a, in six patients with glioblastomas and low (S3, S13 and S5) or high (S7, S4 and S2) LOC expression. c, Relative cell-type proportion in patients with low or high LOC expression; n = 3 biological independent samples. Horizontal lines represent the median value; bottom boundary indicates Q1; top boundary indicates Q3; whiskers extend from the box and show the range of the data. d, Immunofluorescence staining of the GAM marker IBA1 in tissue sections from patients in the LOC low and LOC high groups. e, The t-SNE plot representation of all cell populations detected in a patient with glioblastoma. This dataset was downloaded from the 10X Genomics website. f, LOC expression distribution in all cell clusters. g, In situ hybridization (RNAscope) assay for LOC, followed by sequential immunofluorescence with the cancer cell marker and downstream target MIF1 in patients with glioblastoma and high (left) or low (right) LOC levels. h, Proportion of LOC+cells in the total SOX2+ subpopulations of the two patient groups (determined from g). i, In situ hybridization (RNAscope) assay for LOC, followed by sequential immunofluorescence with GAM marker, of patients with glioblastoma and high (left) or low (right) LOC levels. j, Proportion of LOC+IBA1+ cells in the two patient groups (determined from i). k, Proportion of GAMs (IBA1+) in the two patient groups (determined from i). gk, The data represent the mean ± s.e.m.; n = 3. c,h,j,k, P values were determined using a two-tailed Student’s t-test. DAPI, 4′,6-diamidino-2-phenylindole. Source numerical data are provided. Source data
Fig. 4
Fig. 4. Identifying how LOC regulates TME reshaping.
a, Mean expression levels of the top ten ligand–receptor interaction pairs involved in GAM–cancer cell crosstalk. The red arrow points to the MIF–CD74 pair. P values for the likelihood of cell-type enrichment of each ligand–receptor complex were determined by calculating the proportion of the means that were as high as or higher than the actual mean. b, MIF1 expression levels, determined using qPCR, in glioblastoma patient-derived cells (GBM131) following LOC knockdown (LOC shRNA) with or without LOC overexpression (LOC shRNA + LOC). c, Representative images of migration assays for the indicated groups. Microglia cells were co-cultured with IDH-wild-type LN18 cells that had been pretreated with control siRNA, or siRNA to LOC with or without rhMIF1 and anti-CD74. Scale bar, 100 µm. d, Relative migration levels for c. e, LN18 LOCWT and LOCpKO cells were treated with TNF-α for the indicated time periods and endogenous DHX15 or p65 was immunoprecipitated with the appropriate antibody. Input and immunoprecipitate samples were analysed by subsequent immunoblot for the indicated proteins; p-p65, phosphorylated NF-κB p65 subunit; p-p38, phosphorylated p38. f, LOCWT and LOCpKO 293T cells were transfected with control vector (Ctrl vector) or Flag–DHX15 as indicated. DHX15 was immunoprecipitated with anti-Flag and co-purified proteins were analysed by western blotting using antibodies to Wip1 and Flag. g, Flag-tagged wild-type DHX15 (DHX15WT), the helicase-dead DHX15-D260A mutant (DHX15Mut) or control vector (Ctrl vector) were ectopically expressed in 293T cells, which were then stimulated with TNF-α for the indicated time periods. DHX15 was immunoprecipitated using anti-Flag and the co-purified proteins were analysed by western blotting. h, Representative images of migration assays for the indicated groups. Microglia cells were co-cultured with IDH-wild-type LN18 cells. The LN18 cells were pretreated with dimethyl sulfoxide (DMSO) or DHX inhibitor with or without added rhMIF1 and anti-CD74. Scale bar, 100 µm. i, Relative migration levels for h. b,d,i, The data represent the mean ± s.e.m. of n = 3 biologically independent samples. P values were calculated using a two-tailed Student’s t-test. IP, immunoprecipitate; ctrl, control. Source numerical data and unprocessed blots are provided. Source data
Fig. 5
Fig. 5. LOC promotes glioblastoma tumorigenesis.
a,b, In vitro LDA assay for tumorsphere formation for GBM131 (a) and GBM559 (b) cells (derived from patients with primary glioblastoma) with LOC knockdown with or without LOC overexpression. LDA clonogenic significance was measured by linear regression analysis. c, In vivo LDA for tumorsphere formation in GBM131 cells with LOC knockdown with or without LOC overexpression. Mice were implanted with different numbers of cancer cells (1 × 104, 5 × 104 or 2.5 × 105). The ratios indicate the tumor engraftment rate of GBM131 cells with LOC knockdown with or without LOC overexpression. d, Cells derived from patients with primary glioblastoma were infected with control shRNA or one of two independent shRNA targeting LOC and treated with DMSO or TMZ. Cell viability was measured using an ATPlite assay and data were normalized to the DMSO-treated control shRNA-transduced cells. e, Patient-derived glioblastoma cells were infected with control shRNA, LOC shRNA1 or LOC shRNA2 vectors and then injected into mice (n = 8), which were analysed for survival. f, Representative haematoxylin and eosin-stained sections of the mouse brains from e. The red lines delineate tumours. g, Immunofluorescence images of orthotopic model-derived tumour samples stained with nestin. h, Proportion of cells in g that were nestin+; three fields per sample. d,h, The data represent the mean ± s.e.m. of n = 3 biologically independent samples. d,e,h, P values were determined using a two-tailed Student’s t-test (d,h) or two-sided log-rank test (e). Source numerical data are provided. Source data
Fig. 6
Fig. 6. LOC/Gm16685 deletion in both compartments boosts tumour regression.
a, Summary of the syngeneic glioblastoma mouse model. GL261-Luc-Gm16685WT or GL261-Luc-Gm16685pKO cells were administered to Gm16685+/+ and Gm16685−/− mice via stereotactic injection. Tumour formation was monitored by bioluminescence imaging. +, active promoter status of Gm16685; −, inactive promoter status of Gm16685. b, Tumour formation for the four groups described in Fig. 6a was measured using the in vivo imaging system. Representative bioluminescence images of tumours, showing differences in size, in the indicated groups. c, Kaplan–Meier survival analysis of the mice in the different groups of the syngeneic model (Group A, n = 8; Group B, n = 6; and Groups C and D, n = 7 mice). d, Immunofluorescence staining of IBA1 in syngeneic model-derived tumour samples. Scale bar, 20 µm. e, Proportion of IBA1+ cells in the indicated groups. The data represent the mean ± s.e.m. of n = 3 biologically independent samples; three fields for each sample. f, Representative bioluminescence images of tumours, showing their size, in mice from the groups indicated in Extended Data Fig. 9a; n = 6. c,e, P values were determined using the Gehan–Breslow–Wilcoxon test (c) or a two-tailed Student’s t-test (e). Source numerical data are provided. Source data
Fig. 7
Fig. 7. LOC–DHX15 is a targetable vulnerability in IDH-wild-type glioblastoma.
a, MRI images of the cranium of patients with glioblastoma (SMC cohort) in each group (n = 3 per group) before (POD), on the day of (OP) and after surgical dissection, followed by TMZ and chemoradiation therapy treatment (CCRT). Treatment histories and tumour phylogenies of patients with high (GBM500, GBM192 and GBM1031; left) and low (GBM1591, GBM925 and GBM1432; right) LOC expression. Black circles on the bar represent days on which the presented MRI scans were obtained. The yellow circle indicates the area where tumour tissue was resected. A time line (in days) has been provided (−1 d to +245 d). b, Tumour formation (IDH-wild-type LN18 cells based) for the four groups (vehicle group, DHX inhibitor group, TMZ group and DHX inhibitor + TMZ combination group) was measured using the in vivo imaging system. In vivo bioluminescence images of mice from the orthotopic xenograft model (established from IDH-wild-type LN18 cells) treated with DHX inhibitor, TMZ or both in combination. c, Kaplan–Meier survival analysis of the mice from b. d, Immunofluorescence staining of IBA1 in tumour samples from the glioblastoma xenograft model with combinational therapy (b; n = 3). Scale bar, 20 µm. e, Proportion of IBA1+ cells in the indicated treatment groups. The data represent the mean ± s.e.m. of n = 3 biologically independent samples; three fields per sample. f, Tumour formation (patient-derived IDH-wild-type glioblastoma cells based) for the four groups (vehicle group, DHX inhibitor group, TMZ group and DHX inhibitor + TMZ combination group) was measured using the in vivo imaging system. In vivo bioluminescence imaging of mice from the orthotopic xenograft model (established from patient-derived IDH-wild-type glioblastoma cells) treated with DHX inhibitor, TMZ or both in combination. g, Luminescence intensity for the mice in f. h, Kaplan–Meier survival analysis of the mice from f. b,c,fh, n = 6. i, GIM gene signature comparison between the LOC high (GBM500, GBM192 and GBM1031) and LOC low groups (GBM1591, GBM925 and GBM1432). All six patients are from the SMC cohort. c,e,g,h, P values were determined using a two-tailed Student’s t-test (e,g) or Gehan–Breslow–Wilcoxon test (c,h). Source numerical data are provided. Source data
Extended Data Fig. 1
Extended Data Fig. 1. LOC was characterized as a RNA.
a–c) qPCR analysis of LOC expression (a), SNHG18 expression (b), and WWTR1-AS1 expression (c) in LN18 cells treated with control siRNA or siRNAs targeting LOC, SNHG18 or WWTR1-AS1. d, Representative images of migration assays for macrophage (THP-1 derived) from the indicated group. e) Quantification of relative migration for d. The data represent means ± s.e.m. of n = 3 biologically independent samples. f) Schematic view of LOC location in the genome. LOC promoter was highlighted by blue box. g,h, PCR products from 3’ and 5’ RACE were cloned into plasmid and Sanger sequenced. DNA chromatogram of LOC 3’ and 5’ end sites after RACE are shown for 3’ RACE together with Poly-A tail (g) and 5’ RACE together with experimentally added poly-A sequenced via terminal transferase enzyme (h). i) Upstream and downstream boundaries of LOC. Pink highlighted sequences: 5’ boundary sequences obtained from RACE; green highlighted sequence: NCBI gene boundaries; dotted line: continuation of NCBI gene boundaries to 3’ site; and yellow highlighted sequence: 3’ boundary sequences obtained from RACE. Source numerical data are available in source data. Source data
Extended Data Fig. 2
Extended Data Fig. 2. MIF1 is a crucial downstream target of LOC.
a) qPCR analysis of MIF1 expression in glioblastoma patient-derived cells (GBM559) with LOC knockdown (LOC shRNA) or with LOC overexpression in LOC-deficient group (LOC shRNA + LOC). The data represent means ± s.e.m. of n = 3 biologically independent samples. b) Quantification of LOC+SOX2+MIF1+ cells in total SOX2+ cells in LOC-high and LOC-low GBM patients for Fig. 3g. The data represent means ± s.e.m. n = 3. c) Representative images of migration assays from the indicated group. Macrophages were co-cultured with IDH-wildtype cells LN18 which were pretreated with control siRNA, LOC siRNA, LOC siRNA plus human recombinant MIF1, LOC siRNA plus human recombinant MIF1 and anti-CD74 antibody. d) Quantification of relative migration for c. The data represent means ± s.e.m. of n = 3 biologically independent samples. e) Representative images of migration assays from the indicated group. Microglial cells were co-cultured with IDH-mutant cells. IDH-mutant cells were pretreated with control siRNA or LOC siRNA. f) Quantification of relative migration for e). The data represent means ± s.e.m. of n = 3 biologically independent samples. g) Representative images of migration assays from the indicated group. Macrophages were co-cultured with IDH-mutant cells. IDH-mutant cells were pretreated with control siRNA or LOC siRNA. h) Quantification of relative migration for g. The data represent means ± s.e.m. of n = 3 biologically independent samples. i) Over-representation test of KEGG pathways by using genes with positive correlation (R ≥ 0.5) to LOC expression. Source numerical data are available in source data. p-values: a,b,d,f,h, two-tailed Student’s t-test. Source data
Extended Data Fig. 3
Extended Data Fig. 3. GAM derived TNFα plays a key role in GBM-GAM symbiosis.
a,b) Luminex assays for human microglia culture medium (a) or mouse microglia culture medium (b). Human microglia were co-cultured with LN18 cells transfected with control or LOC siRNA. Mouse microglia were co-cultured with GL261 cells transfected with control or Gm16685 siRNA. The data represent means ± s.e.m. of n = 3 biologically independent samples. c) Gene expression was analysed by qPCR for TNFα for the indicated group. Microglia cells were co-cultured with glioblastoma cells LN18 (pretreated with control siRNA, LOC siRNA, LOC siRNA plus rhMIF1). The data represent means ± s.e.m. of n = 3 biologically independent samples. d) Schematic view of LOC promoter (highlighted by blue box) targeting with CRISPR–Cas9 editing (inside IL7-intron). NF-κB binding motifs were shown as yellow in the promoter region of LOC. e,f) LN18 LOCWT and LOCpKO cells were stimulated with TNFα for the indicated duration. Gene expression was analysed by qPCR for (e) LOC, (f) MIF1. The data represent means ± s.e.m. of n = 3 biologically independent samples. Source numerical data are available in source data. p-values: ac,e,f, two-tailed Student’s t-test. Source data
Extended Data Fig. 4
Extended Data Fig. 4. Identification of DHX15 as a binding partner of LOC.
a) Schematic representation of RNA pulldown experiment to identify LOC specific interactor proteins. b) Confirmation of Dyskerin (DKC) protein and Terc RNA interaction by western blot upon Terc pull down. c,d) List of filtered LOC candidate interacting proteins. Numbers represent the Exclusive Unique Peptide Count. e) Kaplan–Meier survival curve of glioblastoma patients from DHX15 high-expression (n = 109) or DHX15 low-expression group (n = 112). f) LOC–MS2 or Terc–MS2 vectors were co-transfected with MS2-GFP vector into 293T cells. 48 hours later IP was carried out using GFP antibody and analysed by western blotting using indicated antibodies. Input shows the levels of relevant proteins. Source unprocessed blots are available in source data. p-values: e, log-rank test. Source data
Extended Data Fig. 5
Extended Data Fig. 5. Identification of key interaction sites of LOC with DHX15.
a) Cross-Linking Immunoprecipitation (CLIP)-qPCR was performed to identify DHX15 interacting RNAs by immunoprecipitation of Flag-DHX15. Graph shows the fold enrichment of regions immunoprecipitated by Flag-DHX15 over control vector. n = 3 biologically independent experiments. Data are presented as means values +/- SEM. b) CLIP-qPCR primers were illustrated for LOC and Terc genes. 12 sets of primers were designed for tilling the entire LOC transcript from fragment F1 to F12. For the control Terc, 4 sets of primers were designed for tilling Terc. c) Sanger sequencing analysis of conserved 3’ end of LOC and Gm16685 is shown. d) The list of all the mutant versions of DHX15 from LOCMut1 to LOCMut5. e) Control vector (Ctrl Vector), full length of WT LOC fused with MS2 (LOCWT) or mutant 1–5 of LOC (LOCMut1 to LOCMut5) fused with MS2 were co-transfected with MS2-GFP vector into 293T cells. 48 hours later immunoprecipitation was carried out using GFP antibody and analysed by western blotting using indicated antibodies. Input shows the levels of relevant proteins. f,g) Minimum free energy (MFE) secondary structure predictions (using RNAfold tools: http://rna.tbi.univie.ac.at/cgi-bin/RNAWebSuite/RNAfold.cgi) of LOCWT (f) and LOCMut2 (g). Source numerical data are available in source data. p-values: a, two-tailed Student’s t-test. Source data
Extended Data Fig. 6
Extended Data Fig. 6. DHX15 executes its action through LOC.
a) Schematic diagram showing the domain structure of DHX15 and site of point mutation D260A. Conserved domains of DHX15 are annotated as N-terminus (N-term), RecA1 and RecA2, winged helix (WH), helical-bundle (HB) and oligonucleotide/oligosaccharide-binding fold (OB) domains. b) LN18 LOCWT and LOCpKO cells transfected with control vector (Ctrl Vector) or Flag-tagged-WT-DHX15 (DHX15WT) or Flag-tagged-mut-DHX15 (DHX15Mut) and stimulated with TNFα for 3 h. Transfection was analysed by western blot. c) NFκB downstream target MIF1 expression were analysed by qPCR for the indicated group. Data was normalized to actin. The data represent means ± s.e.m. of n = 3 biologically independent samples. d) Representative images of migration assays from the indicated group. Macrophages were co-cultured with IDH-wildtype cells LN18. LN18 cells were pretreated with DMSO, DHX inhibitor, DHX inhibitor plus recombinant human MIF1(rhMIF1), DHX inhibitor plus rhMIF1 and anti-CD74 antibody. e) Quantification of relative migration for d. The data represent means ± s.e.m. of n = 3 biologically independent samples. f) Representative images of migration assays for the indicated group. Microglial cells were co-cultured with IDH-mutant cells. IDH-mutant cells were pretreated with DMSO or DHX inhibitor. g) Quantification of relative migration for f. The data represent means ± s.e.m. of n = 3 biologically independent samples. h) Representative images of migration assays for the indicated group. Macrophages were co-cultured with IDH-mutant cells. IDH-mutant cells were pretreated with DMSO or DHX inhibitor). i) Quantification of relative migration for h. The data represent means ± s.e.m. of n = 3 biologically independent samples. Source numerical data and unprocessed blots are available in source data. p-values: c,e,g,i, two-tailed Student’s t-test. Source data
Extended Data Fig. 7
Extended Data Fig. 7. LOC promotes stemness both in vitro and in vivo.
a) Representative tumour images at different time points of IDH1 WT GBM patient-derived orthotopic xenograft models: control group, LOC knockdown (LOC shRNA) group and LOC overexpressed (LOC-OE) group. Patient derived glioblastoma cells were infected with control shRNA, LOC shRNA and LOC overexpression vectors. Cells with LOC knockdown or overexpression were injected to mice (n = 6). b) Quantification of luminescence signal from a. n = 6. Data are presented as means values +/- SEM. c) Kaplan–Meier survival analysis of IDH1 WT GBM patient-derived orthotopic xenograft models: control group, LOC knockdown (LOC shRNA) group and LOC overexpressed (LOC-OE) group. d) Immunostaining of GAM marker IBA1 using the brain sections from A). n = 3. e) Quantification of IBAI+ for the staining results from d. n = 3 (3 fields for each sample). Data are presented as means values +/- SEM. Source numerical data are available in source data. p-values: b,e, two-tailed Student’s t-test; c, Gehan-Breslow-Wilcoxon test. Source data
Extended Data Fig. 8
Extended Data Fig. 8. Gm16685 knockout mouse cancer cells were generated.
a) Schematic view of Gm16685 location in the genome. Gm16685 promoter was highlighted by blue box. NFκB binding motifs in the promoter region of Gm16685 were indicated by yellow box. b) qPCR analysis of Gm16685 expression in GL261-Luc-Gm16685WT and GL261-Luc-Gm16685pKO cells with or without TNFα treatment. The data represent means ± s.e.m. of n = 3 biologically independent samples. c) quantification of luminescence intensity obtained from Fig. 6b. n = 6 biologically independent animals. Data are presented as means values +/- SEM. d) Gating strategy of the Flow cytometric analysis for GAMs (CD45+CD11b+). CD45-FITC and CD11b-PE antibodies were used. e) Flow cytometric analysis of GAMs (CD45+CD11b+) from syngeneic mouse model: injecting WT GL261 cells into WT mice (WT-WT), injecting Gm16685 KO GL261 cells into WT mice (KO-WT), injecting WT GL261 cells into KO mice (WT-KO), injecting Gm16685 KO GL261 cells into KO mice (KO-KO). f) Quantification of GAMs (CD45+CD11b+) in those 4 conditions: WT-WT, KO-WT, WT-KO, KO-KO. n = 3. Data are presented as means values +/- SEM. Source numerical data and unprocessed blots are available in source data. p-values: b,c,f, two-tailed Student’s t-test. Source data
Extended Data Fig. 9
Extended Data Fig. 9. GAM-derived LOC/Gm16685 promote GBM progression.
a) The summary of syngeneic GBM mouse model. Tumour formation was monitored by bioluminescence imaging. b) Quantification of bioluminescence signal intensity obtained from Fig. 6f. n = 6. Data are presented as means values +/- SEM. c) Flow cytometric analysis of GAMs (CD45+CD11b+) for the indicated group from syngeneic mouse model from a. d) Quantification of GAMs (CD45+CD11b+) for c. n = 3. Data are presented as means values +/- SEM. Source numerical data are available in source data. p-values: b,d, two-tailed Student’s t-test. Source data
Extended Data Fig. 10
Extended Data Fig. 10. DHX inhibitor synergize with standard of care.
a) Representative in vivo bioluminescence imaging of orthotopic models established from IDH-wildtype group with or without DHX inhibitor treatment. b) Representative in vivo bioluminescence imaging of orthotopic models established from IDH-mutant group with or without DHX inhibitor treatment. c) Quantification of bioluminescence signal intensity obtained from a. n = 6 biologically independent animals. d) Quantification of bioluminescence signal intensity obtained from b. n = 6 biologically independent animals. e) Kaplan–Meier survival analysis of the mice from a. n = 6. f) Kaplan–Meier survival analysis of the mice from b. n = 6. g) Quantification of bioluminescence signal intensity obtained from a. n = 6 biologically independent animals. h) The calculation of synergism in combination of DHX inhibitor and TMZ in our study. i) IDH-wildtype and IDH-mutant LN18 cells were treated with or without DHX inhibitor. DHX15 or p65 was immunoprecipitated with antibody against DHX15 or p65. IP samples were analysed by subsequent immunoblot for the indicated proteins. j) IDH-wildtype and IDH-mutant LN18 cells were transfected with control vector (Ctrl Vector) or expression vectors of LOC (LOCWT) or mutant version of LOC (LOCMut2). After 48 hours, cells were harvested and endogenous DHX15 or p65 was immunoprecipitated with antibody against DHX15 or p65. IP samples were analysed by subsequent immunoblot for the indicated proteins at the indicated time points. Source numerical data and unprocessed blots are available in source data. p-values: e,f, Gehan-Breslow-Wilcoxon test; c,d,g, two-tailed Student’s t-test. Source data

References

    1. Ostrom, Q. T. et al. CBTRUS statistical report: primary brain and other central nervous system tumors diagnosed in the United States in 2011-2015. Neuro Oncol.20, iv1–iv86 (2018). - PMC - PubMed
    1. Weller, M. et al. EANO guidelines on the diagnosis and treatment of diffuse gliomas of adulthood. Nat. Rev. Clin. Oncol.18, 170–186 (2021). - PMC - PubMed
    1. Jiang, T. et al. Clinical practice guidelines for the management of adult diffuse gliomas. Cancer Lett.499, 60–72 (2021). - PubMed
    1. White, K. et al. New hints towards a precision medicine strategy for IDH wild-type glioblastoma. Ann. Oncol.31, 1679–1692 (2020). - PubMed
    1. Mantovani, A., Marchesi, F., Malesci, A., Laghi, L. & Allavena, P. Tumour-associated macrophages as treatment targets in oncology. Nat. Rev. Clin. Oncol.14, 399–416 (2017). - PMC - PubMed

Publication types

MeSH terms