Clinical Trial
. 2024 Jul;30(7):2037-2048.
doi: 10.1038/s41591-024-03018-2. Epub 2024 Jun 10.

Triple hormone receptor agonist retatrutide for metabolic dysfunction-associated steatotic liver disease: a randomized phase 2a trial

Affiliations
Clinical Trial

Triple hormone receptor agonist retatrutide for metabolic dysfunction-associated steatotic liver disease: a randomized phase 2a trial

Arun J Sanyal et al. Nat Med. 2024 Jul.

Abstract

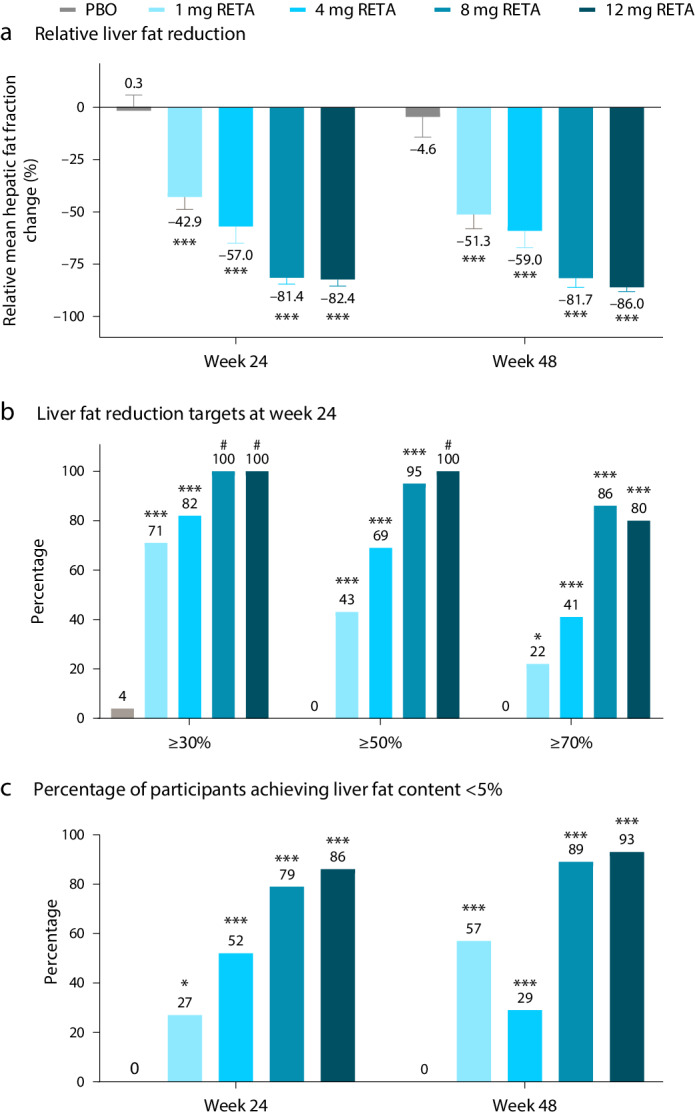
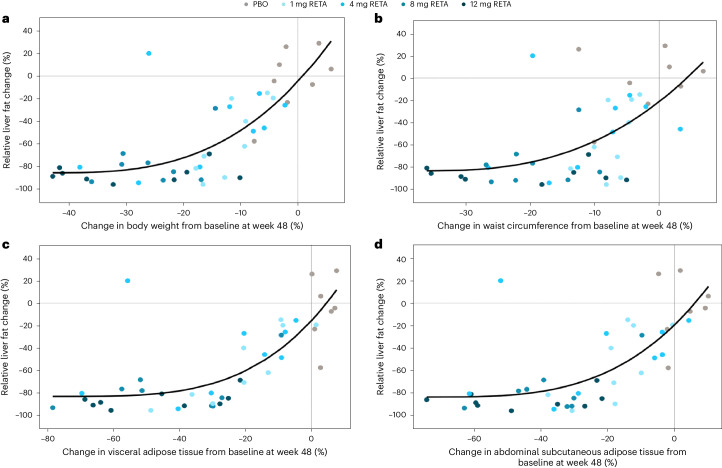
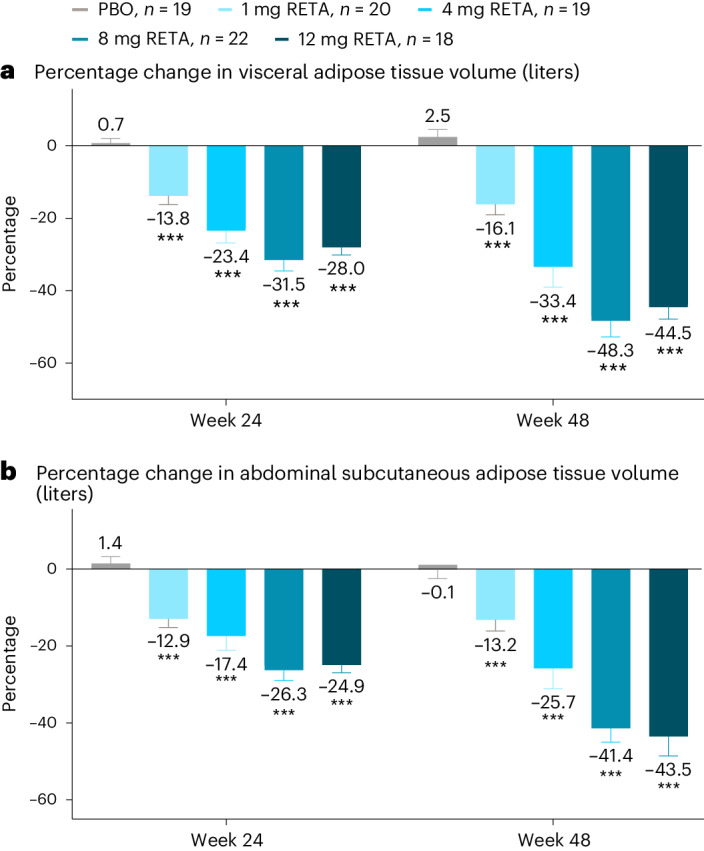
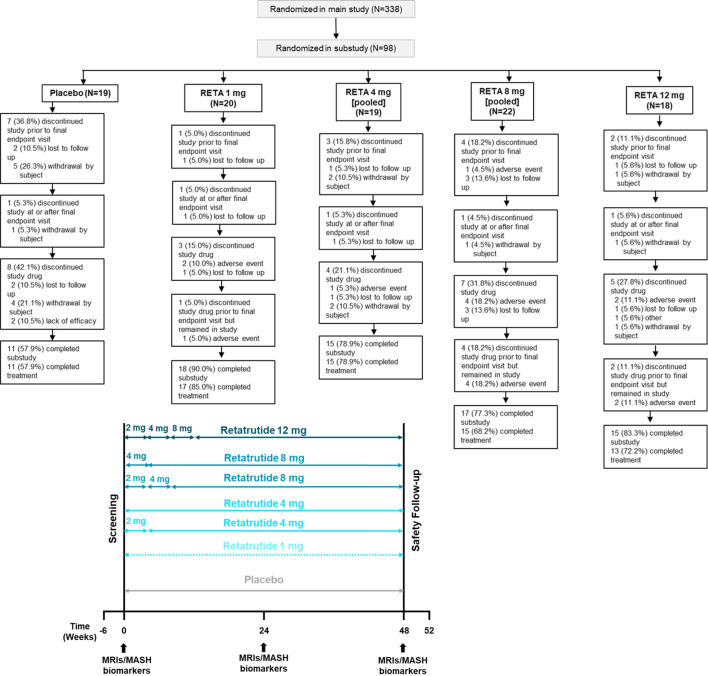
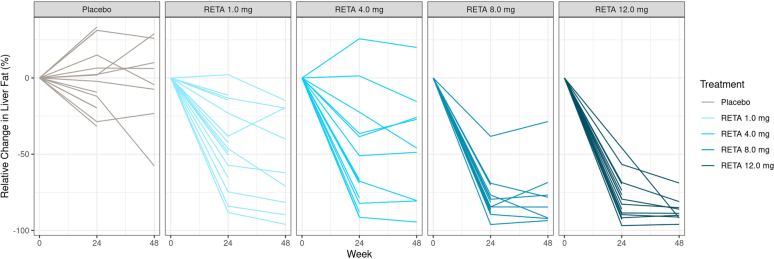
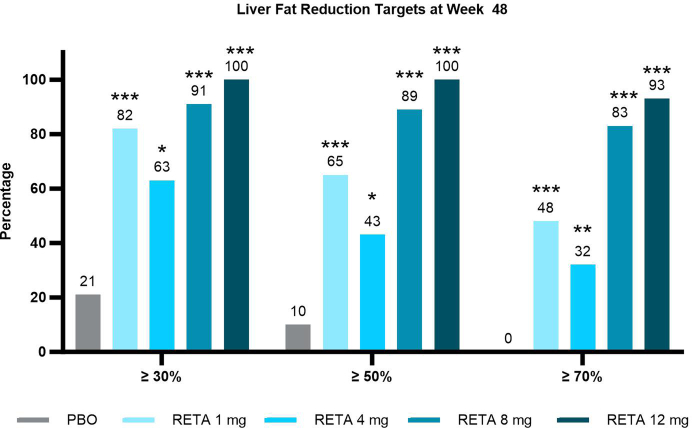
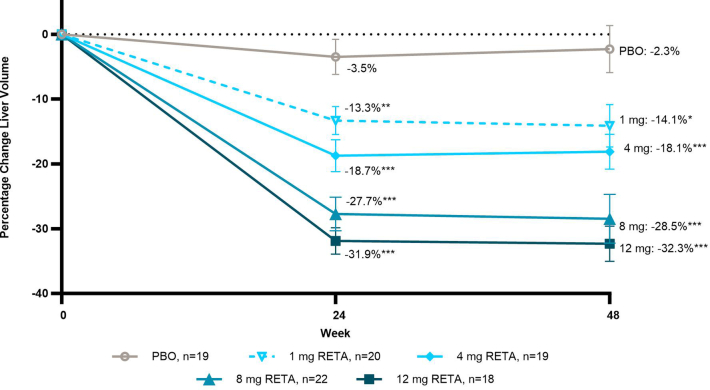
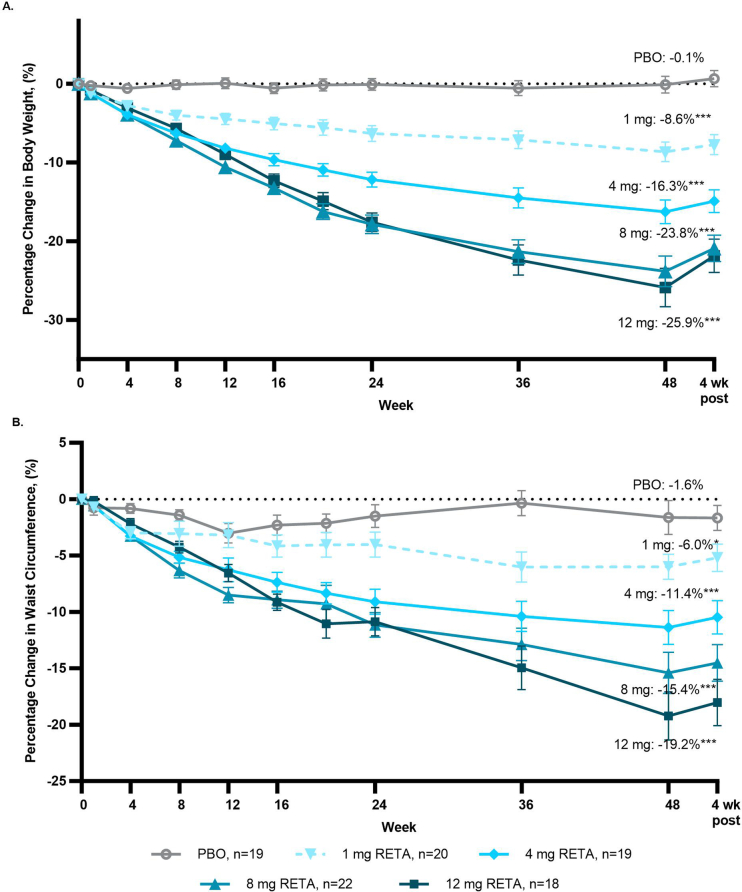
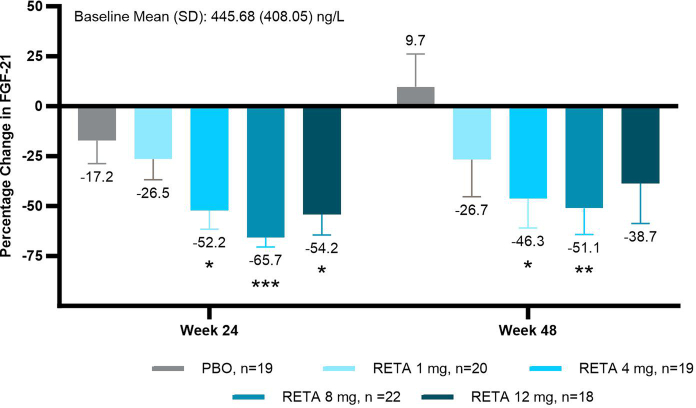
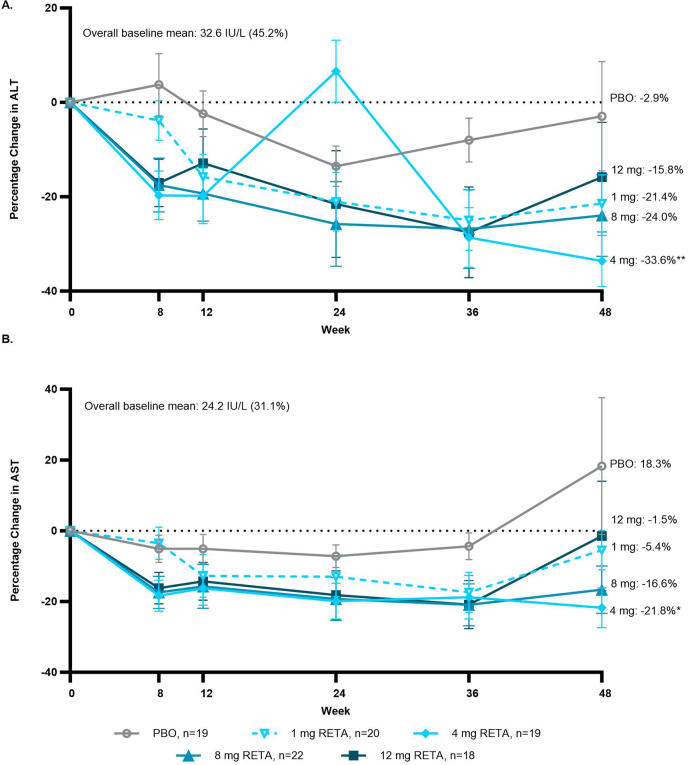
Retatrutide is a novel triple agonist of the glucose-dependent insulinotropic polypeptide, glucagon-like peptide 1 and glucagon receptors. A 48-week phase 2 obesity study demonstrated weight reductions of 22.8% and 24.2% with retatrutide 8 and 12 mg, respectively. The primary objective of this substudy was to assess mean relative change from baseline in liver fat (LF) at 24 weeks in participants from that study with metabolic dysfunction-associated steatotic liver disease and ≥10% of LF. Here, in this randomized, double-blind, placebo-controlled trial, participants (n = 98) were randomly assigned to 48 weeks of once-weekly subcutaneous retatrutide (1, 4, 8 or 12 mg dose) or placebo. The mean relative change from baseline in LF at 24 weeks was -42.9% (1 mg), -57.0% (4 mg), -81.4% (8 mg), -82.4% (12 mg) and +0.3% (placebo) (all P < 0.001 versus placebo). At 24 weeks, normal LF (<5%) was achieved by 27% (1 mg), 52% (4 mg), 79% (8 mg), 86% (12 mg) and 0% (placebo) of participants. LF reductions were significantly related to changes in body weight, abdominal fat and metabolic measures associated with improved insulin sensitivity and lipid metabolism. The ClinicalTrials.gov registration is NCT04881760 .


Conflict of interest statement

A.J.S. has stock options in Genfit, Tiziana, Indalo, Durect, Inversago and Galmed. He has served as a consultant to AstraZeneca, Salix, Tobira, Takeda, Janssen, Gilead, Terns, Merck, Madrigal, NGM Biopharmaceuticals, Sagimet, Valeant, Boehringer Ingelheim, Bristol Myers Squibb, Eli Lilly and Company, Hemoshear, Novartis, Inventiva, Enyo, Akero, 89Bio, Novo Nordisk, Pfizer, Amgen, Genentech, Regeneron, Alnylam, Hanmi, LG Chem, Histoindex, Thera Technologies, Intercept, Target-RWE, Surrozen, Zydus, Path AI, Exhalenz and Genfit. His institution has received grant support from Gilead, Salix, Tobira, Bristol Myers Squibb, Pfizer, Intercept, Merck, AstraZeneca, Malinckrodt and Novartis. He receives royalties from Elsevier and UptoDate. L.M.K. serves as a scientific and medical consultant to Altimmune, Boehringer Ingelheim, Cytoki, Flagship Pioneering, Gilead, Glyscend, Intellihealth, Johnson & Johnson, Kallyope, Eli Lilly and Company, Novo Nordisk, Pfizer, Sidekick Health and twenty30.health. J.P.F. reports research funding from Akero, AstraZeneca, Boehringer Ingelheim, 89bio, Eli Lilly and Company, Intercept, Ionis, Janssen, Madrigal, Metacrine, Merck, NorthSea Therapeutics, Novartis, Novo Nordisk, Oramed, Pfizer, Poxel and Sanofi; consulting fees from Akero, Altimmune, Boehringer Ingelheim, Carmot Therapeutics, Echosens, 89bio, Eli Lilly and Company, Merck, Novo Nordisk, Pfizer and Sanofi; speaker bureau from Eli Lilly and Company; support for attending meetings or travel from Eli Lilly and Company, Novo Nordisk, Pfizer and Sanofi; participant advisory boards and consulting for Altimmune, Becton Dickinson, Boehringer Ingelheim, Carmot Therapeutics, Eli Lilly and Company, Gilead, Intercept, Merck, Novo Nordisk, Pfizer and Sanofi; and is on the board of directors for T1D Exchange. M.L.H., B.B., C.H., K.J.M., A.H., Q.W., Y.D. and N.C.S. are employees and shareholders of Eli Lilly and Company. M.K.T. is an employee and shareholder of Eli Lilly and Company and a steering committee member for Accelerating Medicines Partnership—Common Metabolic Diseases.

Figures

Fig. 1
Fig. 1. Change in liver fat.
a, Relative liver fat reduction. Results are shown as LSM ± s.e.m. (n = 19 (PBO), n = 20 (1 mg RETA), n = 19 (4 mg RETA), n = 22 (8 mg RETA) and n = 18 (12 mg RETA)). b, The percentage of participants achieving liver fat reduction targets at week 24. c, The percentage of participants achieving liver fat content <5%. Comparisons versus PBO were done by using two-sided z-tests without multiplicity adjustment. *P < 0.05 versus PBO; ***P < 0.001 versus PBO; #, not calculable. Fewer participants had MRIs at week 48 (n = 8 (PBO), n = 9 (1 mg RETA), n = 9 (4 mg RETA), n = 8 (8 mg RETA) and n = 9 (12 mg RETA)) compared with week 24 (n = 14 (PBO), n = 16 (1 mg RETA), n = 15 (4 mg RETA), n = 17 (8 mg RETA) and n = 15 (12 mg RETA)).
Fig. 2
Fig. 2. Scatter plot and fitted power model curve.
a, Relative liver fat reduction versus percentage changes in body weight at week 48. b, Relative liver fat reduction versus percentage change in waist circumference at week 48. c, Relative liver fat reduction versus percentage change in visceral adipose tissue at week 48. d, Relative liver fat reduction versus percentage changes in abdominal subcutaneous adipose tissue at week 48.
Fig. 3
Fig. 3. Percent change in abdominal adipose tissue depots.
a, Percentage change in visceral adipose tissue volume (liters). b, Percentage change in abdominal subcutaneous adipose tissue volume (liters). Data are LSMs ± s.e.m. Comparisons versus PBO were done by using two-sided z-tests without multiplicity adjustment. ***P < 0.001 versus PBO.
Fig. 4
Fig. 4. Percentage change in K-18 and pro-C3.
a, The percentage change in K-18. b, The percentage change in pro-C3 with results shown as LSMs ± s.e.m. Comparisons versus PBO were done by using two-sided z-tests without multiplicity adjustment. *P < 0.05 versus PBO; ***P < 0.001 versus PBO. Pro-C3 measured with the second-generation ELISA corrected to correspond to the first-generation ELISA to enable comparisons to published literature (correction factor of 0.152).
Extended Data Fig. 1
Extended Data Fig. 1. Study design and trial disposition.
Top: patient disposition (CONSORT diagram) of the substudy. Completion of the substudy refers to completing the study visits, including the safety follow-up period, irrespective of adherence to study treatment. Participants who completed treatment stayed on study treatment for the treatment period. Bottom: study design schema with MRI/MASH biomarker schedule. Where applicable, dose escalations occurred every 4 weeks.
Extended Data Fig. 2
Extended Data Fig. 2. Participant-level changes in liver fat.
Data for all participants is shown, excluding data after discontinuation of treatment. One of the participants in the 8 mg dose group missed the last two doses of retatrutide, despite being marked as treatment completed by the investigator. This may have contributed to the lesser relative liver fat reduction at week 48 (−68.5%) compared with week 24 (−84.5%) for this participant.
Extended Data Fig. 3
Extended Data Fig. 3. Percent of participants achieving liver fat reduction targets at week 48.
Results shown as LS means ± SE. Comparisons vs. PBO were done by using 2-sided z-tests without multiplicity adjustment. Fewer participants had MRIs at Week 48 (n=8 [PBO], n=9 [1 mg RETA], n=9 [4 mg RETA], n=8 [8 mg RETA], n=9 [12 mg RETA]) compared with Week 24 (n=14 [PBO], n=16 [1 mg RETA], n=15 [4 mg RETA], n=17 [8 mg RETA], n=15 [12 mg RETA]). MRI, magnetic resonance imaging; PBO, placebo; RETA, retatrutide.
Extended Data Fig. 4
Extended Data Fig. 4. Percent change in liver volume.
Results shown graphically as LS means ± 1.96 × SE. Comparisons vs. PBO were done by using 2-sided z-tests without multiplicity adjustment. LS – least square; SE – standard error; PBO – placebo; RETA – retatrutide; *p<0.05 vs. PBO; **p<0.01; ***p<0.001 vs. PBO.
Extended Data Fig. 5
Extended Data Fig. 5. Percentage change in body weight and waist circumference.
a, The percentage change in body weight. b, The percentage change in waist circumference with results shown as LS means (SE). Comparisons vs. PBO were done by using 2-sided z-tests without multiplicity adjustment. *p<0.05 vs. PBO; **p<0.01; ***p<0.001 vs. PBO. Results at the 48-week end-of-treatment visit are shown with statistical testing results. Additionally, 4-week post-treatment results are shown. LS, least squares; PBO, placebo; RETA, retatrutide; SE, standard error.
Extended Data Fig. 6
Extended Data Fig. 6. FGF21 percentage change from baseline.
Results shown are LS means (SE). Comparisons vs. PBO were done by using 2-sided z-tests without multiplicity adjustment. *p<0.05 vs. PBO; **p<0.01; ***p<0.001 vs. PBO. FGF21, fibroblast growth factor 21; LS, least squares; PBO, placebo; RETA, retatrutide; SE, standard error.
Extended Data Fig. 7
Extended Data Fig. 7. Percent change from baseline - ALT and AST.
a, The percentage change from baseline in ALT. b, The percentage change from baseline in AST with results shown graphically as LS means ± 1.96 × SE; Baseline as geometric mean (Coefficient of variation%). Comparisons vs. PBO were done by using 2-sided z-tests without multiplicity adjustment. ALT=alanine aminotransferase; AST=aspartate aminotransferase; LS=least squares; PBO=placebo; RETA= retatrutide; SE=standard error.
Extended Data Fig. 8
Extended Data Fig. 8. Evaluation of drug-induced serious hepatotoxicity (eDISH) plots.
a, eDISH plot for MASLD substudy population (n=98). b, eDISH plot for overall obesity population (n=336). eDISH, evaluation of Drug-Induced Serious Hepatotoxicity; RETA, retatrutide; ULN, upper limit of normal. Notes on interpretation of the eDISH plot. ● Hy’s Law refers to the increased risk of serious drug-induced liver injury that is present when both aminotransferase elevations (>3 times the upper limit of the normal range [ULN]) and total bilirubin elevations (>2 times the ULN) occur together. This is denoted by the upper right quadrant of the eDISH plot. ● Temple’s corollary refers to the observation that drugs which caused a marked preponderance of lesser liver injuries compared with control agents, shown by more frequent serum aminotransferase elevations, were more likely to show more Hy’s Law cases. This is denoted by the lower right quadrant of the eDISH plot. ● The upper left quadrant refers to the cholestasis range. ● The lower left quadrant includes values within or near the reference range.

References

    1. Rinella, M. E. et al. A multi-society Delphi consensus statement on new fatty liver disease nomenclature. Ann. Hepatol.10.1016/j.aohep.2023.101133 (2023). - PubMed
    1. Younossi, Z. M. et al. The global epidemiology of nonalcoholic fatty liver disease (NAFLD) and nonalcoholic steatohepatitis (NASH): a systematic review. Hepatology77, 1335–1347 (2023). 10.1097/HEP.0000000000000004 - DOI - PMC - PubMed
    1. Younossi, Z. M. et al. Global epidemiology of nonalcoholic fatty liver disease-meta-analytic assessment of prevalence, incidence, and outcomes. Hepatology64, 73–84 (2016). 10.1002/hep.28431 - DOI - PubMed
    1. Friedman, S. L., Neuschwander-Tetri, B. A., Rinella, M. & Sanyal, A. J. Mechanisms of NAFLD development and therapeutic strategies. Nat. Med.24, 908–922 (2018). 10.1038/s41591-018-0104-9 - DOI - PMC - PubMed
    1. Younossi, Z. M. et al. Nonalcoholic steatohepatitis is the most rapidly increasing indication for liver transplantation in the United States. Clin. Gastroenterol. Hepatol.19, 580–9.e5 (2021). 10.1016/j.cgh.2020.05.064 - DOI - PubMed

Publication types

Associated data

LinkOut - more resources