. 2025 Jan;9(1):22-39.
doi: 10.1038/s41551-024-01227-1. Epub 2024 Jun 10.

Efficient site-specific integration of large genes in mammalian cells via continuously evolved recombinases and prime editing

Affiliations

Efficient site-specific integration of large genes in mammalian cells via continuously evolved recombinases and prime editing

Smriti Pandey et al. Nat Biomed Eng. 2025 Jan.

Abstract

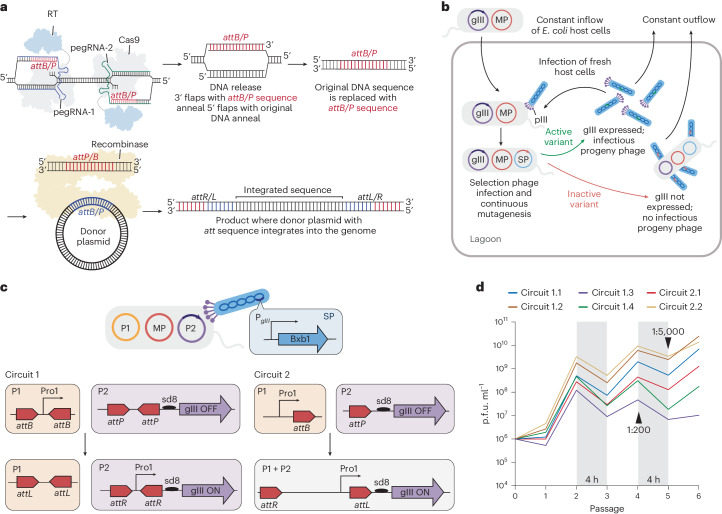
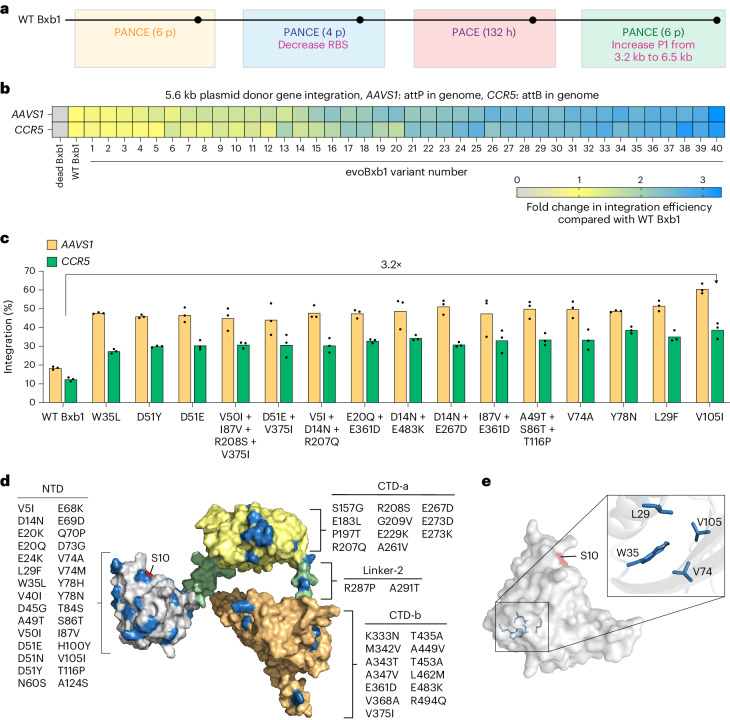
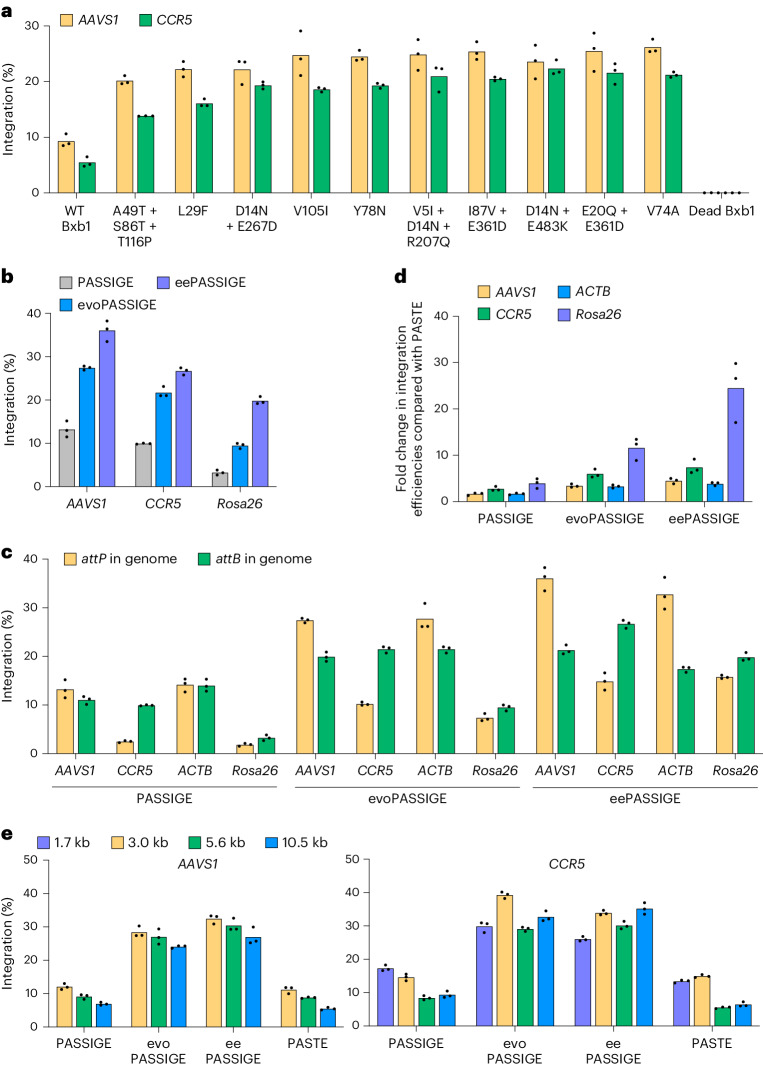
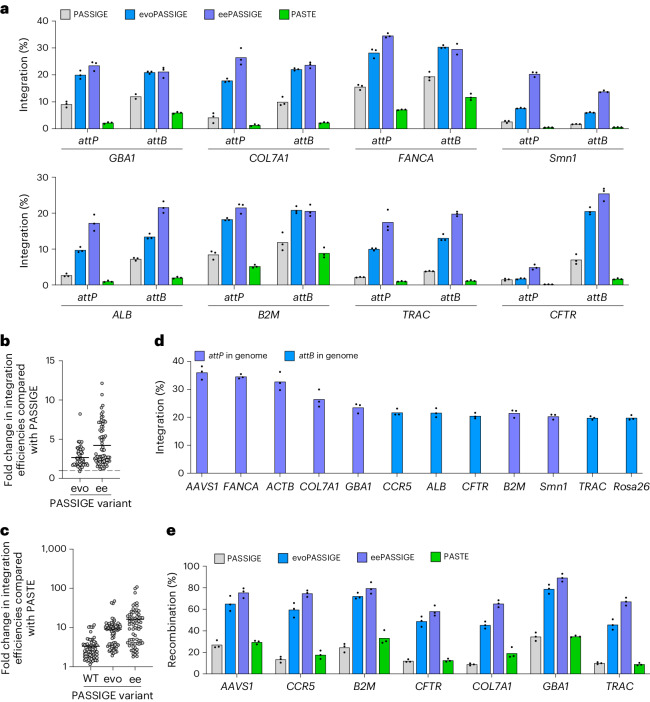
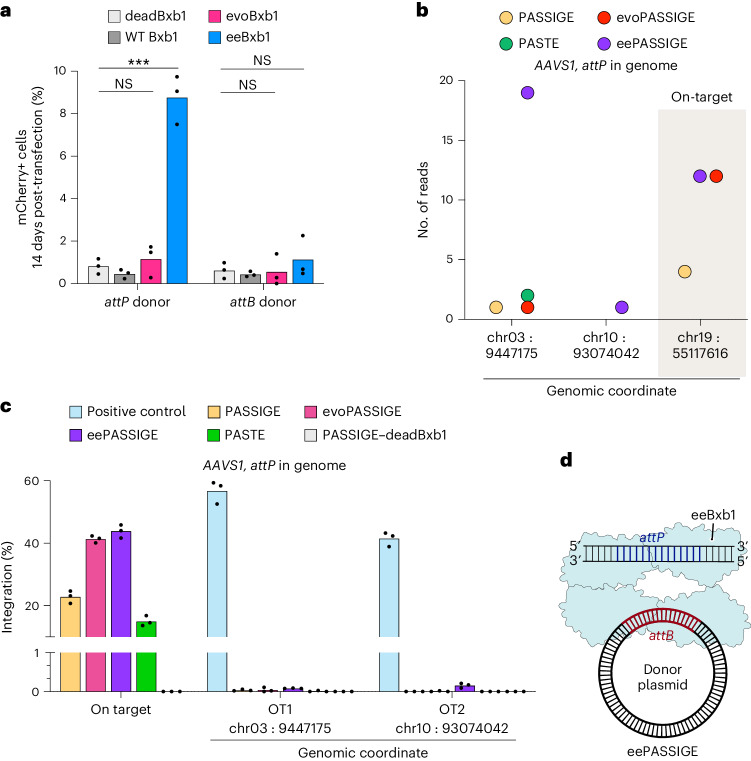
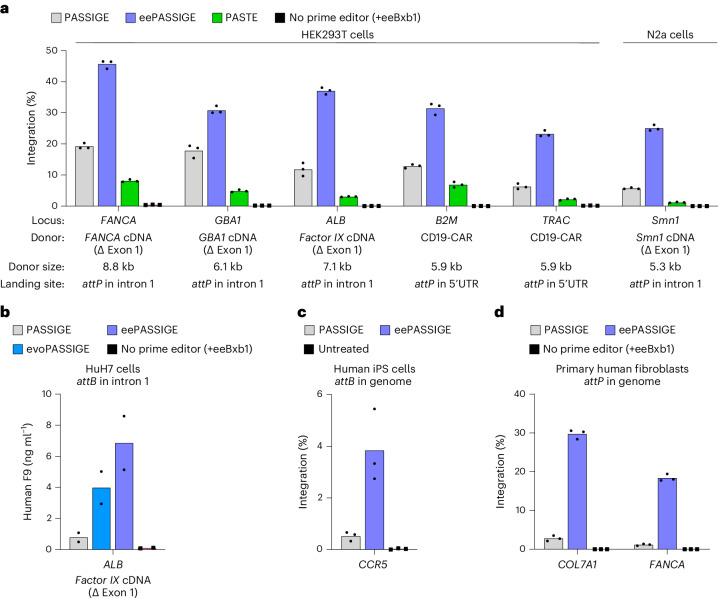
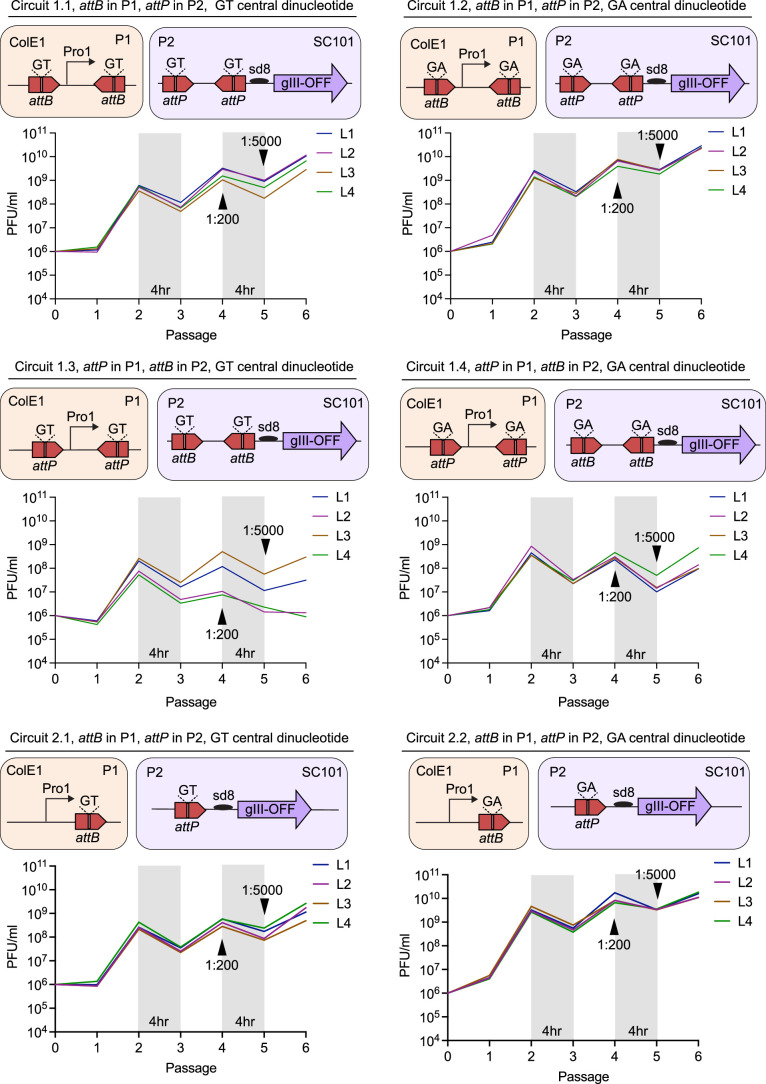
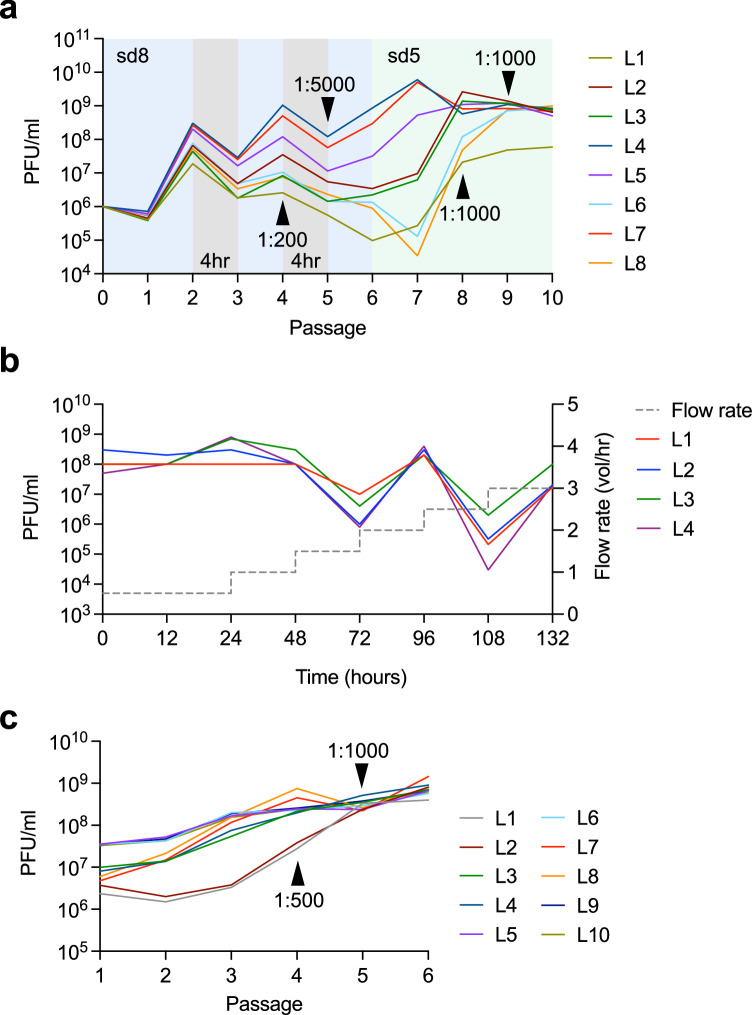
Methods for the targeted integration of genes in mammalian genomes suffer from low programmability, low efficiencies or low specificities. Here we show that phage-assisted continuous evolution enhances prime-editing-assisted site-specific integrase gene editing (PASSIGE), which couples the programmability of prime editing with the ability of recombinases to precisely integrate large DNA cargoes exceeding 10 kilobases. Evolved and engineered Bxb1 recombinase variants (evoBxb1 and eeBxb1) mediated up to 60% donor integration (3.2-fold that of wild-type Bxb1) in human cell lines with pre-installed recombinase landing sites. In single-transfection experiments at safe-harbour and therapeutically relevant sites, PASSIGE with eeBxb1 led to an average targeted-gene-integration efficiencies of 23% (4.2-fold that of wild-type Bxb1). Notably, integration efficiencies exceeded 30% at multiple sites in primary human fibroblasts. PASSIGE with evoBxb1 or eeBxb1 outperformed PASTE (for 'programmable addition via site-specific targeting elements', a method that uses prime editors fused to recombinases) on average by 9.1-fold and 16-fold, respectively. PASSIGE with continuously evolved recombinases is an unusually efficient method for the targeted integration of genes in mammalian cells.


Conflict of interest statement

Competing interests: X.D.G., S.P. and D.R.L. have filed patent applications on this work. M.J.O. receives compensation as a consultant for Agathos Biologics. D.R.L. is a co-founder and consultant for Prime Medicine, Beam Therapeutics, Pairwise Plants, Chroma Medicine and Nvelop Therapeutics, and owns equity in these companies.

Figures

Fig. 1
Fig. 1. Phage-assisted evolution of the Bxb1 recombinase for PASSIGE.
a, An overview of PASSIGE. Prime editing (dual flap or single flap) precisely installs a large serine recombinase (LSR) attachment site (attB or attP) into a target locus in the genome. The LSR then recognizes the installed att motif and integrates donor DNA into this site. b, An overview of PACE. The selection phage (SP) encodes the protein being evolved. Host E.coli cells encode a mutagenesis plasmid (MP), as well as plasmids that link the activity of the evolving protein to expression of gIII, an essential phage gene. Only phages that encode active variants trigger gIII expression and propagate. A constant dilution of host cells and media washes out inactive phage variants that are unable to propagate faster than the dilution rate. c, A schematic of the recombinase-PACE selection circuit. Bxb1 recombinase is encoded on the SP. Host cells harbour plasmid P1 that encodes promoter Pro1, and plasmid P2 that encodes a promoter-less gIII cassette. Bxb1-mediated recombination places Pro1 upstream of the gIII cassette, driving its expression. In circuit 1, two attachment sites are present in each plasmid resulting in two recombination events that exchanges sequences between P1 and P2. In circuit 2, one attachment site is present in each plasmid resulting in one recombination event that integrates P1 and P2. d, PANCE phage titre for the evolution of Bxb1 recombinase across six circuits (1.1–1.4 and 2.1–2.2). Each trace reflects the mean value of phage titres across four different lagoons. Individual traces for each lagoon are shown in Extended Data Fig. 1. Selection stringency was modulated by decreasing the selection time and increasing dilution factor. Unless otherwise indicated, each passage was performed overnight, and phage were diluted 1:50 after each passage. Source data
Fig. 2
Fig. 2. Characterization of evolved Bxb1 variants in mammalian cells.
a, Summary of the Bxb1 evolution campaign. p, PANCE passages. RBS, ribosome binding site. b, A heat map of fold change in integration efficiency compared to wild-type (WT) Bxb1 for evolved variants. A 5.6 kb donor plasmid along with either recombinase-dead Bxb1, WT Bxb1 or an evolved variant were transfected into HEK293T cells with either pre-installed attP in AAVS1 or attB in CCR5. Each square reflects the mean value for three independent replicates. c, Absolute integration efficiencies for 15 evolved Bxb1 variants with the highest activity, and WT Bxb1 from b. The bars reflect the mean of three independent replicates and dots show individual n = 3 replicate values. d, Alphafold2-predicted structure of the Bxb1 recombinase. The three distinct domains, NTD, CTD-a and CTD-b are in grey, yellow and orange, respectively. Linkers connecting the domains are in green. The catalytic residue, S10 is in red, and residues mutated during evolution are in blue. All mutated residues in each domain are listed. e, Predicted position of mutated residues that resulted in the highest integration efficiencies. Residues (blue) are mapped onto the AlphaFold2-predicted structure of the NTD of Bxb1 (grey). Integration efficiency (b and c) was assessed by ddPCR analysis as described in Supplementary Note 1. Source data
Fig. 3
Fig. 3. Characterization of evolved Bxb1 variants for PASSIGE.
a, Absolute integration efficiencies for ten evolved Bxb1 variants with the highest activity from Fig. 2b,c, and WT Bxb1 in the PASSIGE system. b, Absolute integration efficiencies for PASSIGE (WT Bxb1), evoPASSIGE (Bxb1-V74A) and eePASSIGE (Bxb1-V74A + E229K + V375I). c, Comparison of integration efficiencies when installing either attP or attB into AAVS1, CCR5, ACTB and Rosa26 genomic loci using PASSIGE, evoPASSIGE and eePASSIGE. d, Fold change in integration efficiencies relative to PASTE for PASSIGE, evoPASSIGE and eePASSIGE across four loci. e, The effects of donor size on PASSIGE, evoPASSIGE, eePASSIGE and PASTE. For PASSIGE and PASTE experiments, all components were delivered using single transfection and a 5.6-kb donor DNA plasmid was used (ad). In a,b,d and e, dual pegRNAs were used to insert attP into AAVS1 and ACTB or attB into CCR5 and Rosa26. Rosa26 is a genomic site in N2a cells; all other sites are in HEK293T cells (ae). The bars reflect the mean of three independent replicates and dots show individual n = 3 replicate values. The integration efficiency (ae) was assessed by ddPCR analysis as described in Supplementary Note 1. Source data
Fig. 4
Fig. 4. Characterization of PASSIGE, evoPASSIGE, eePASSIGE and PASTE at additional loci.
a, The absolute integration efficiencies for PASSIGE, evoPASSIGE, eePASSIGE and PASTE at eight different therapeutically relevant genomic sites. Integration was assessed when installing both attP and attB into each locus separately. b, The fold change in integration efficiencies relative to PASSIGE for evoPASSIGE and eePASSIGE across all sites tested in this study. c, The fold change in integration efficiencies relative to PASTE for PASSIGE, evoPASSIGE and eePASSIGE across all sites tested in this study. d, The absolute integration efficiencies with eePASSIGE at 12 sites. Either attP or attB was installed into the genome, as indicated. e, The recombination efficiencies for PASSIGE, evoPASSIGE, eePASSIGE and PASTE across seven sites. For CCR5, and CFTR, attB was installed into the genome; for all other genomic sites attP was installed. HTS with UMI analysis was used to quantify recombination efficiencies. For PASSIGE and PASTE experiments in ae, all components were delivered using single transfection and a 5.6-kb donor DNA plasmid was used. Smn1 and Rosa26 are genomic sites in N2a cells, all other genomic sites are in HEK293T cells. For b and c, integration efficiencies were evaluated at 12 different loci when installing both attP and attB separately. The bars reflect the mean of three independent replicates (a,d and e), dots show individual n = 3 replicate values (ae) and horizontal lines show the mean value (b and c). The integration efficiency (ad) was assessed by ddPCR analysis as described in Supplementary Note 1. Source data
Fig. 5
Fig. 5. Off-target profiling of PASSIGE, evoPASSIGE, eePASSIGE and PASTE.
a, The percentage of mCherry-positive cells 14 days after transfecting a 3.2-kb donor DNA plasmid along with either dead Bxb1, WT Bxb1, evoBxb1 or eeBxb1. The donor plasmid either has an attP or attB site and encodes mCherry under the CMV promoter. Statistical significance was calculated using Student’s unpaired two-tailed t-test, ***P < 0.001. b, The number of uniquely mapped reads and genomic coordinates (human GRCh38) for UDiTaS-nominated off-target sites when attP is installed into the genome. The on-target AAVS1 locus is shaded. All PASSIGE variants and PASTE were used to integrate a puromycin-encoding donor plasmid. c, Absolute integration efficiencies at the on-target and UDiTaS-nominated off-target sites when attP is installed into the AAVS1 locus for all PASSIGE variants and PASTE. For the negative control, dead Bxb1 was used instead of the WT recombinase in PASSIGE. For the positive control, a DNA sequence encoding the off-target sequence identified by UDiTaS was mixed with an ACTB reference sequence in a 1:1 ratio, so that roughly 50% of the total droplets would give a positive signal. Integration efficiency was assessed by ddPCR analysis as described in Supplementary Note 1. d, The recommended configuration for PASSIGE using eeBxb1. To minimize off-target integration, dual pegRNAs should be used to install attP into the genome, and the eeBxb1 variant should be used to integrate the DNA cargo. For PASSIGE and PASTE experiments, all components were delivered into cells using a single-transfection (b and c). The bars reflect the mean of three independent replicates and dots show individual n = 3 replicate values (a and c). Source data
Fig. 6
Fig. 6. Assessing the therapeutic potential of PASSIGE variants.
a, Absolute integration efficiencies for PASSIGE, eePASSIGE and PASTE when integrating therapeutically relevant cDNA cargoes into multiple loci in HEK293T and N2a cells. b, F9 protein measurement via ELISA assay. HuH7 cells were passaged 72 h after transfection with PASSIGE, evoPASSIGE and eePASSIGE. Day 9 post-transfection, media supernatants were collected from each condition and used for F9 ELISA assay. c, Absolute integration efficiencies for PASSIGE and eePASSIGE when integrating a 5.6-kb donor plasmid in human iPS cells with pre-installed attB sequence in the CCR5 locus. The Bxb1 variant was delivered as an mRNA. d, Absolute integration efficiencies for PASSIGE and eePASSIGE when integrating a 5.8-kb DNA donor into the COL7A1 and FANCA loci in primary human fibroblasts. The attP sequence was installed into intron 4 and intron 1 of the COL7A1 and FANCA loci, respectively. PEmax mRNA, recombinase mRNA, synthetic pegRNAs and donor-encoding integrase-deficient lentivirus were all delivered via a single electroporation. For PASSIGE and PASTE experiments in a and b, all components were delivered using single transfection. For the negative control, either all components except the prime editor protein were delivered into cells with eeBxb1 recombinase (a,b and d) or an untreated sample was used (c). The bars reflect the mean of either three (a,c and d) or two (b) independent replicates and dots indicate individual replicate values of either n = 3 (a,c and d) or n = 2 (b). Integration efficiency (a,c,d) was assessed by ddPCR analysis as described in Supplementary Note 1. Source data
Extended Data Fig. 1
Extended Data Fig. 1. Individual PANCE experiments for Bxb1 evolutions in Fig. 1d.
In circuits 1.1–1.4, two recombinase attachment sites are present in both plasmids, P1 and P2. Circuits 2.1, and 2.2 use one recombinase attachment site per plasmid. Circuits 1.1, 1.2, 2.1, and 2.2 have attB in P1 and attP in P2. Circuits 1.3, and 1.4 have attP in P1 and attB in P2. Circuits 1.2, 1.4, and 2.2 have a GA central dinucleotide in the attachment sites instead of GT, which is present in circuits 1.1, 1.3, and 2.1. PANCE traces for each lagoon (L1-L4) are shown. Selection stringency was modulated by decreasing the selection time and increasing dilution factor. Unless otherwise indicated, each PANCE passage was performed overnight, and phage were diluted 1:50 after each passage. PANCE titers were measured by qPCR as described in Methods. Source data
Extended Data Fig. 2
Extended Data Fig. 2. PANCE and PACE experiments for Bxb1 evolution in Fig. 2a.
a, PANCE traces in circuit 1.3. Traces for individual lagoons (L1- L8) are shown. Selection stringency was modulated by decreasing the strength of the ribosome binding site (RBS) from sd8 to sd5, decreasing selection time, and increasing dilution factor. b, PACE traces across four lagoons (L1-L4) using circuit 1.3. Phage pools obtained from PANCE in a were used to inoculate all lagoons. Selection stringency was modulated by increasing flow rate from 0.5 vol/hr to 3.0 vol/hr. c, PANCE traces for evolution where size of P1 was increased from 3.2-kB to 6.5-kB. Phage pools obtained from PACE in b were used to inoculate ten individual lagoons (L1-L10). Selection stringency was modulated by increasing dilution factor. For all PANCE experiments, unless otherwise indicated, each passage was performed overnight and phage were diluted 1:50 after each passage. PANCE titers were measured using qPCR and PACE titers were measured using plaquing, as described in Methods. Source data
Extended Data Fig. 3
Extended Data Fig. 3. Mapping evolved mutations onto the predicted structure of Bxb1.
a, AlphaFold2-predicted structures of the NTD, CTD-a, and CTD- b of Bxb1 (grey). Each domain aligns well with solved structures of serine recombinases (blue) (PDB: 1ZR4, 6DNW, and 4KIS). b, Positions of beneficial evolved mutations (yellow) in the AlphaFold2-predicted structure of the NTD of Bxb1. The DNA substrate (green) from gammadelta resolvase tetramer (PDB: 1ZR4) was docked onto the predicted structure. S10 (red) is the catalytic residue. c, Positions of beneficial mutations (yellow) on the surface of the AlphaFold2-predicted structure of the NTD of Bxb1 (grey). d, Predicted positions of the four mutated residues (yellow) in the core of the NTD (grey) that resulted in the highest integration efficiencies. Positions were predicted using AlphaFold2. The remaining three unmutated residues in each case are in blue. Source data
Extended Data Fig. 4
Extended Data Fig. 4. Further optimization of the PASSIGE system.
a, Schematic of trimmed pegRNA optimization for PASSIGE. When the overlap length between the two newly synthesized 3′ flaps is decreased, plasmid recombination is reduced. b, Attachment site installation efficiencies when using trimmed pegRNAs to install either attP or attB into the AAVS1 and CCR5 loci. Overlap lengths from 50 bp to 8 bp and 38 bp to 12 bp were tested to install attP and attB, respectively. c, Heat map of fold-change in integration efficiencies compared to wild-type (WT) Bxb1 for evolved and engineered (ee) Bxb1 variants that were generated by combining one mutation from each domain of Bxb1. A 5.6-kB donor plasmid along with either WT Bxb1, or an ee-variant were transfected into HEK293T cells with either pre-installed attP in AAVS1 or attB in CCR5. Each square reflects the mean value for three independent replicates. d, Attachment site installation efficiencies (left) and eePASSIGE-mediated integration efficiencies (right) when using PE6 variants to install attB into the Rosa26 site in N2a cells. All components were delivered using a single-transfection. For attachment site installation (left), the prime editor and epegRNAs were delivered. For eePASSIGE-mediated integration (right), eeBxb1 and a 5.6-kB DNA donor were additionally delivered. The % edit or indels was assessed by high-throughput sequencing (b and d). Bars reflect the mean of three independent replicates and dots show the values of individual replicates (b-d). Integration efficiencies (c and d) were assessed by ddPCR analysis as described in Supplementary Note 1. Source data
Extended Data Fig. 5
Extended Data Fig. 5. Comparison of PASTE with PASSIGE.
a, Comparing the optimized pegRNA scaffold (atgRNAv2) used in PASTE with the original pegRNA scaffold used in PASSIGE. b, Comparing the XTEN-48 linker between the Cas9 and M-MLV reverse transcriptase (RT) domain of the prime editor used in PASTE with the SGGSx2-bpNLSSV40-SGGSx2 linker used in PASSIGE. c, Comparing the mutated M-MLV RT with the L139P mutation used in PASTE with the M-MLV RT used in PASSIGE. d, Comparing the mutated attP sequence used in PASTE with the original attP sequence used in PASSIGE. e, Comparing fusion of Bxb1 to the PEmax prime editor using the same linker specified in PASTE (in cis) with the unfused Bxb1 used in PASSIGE (in trans). f, Comparing PASSIGE architecture with the PASTE architecture using wild-type Bxb1, evoBxb1, and eeBxb1 recombinases. In the PASSIGE architecture, Bxb1 variants and the PEmax prime editor are unfused. In the PASTE architecture, Bxb1 variants are fused to the PASTE prime editor using the same linker specified in e. For PASSIGE and PASTE experiments, all components were delivered using single transfection, a 5.6-kB donor DNA plasmid was used, and all experiments were performed in HEK293T cells. At the AAVS1 locus, attP was installed and at the CCR5, and ACTB loci, attB was installed. In all cases, the WT Bxb1, evoBxb1, and eeBxb1 were used. Bars reflect the mean of three independent replicates and dots show individual replicate values. Integration efficiency (a-f) was assessed by ddPCR analysis as described in Supplementary Note 1. Source data
Extended Data Fig. 6
Extended Data Fig. 6. High-throughput sequencing assay to evaluate allelic distribution after PASSIGE- and PASTE-mediated integration.
a, Schematic of the high-throughput sequencing assay (HTS) used to measure all genomic outcomes post-integration. The 5.6-kB DNA donor plasmid, which is integrated into the target locus encodes a genome-specific reverse primer sequence, enabling a single primer pair with an optimal PCR extension time to amplify unedited, attachment site installed, indel-containing, and donor-integrated amplicons. To reduce potential PCR bias, the integrated amplicon is designed to have the same length as the unedited amplicon (x-bp). b, Comparison of integration efficiencies obtained from the HTS assay and ddPCR. ddPCR analysis was performed as described in Supplementary Note 1. c, Frequencies of unedited, donor-integrated, attachment-site installed, and indel-containing amplicons across seven genomic loci measured by HTS. Error bars represent mean ± s.e.m. of n = 3 replicates. d, Fold change in attachment (att) site installation efficiencies of PEmax relative to PASTE. Efficiencies were assessed across 11 different loci when installing both attP and attB. HTS was used to assess installation efficiencies, with absolute values and calculations reported in Supplementary Table 5. Horizontal line shows the mean value. For PASSIGE and PASTE experiments (b and c), all components were delivered using single transfection in HEK293T cells and a 5.6-kB donor DNA plasmid was used. Dual pegRNAs were used to install attP or attB into each locus as specified in the figure (b and c). Dots show individual n = 3 replicate values (b and d). Bars reflect the mean of three independent replicates (b and c). For the HTS assay, UMI analysis was performed to reduce PCR bias (b and c). Source data
Extended Data Fig. 7
Extended Data Fig. 7. Correlation of PASSIGE- and PASTE- mediated integration efficiencies with histone modification markers.
a, Pearson Correlation analysis of eePASSIGE-mediated integration efficiencies across ten genomic loci and histone marker signals extracted and processed from ChIP-seq data deposited in ENCODE. Integration efficiencies were positively correlated with active histone markers, H3K27ac and H3K4me3 and negatively correlated with heterochromatin marker, H3K9me3. Identical analysis was also performed for b, evoPASSIGE, c, PASSIGE, and d, PASTE. Similar to eePASSIGE, the integration efficiencies from evoPASSIGE, PASSIGE and PASTE all positively correlated with HEK27ac and H3K4me3 and negatively correlated with H3K9me3. Pearson correlation coefficient and p-value for each analysis are labelled on the scatter plot. In all cases, p-value was < 0.05 except PASSIGE and PASTE with H3K9me3 marker. Integration efficiencies from three individual replicates, measured by ddPCR, were averaged and used for analysis. The ChIP-seq signal of each histone modification within a 1-kb window centred around the target site was extracted and processed from HEK293T datasets. Statistical significance was calculated using Student’s unpaired two-tailed t-test. Source data
Extended Data Fig. 8
Extended Data Fig. 8. Additional off-target profiling of PASSSIGE, evoPASSIGE, eePASSIGE, and PASTE.
a, Percentage of mCherry-positive cells 14 days after transfecting a 3.2-kB donor DNA plasmid along with either dead Bxb1, evoBxb1, Bxb1-(V74A+V375I), Bxb1-(V74A+E229K), or eeBxb1. The donor plasmid has an attP site and encodes mCherry under the CMV promoter. Statistical significance was calculated using Student’s unpaired two-tailed t-test, ***P < 0.001, ****P < 0.0001. b, Predicted position of the E229K (blue) mutation that resulted in off-target integration when delivering an attP containing donor. The DNA substrate (green) from Listeria innocua prophage serine recombinase (PDB: 6DNW) was docked onto the AlphaFold2-predicted structure of the CTD-a domain of Bxb1 (grey). c, Number of uniquely mapped reads and genomic coordinates (Human GRCh38) for UDiTaS nominated off-target sites, with multiple-alignments after deduplication when attB is installed into the genome. The on-target CCR5 locus is shaded. All PASSIGE variants, and PASTE were used to integrate a puromycin-encoding plasmid and cells were passaged for 14 days before analysis. Sites with an asterick were further validated using ddPCR analysis in d. All nominated sequences are listed in Supplementary Table 7. d, Absolute integration efficiencies at the on-target and five UDiTaS nominated off-target sites when attB is installed into the CCR5 locus for all PASSIGE variants and PASTE. For the negative control, dead Bxb1 was used instead of the WT recombinase in PASSIGE. For the positive control, a DNA sequence encoding the off-target sequence identified by UDiTaS was mixed with an ACTB reference sequence in a 1:1 ratio, so that roughly 50% of the total droplets would give a positive signal. Integration efficiency was assessed by ddPCR analysis as described in Supplementary Note 1. e, Percent of reads that either align to the donor plasmid, or the plasmid-donor recombined product in UDiTaS samples. Bars reflect the average of n = 8 samples for active-recombinase treated samples (PASSIGE, evoPASSSIGE, eePASSIGE, and PASTE when an attB or attP donor is delivered) and n = 2 samples for the dead recombinase treated control. Reads from high-throughput sequencing that included the attachment half-site from the donor plasmid post-demultiplexing were directly used for analysis, as this sequence is expected to be present in all on-target and off-target integration events, pegRNA-donor recombined product, and donor plasmid. For PASSIGE and PASTE experiments, all components were delivered using a single transfection, and a 5.6 kB donor was used (c, d-e). Bars reflect the mean of three independent replicates (a and d) and dots show the values of individual replicates (a,d-e). Source data
Extended Data Fig. 9
Extended Data Fig. 9. Characterization of PASSIGE variants in HuH7 and primary human fibroblast cells.
a, Absolute integration efficiencies of PASSIGE, evoPASSIGE, and eePASSIGE when integrating a Factor IX cDNA encoding DNA donor at the ALB locus in HuH7 cells. b, Absolute integration efficiency of PASSIGE, evoPASSIGE, eePASSIGE, and PASTE in primary human fibroblasts when integrating a 3.0- kB DNA donor in the AAVS1 locus. c, Absolute integration efficiencies at the on-target and the two UDiTaS nominated off- target sites when attP is installed into intron 4 of COL7A1 and intron 1 of FANCA for PASSIGE and eePASSIGE. For the positive control, a DNA sequence encoding the off-target sequence identified by UDiTaS was mixed with an ACTB reference sequence in a 1:1 ratio, so that roughly 50% of the total droplets would give a positive signal. PEmax mRNA, recombinase mRNA, synthetic pegRNAs, and donor-encoding integrase-deficient lentivirus were all delivered via a single electroporation. In (a and b), all components were delivered as plasmids using either a single transfection (a), or electroporation (b) and for the negative control, all components except the prime editor protein were delivered into cells with eeBxb1 recombinase. Dual pegRNAs were used to install attB into ALB (a), and attP into AAVS1 (b). Bars reflect the mean of three independent replicates and dots indicate individual replicate values (a-c). Integration efficiency(a-c) was assessed by ddPCR analysis as described in Supplementary Note 1. Source data
Extended Data Fig. 10
Extended Data Fig. 10. Performance of ddPCR probes at the LMNB1, NOLC1, and ACTB sites.
a, Integration efficiencies for PASSIGE, evoPASSIGE, eePASSIGE, and PASTE at the top three most common sites used to characterize PASTE. Initial PASTE publication uses ddPCR probes that bind either to the DNA donor or pegRNA plasmid26 whereas the initial twin prime editing24 publication and this work primarily employ probes that bind to the genome–donor junction. Bars reflect the mean of three independent replicates and dots show individual replicate values. b, ddPCR plots for PASTE, no PEmax (+eeBxb1) control, and dead Bxb1 control when using different ddPCR probes. The magenta line shows the threshold that was set to assess integration efficiencies in a. Details on threshold calculations are provided in Supplementary Note 1. In a and b, probes used in the original PASTE paper are compared side-by-side with probes used in this study. In the original PASTE report, probes bind to either the DNA donor plasmid (LMNB1, and NOLC1) or the Bxb1 attB sequence, which is also present in the pegRNA plasmid (ACTB). In this study, we primarily used probes that bind to the Bxb1 attL or attR sites, which are only present in cells after recombination. When using the DNA donor plasmid-binding probe reported in the PASTE paper, high background was observed in the negative controls at LMNB1, and NOLC1: no PEmax (+eeBxb1) and dead Bxb1 both showed false positive signals. In contrast, minimal or no background was observed at these sites when using an attL- binding probe. For PASSIGE and PASTE experiments, all components were delivered using single transfection, and a 4.5- kB donor DNA plasmid reported in the PASTE paper was used. The primer pair used for ddPCR was that reported in the PASTE paper for all reactions. All experiments were performed in HEK293T cells. The genome–donor junction probe was used in all experiments except for a few off-target sites, as detailed in Methods. Source data

Similar articles

Cited by

References

    1. Landrum, M. J. et al. ClinVar: public archive of relationships among sequence variation and human phenotype. Nucleic Acids Res.42, D980–D985 (2014). - PMC - PubMed
    1. Weischenfeldt, J., Symmons, O., Spitz, F. & Korbel, J. O. Phenotypic impact of genomic structural variation: insights from and for human disease. Nat. Rev. Genet.14, 125–138 (2013). - PubMed
    1. Genomes Project Consortium et al. A global reference for human genetic variation. Nature526, 68–74 (2015). - PMC - PubMed
    1. Bareil, C. & Bergougnoux, A. CFTR gene variants, epidemiology and molecular pathology. Arch. Pediatr.27, eS8–eS12 (2020). - PubMed
    1. Jin, X. et al. Identification of novel deep intronic PAH gene variants in patients diagnosed with phenylketonuria. Hum. Mutat.43, 56–66 (2022). - PubMed

LinkOut - more resources