. 2024 Aug;9(8):2128-2143.
doi: 10.1038/s41564-024-01722-w. Epub 2024 Jun 10.

Functional and structural basis of human parainfluenza virus type 3 neutralization with human monoclonal antibodies

Affiliations

Functional and structural basis of human parainfluenza virus type 3 neutralization with human monoclonal antibodies

Naveenchandra Suryadevara et al. Nat Microbiol. 2024 Aug.

Abstract

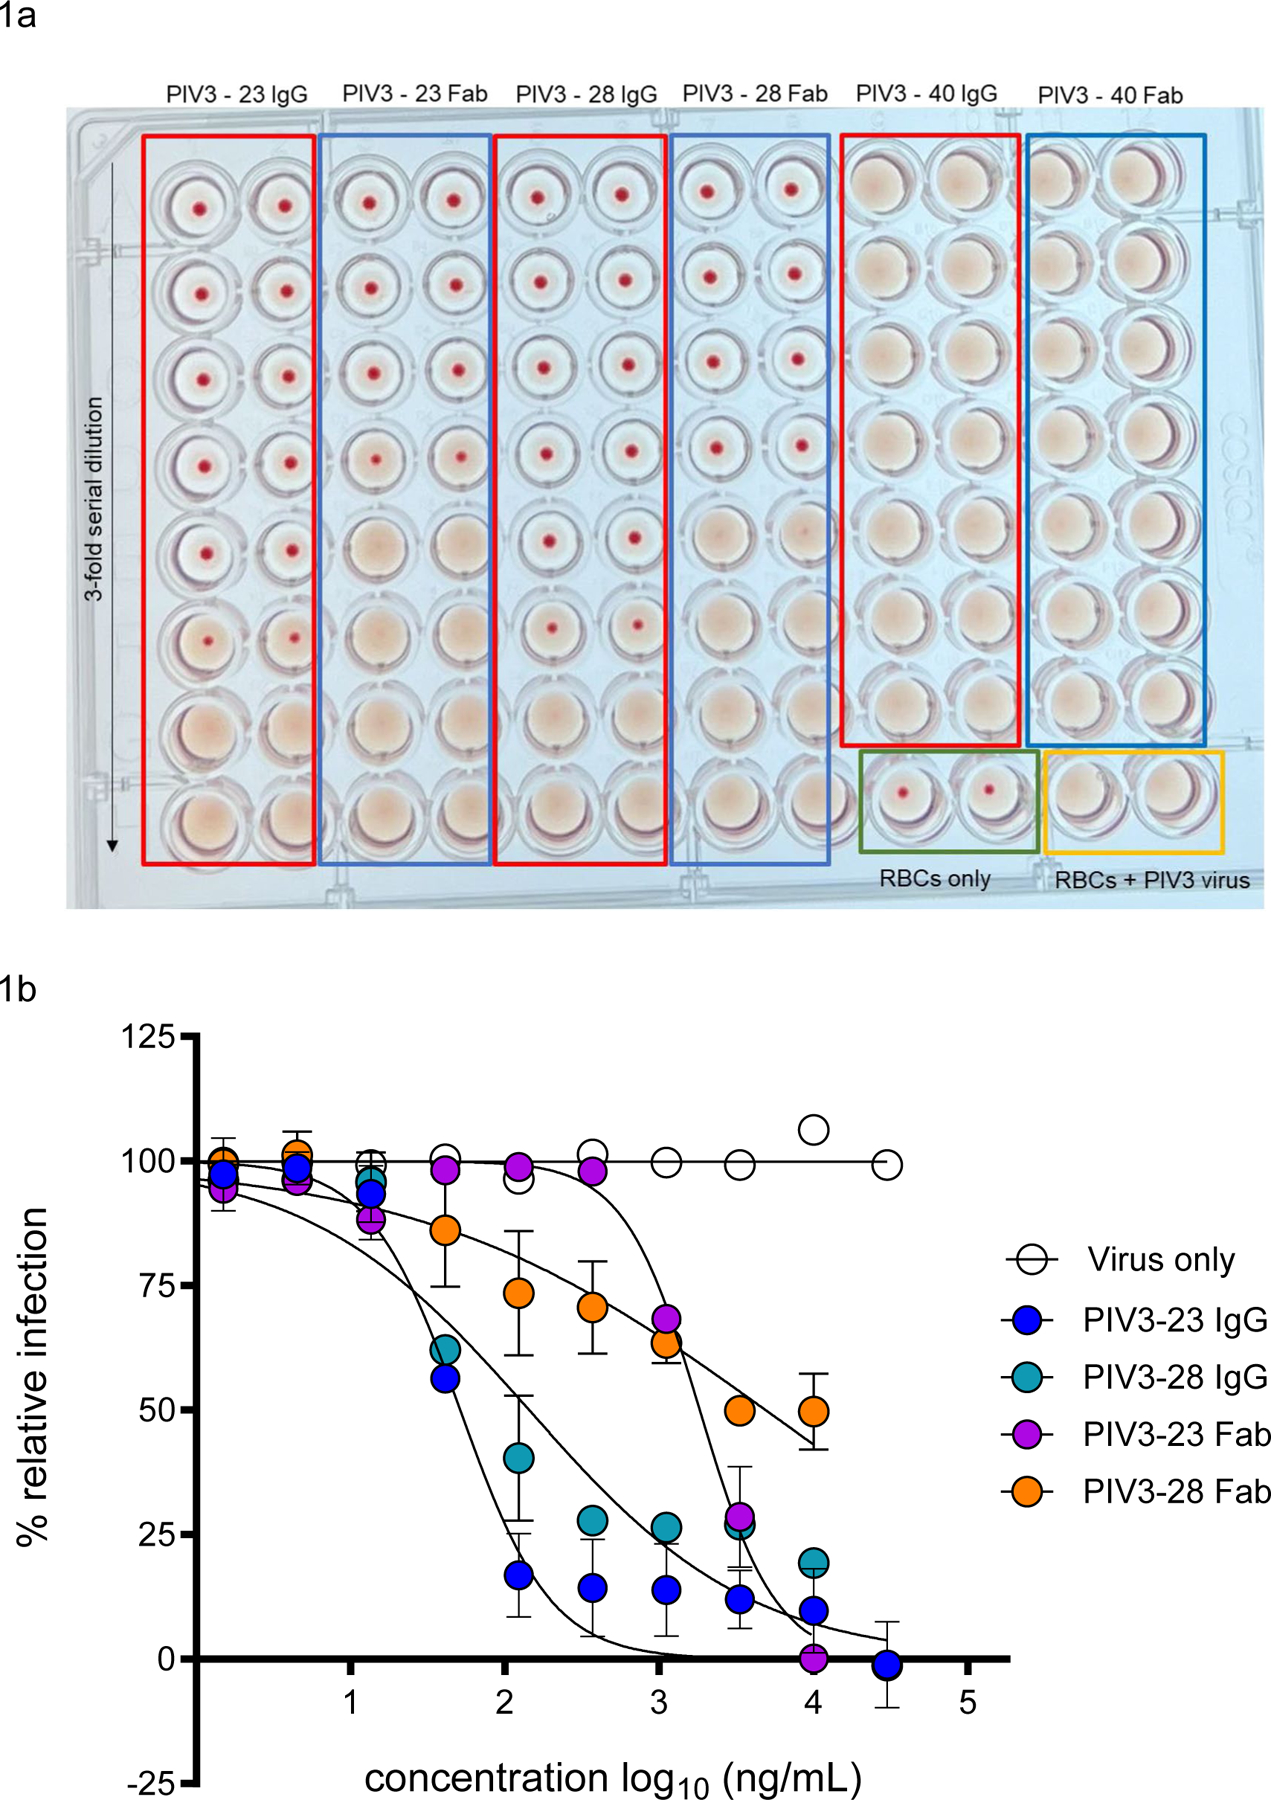
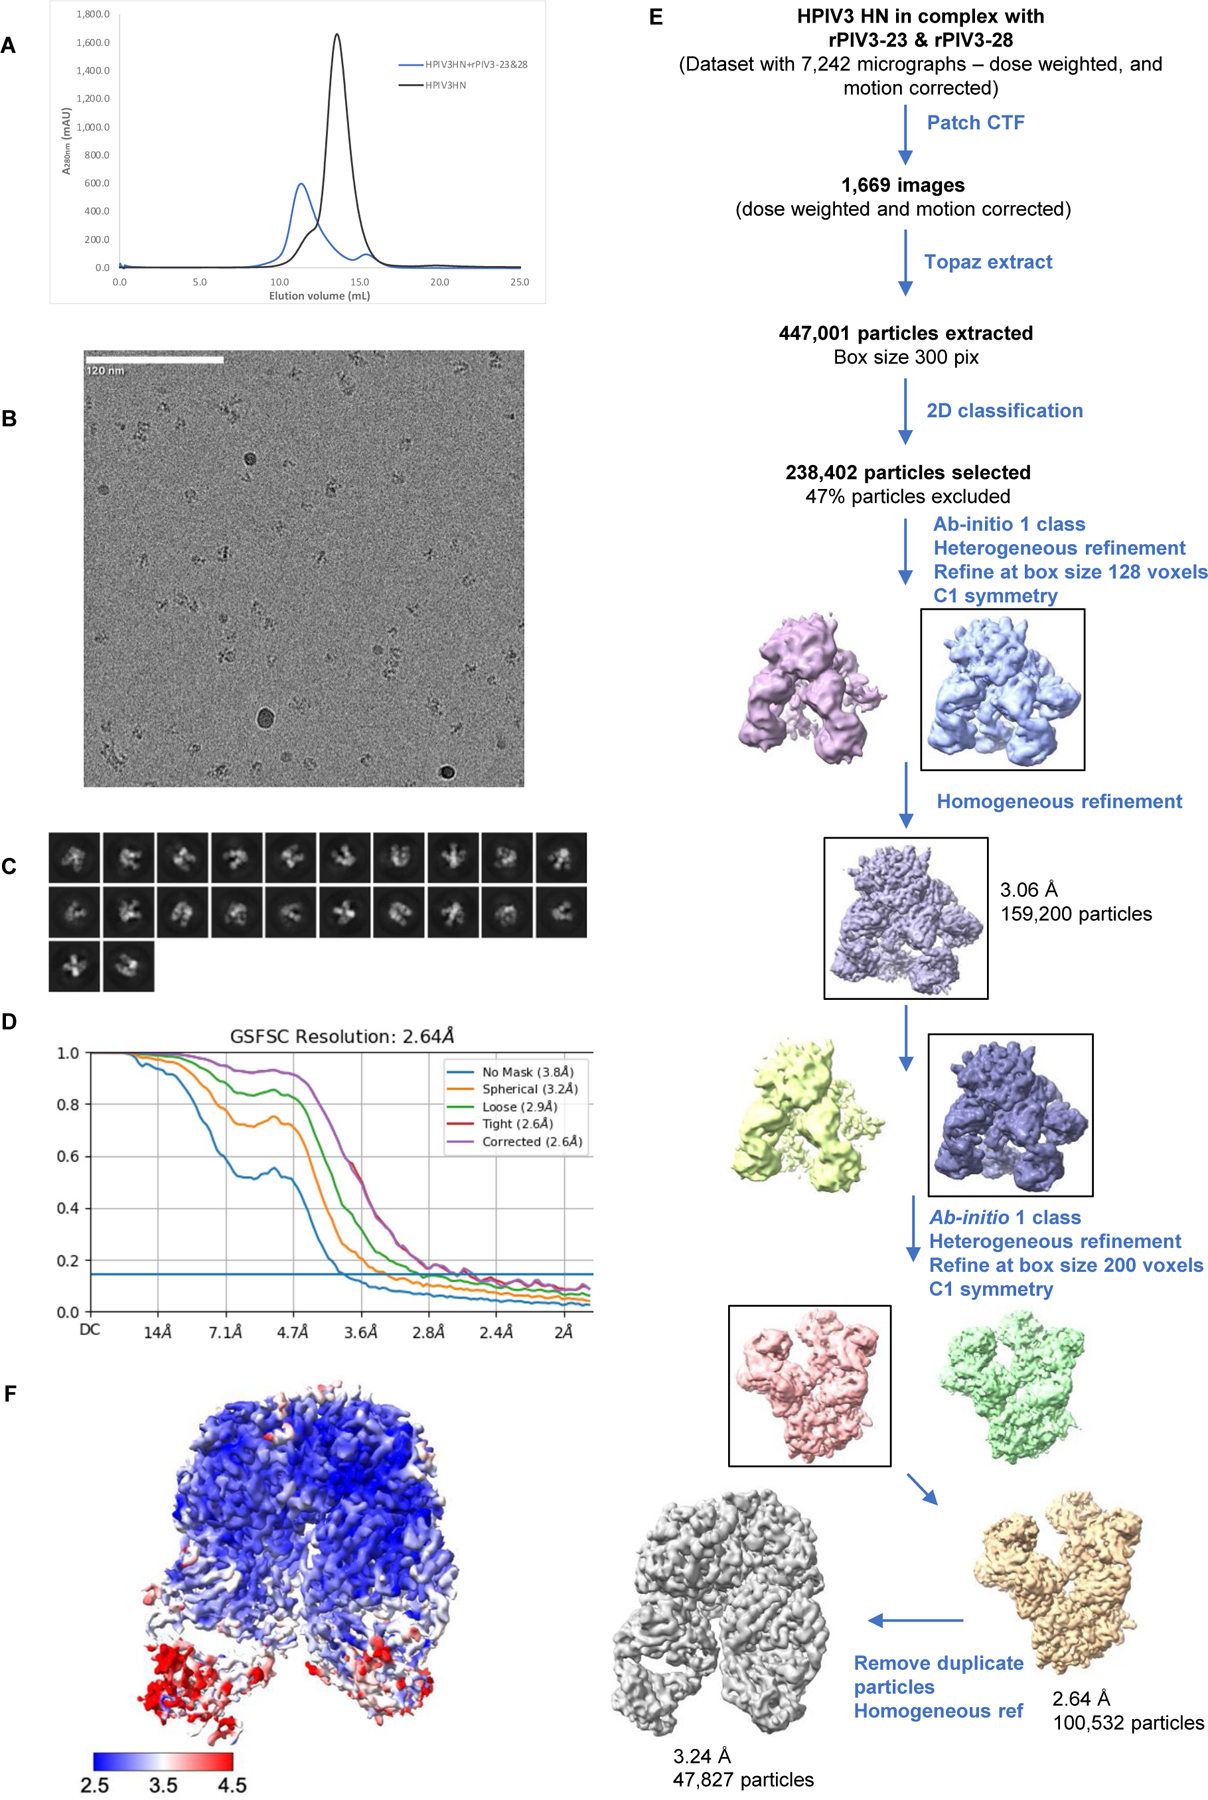
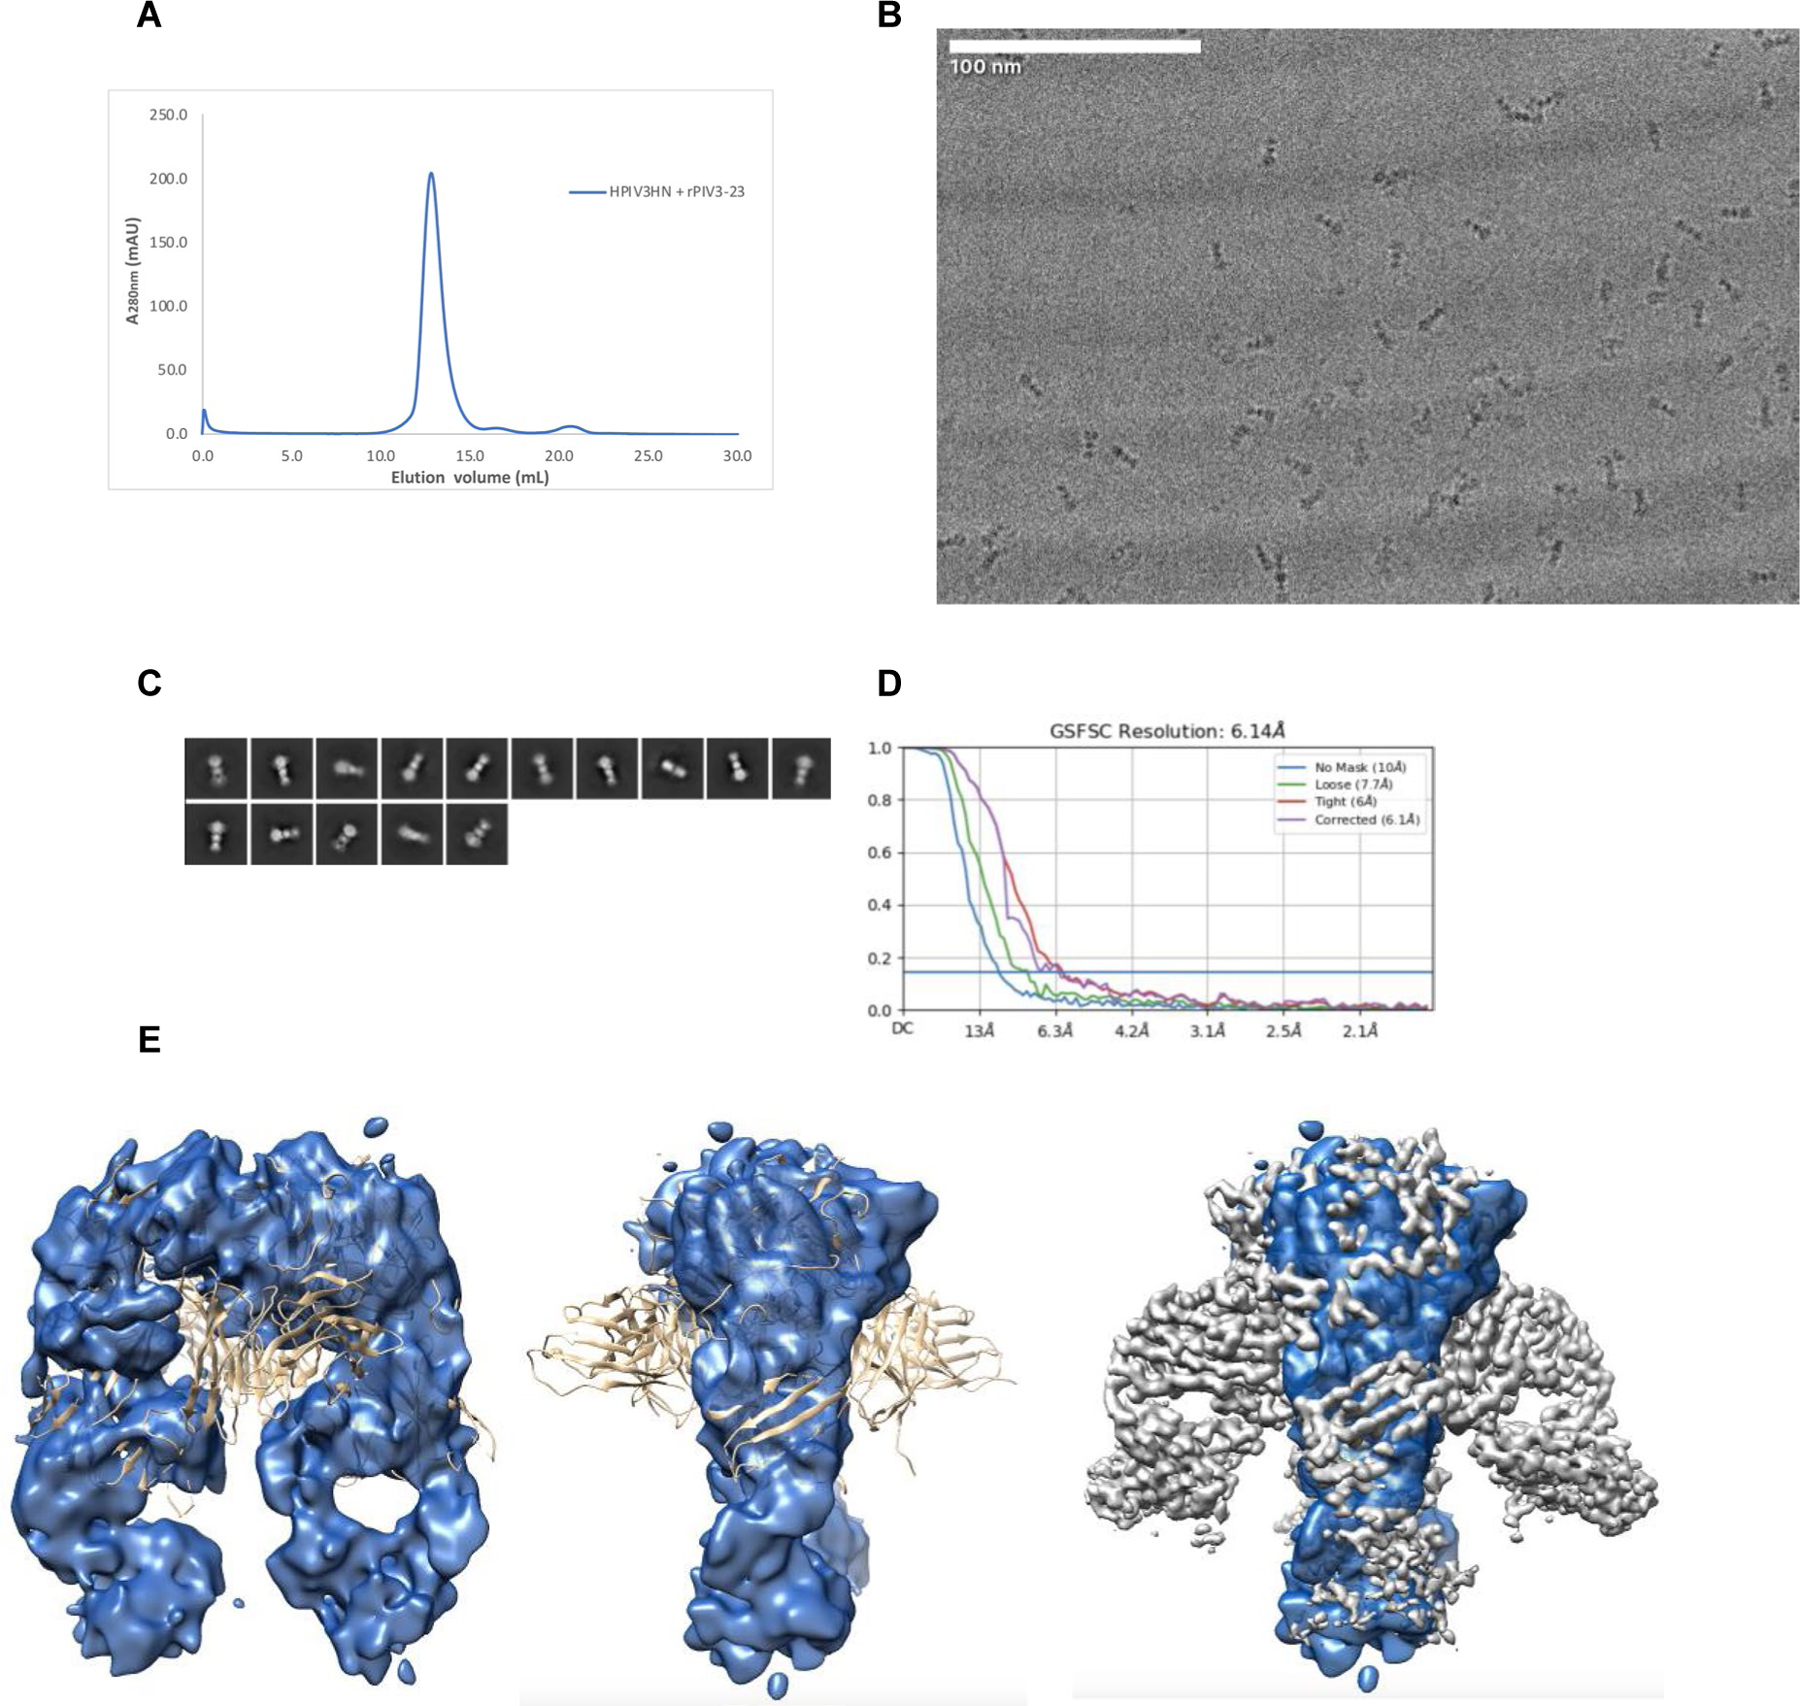
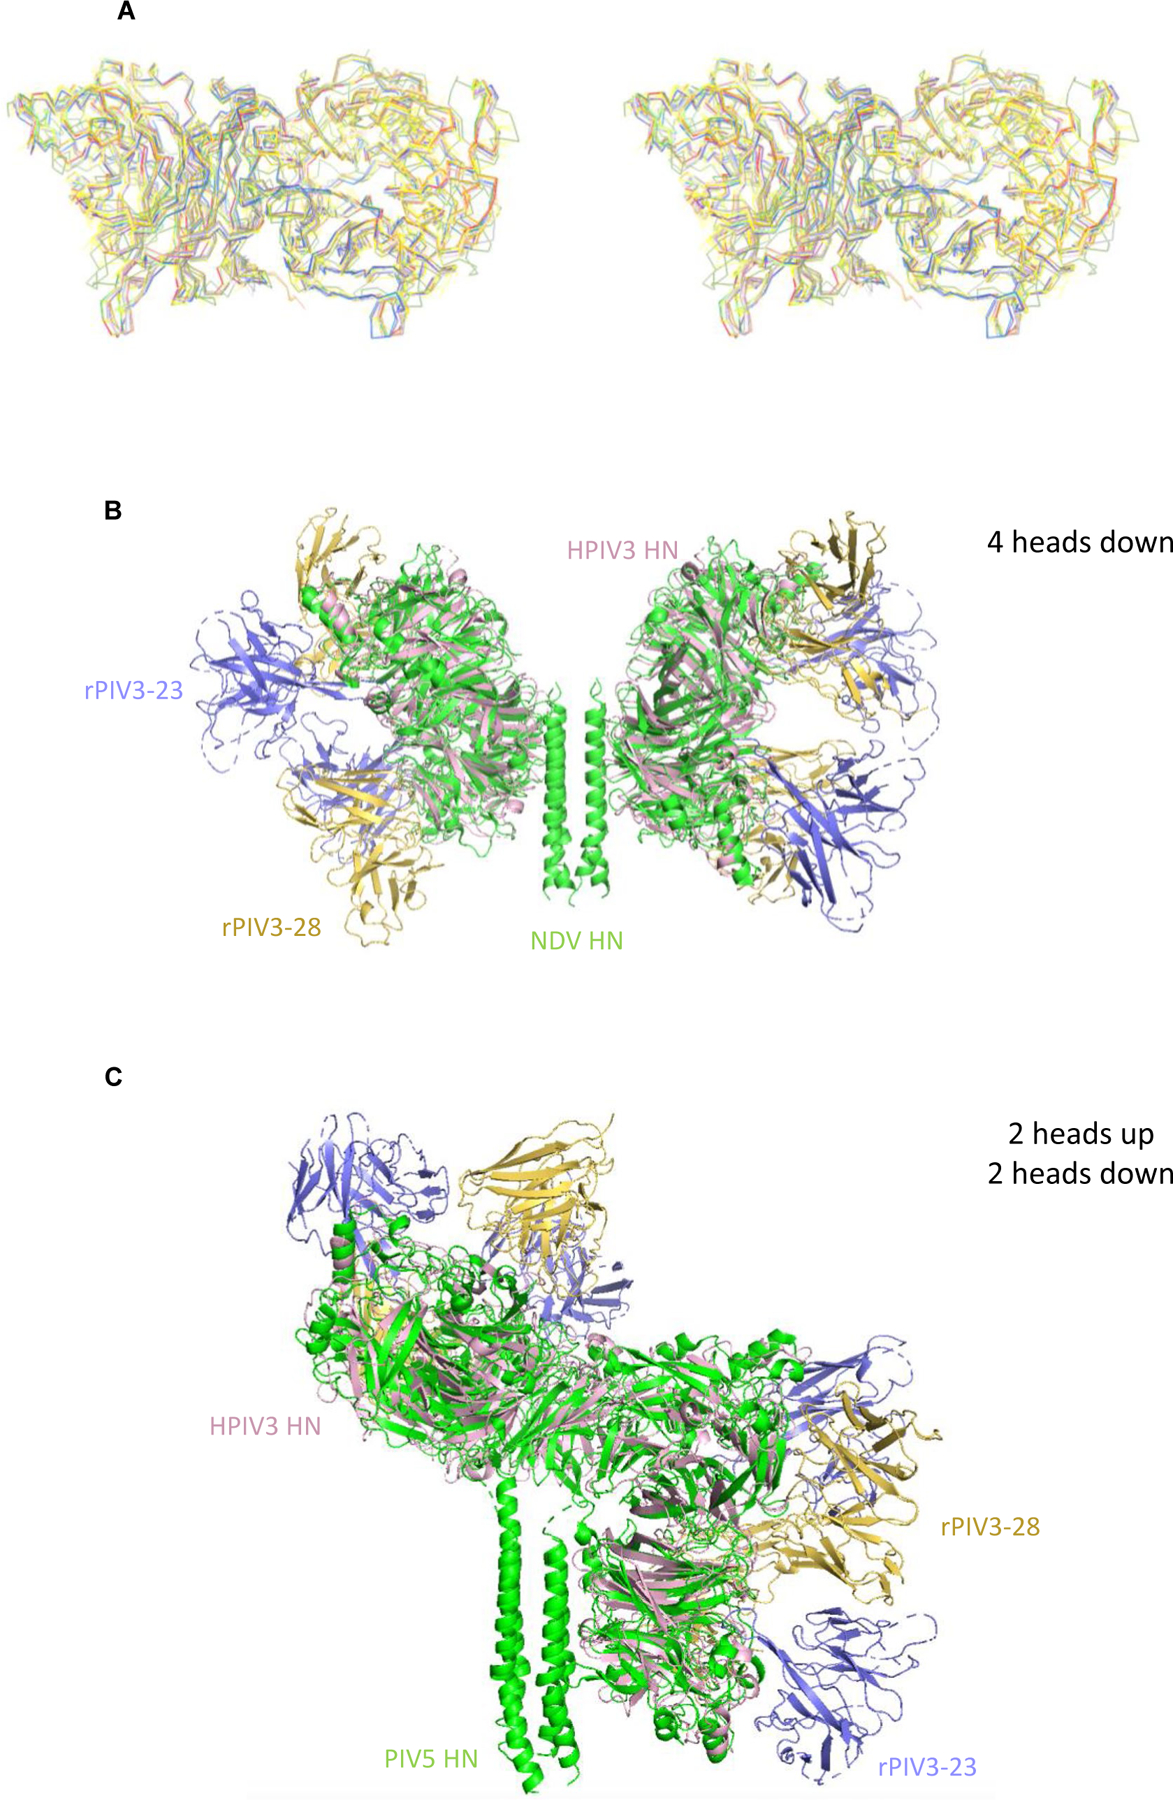
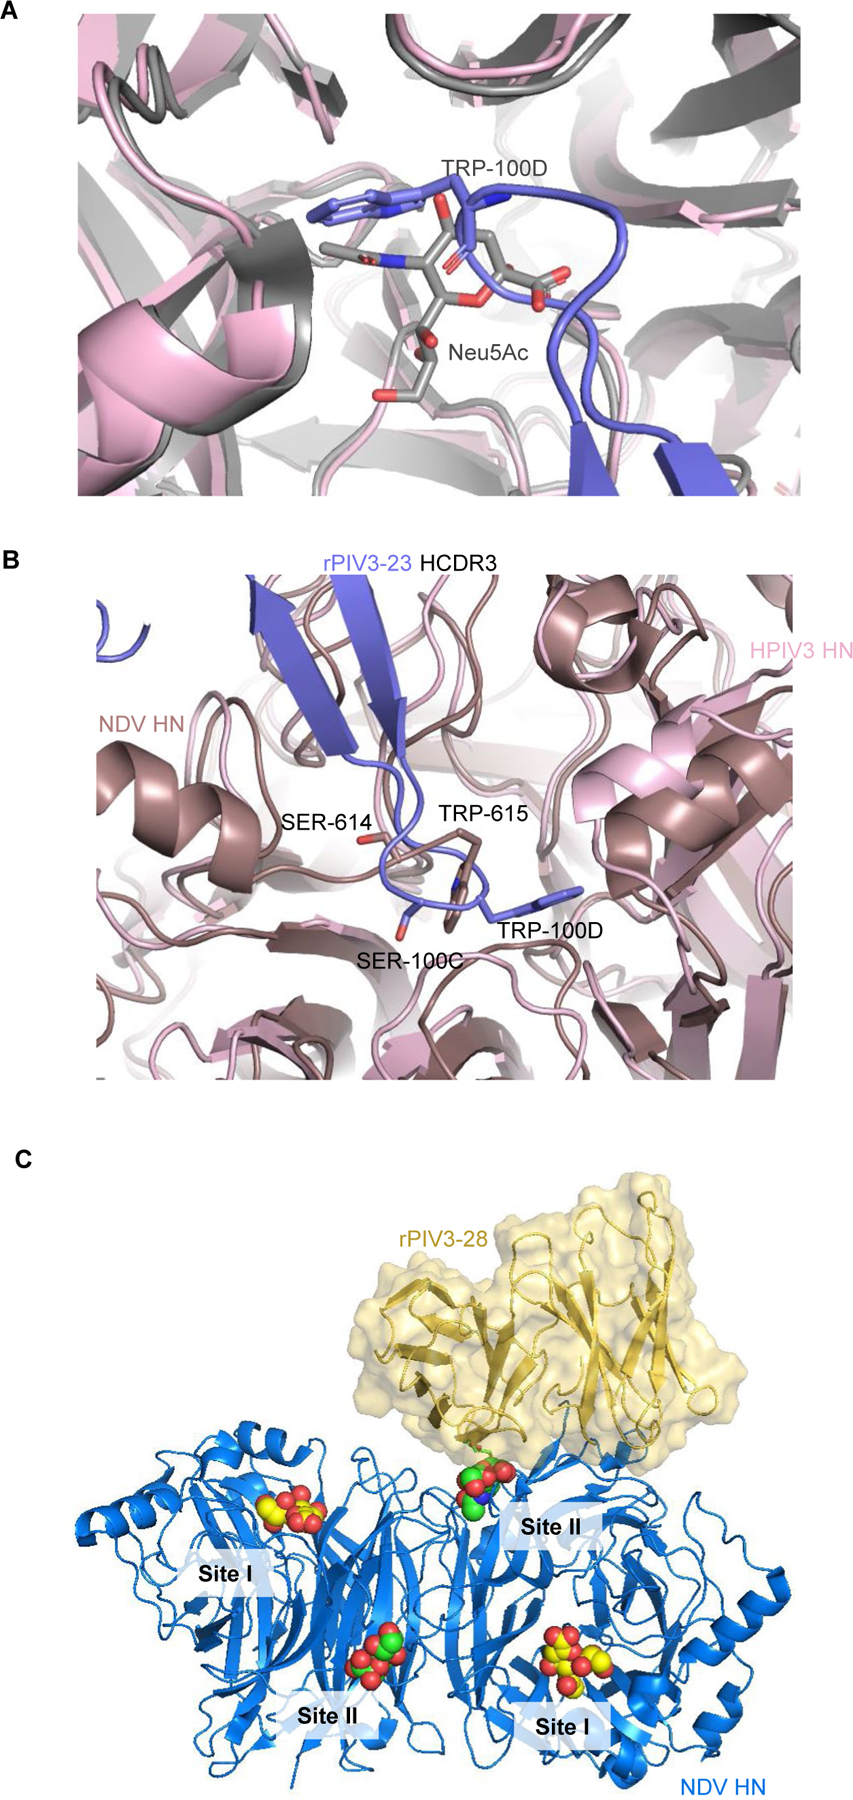
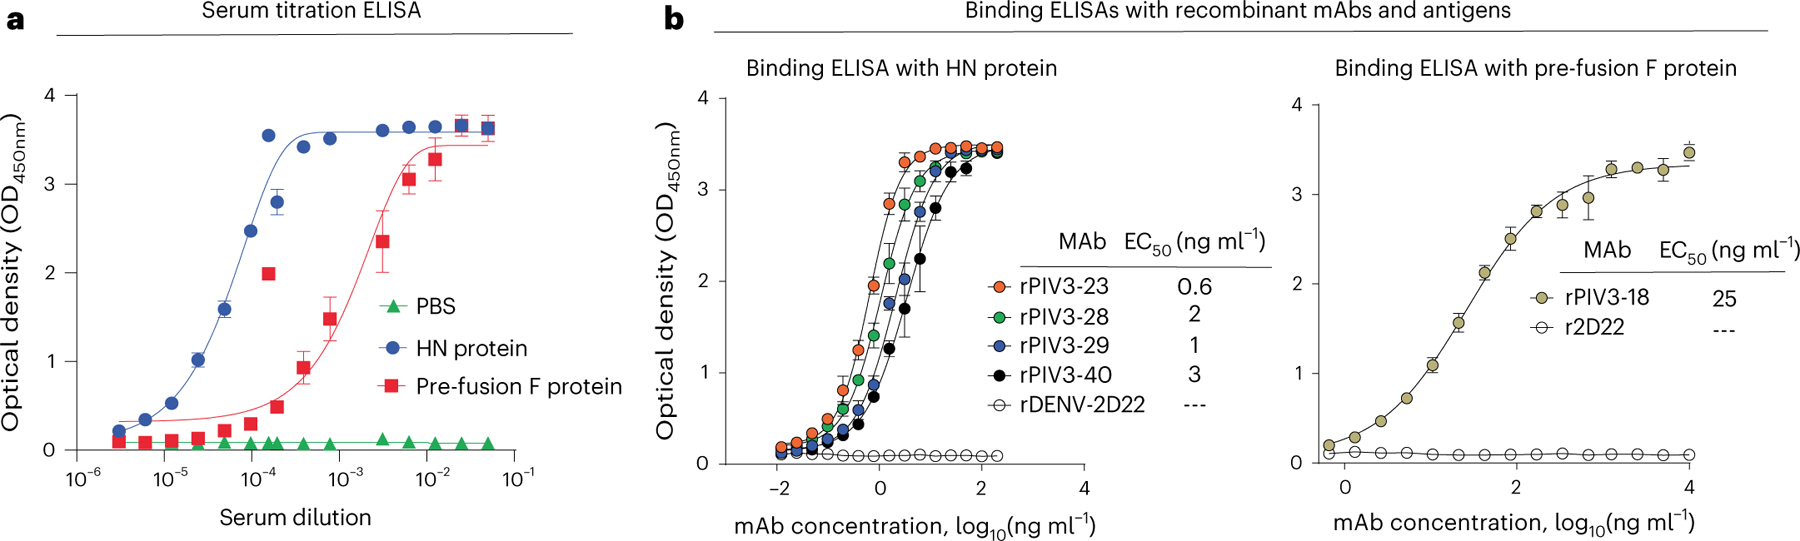
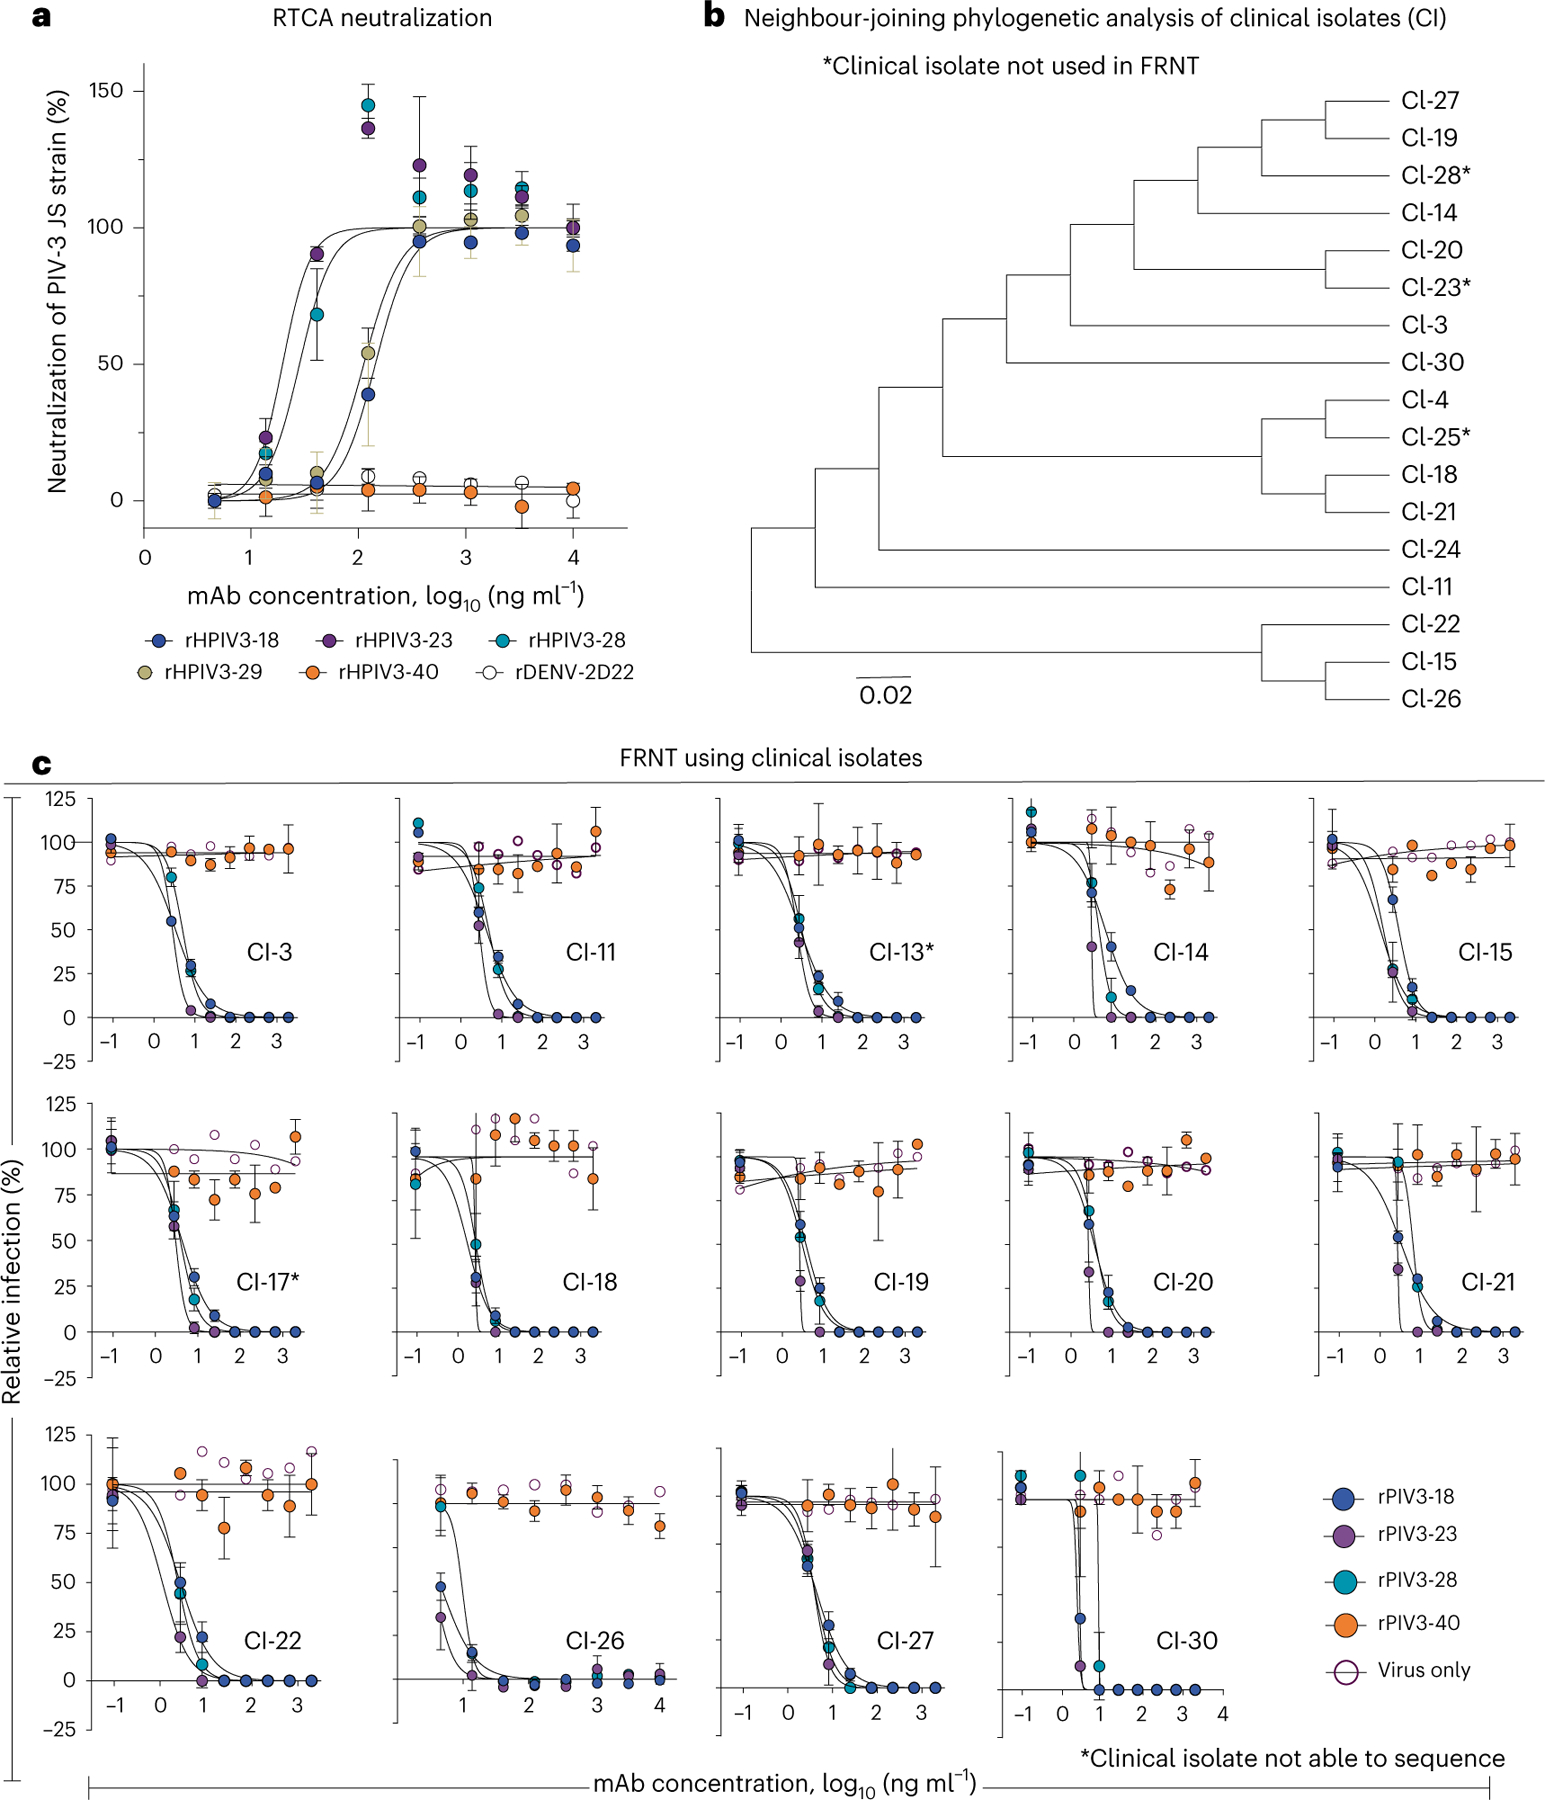
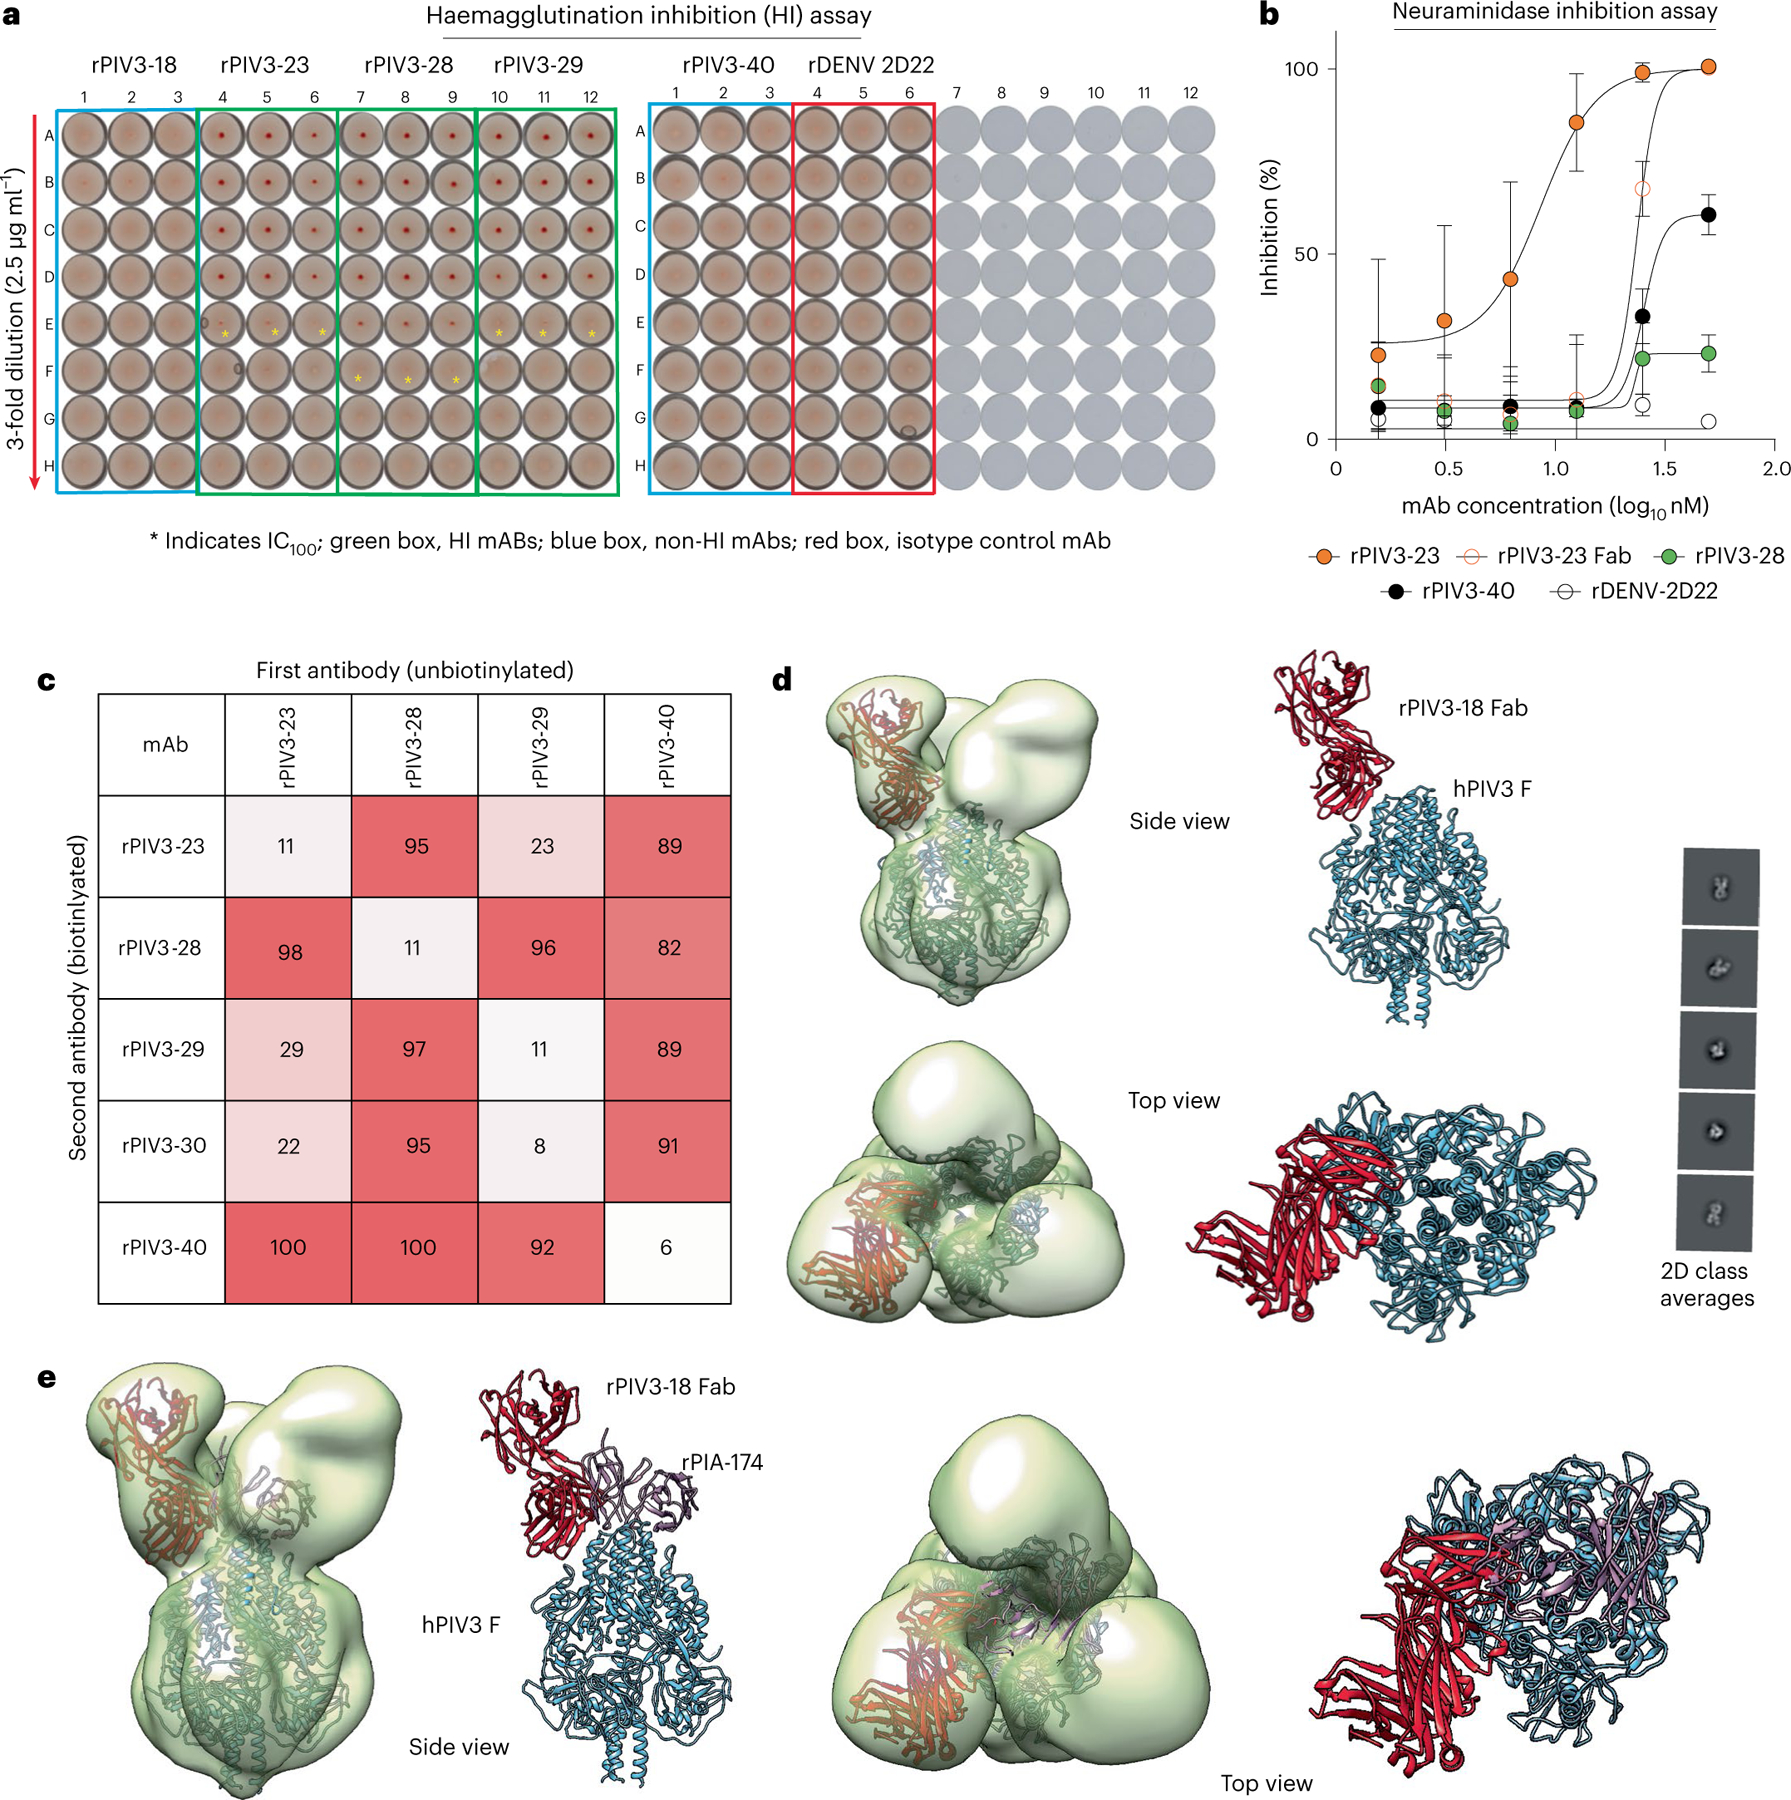
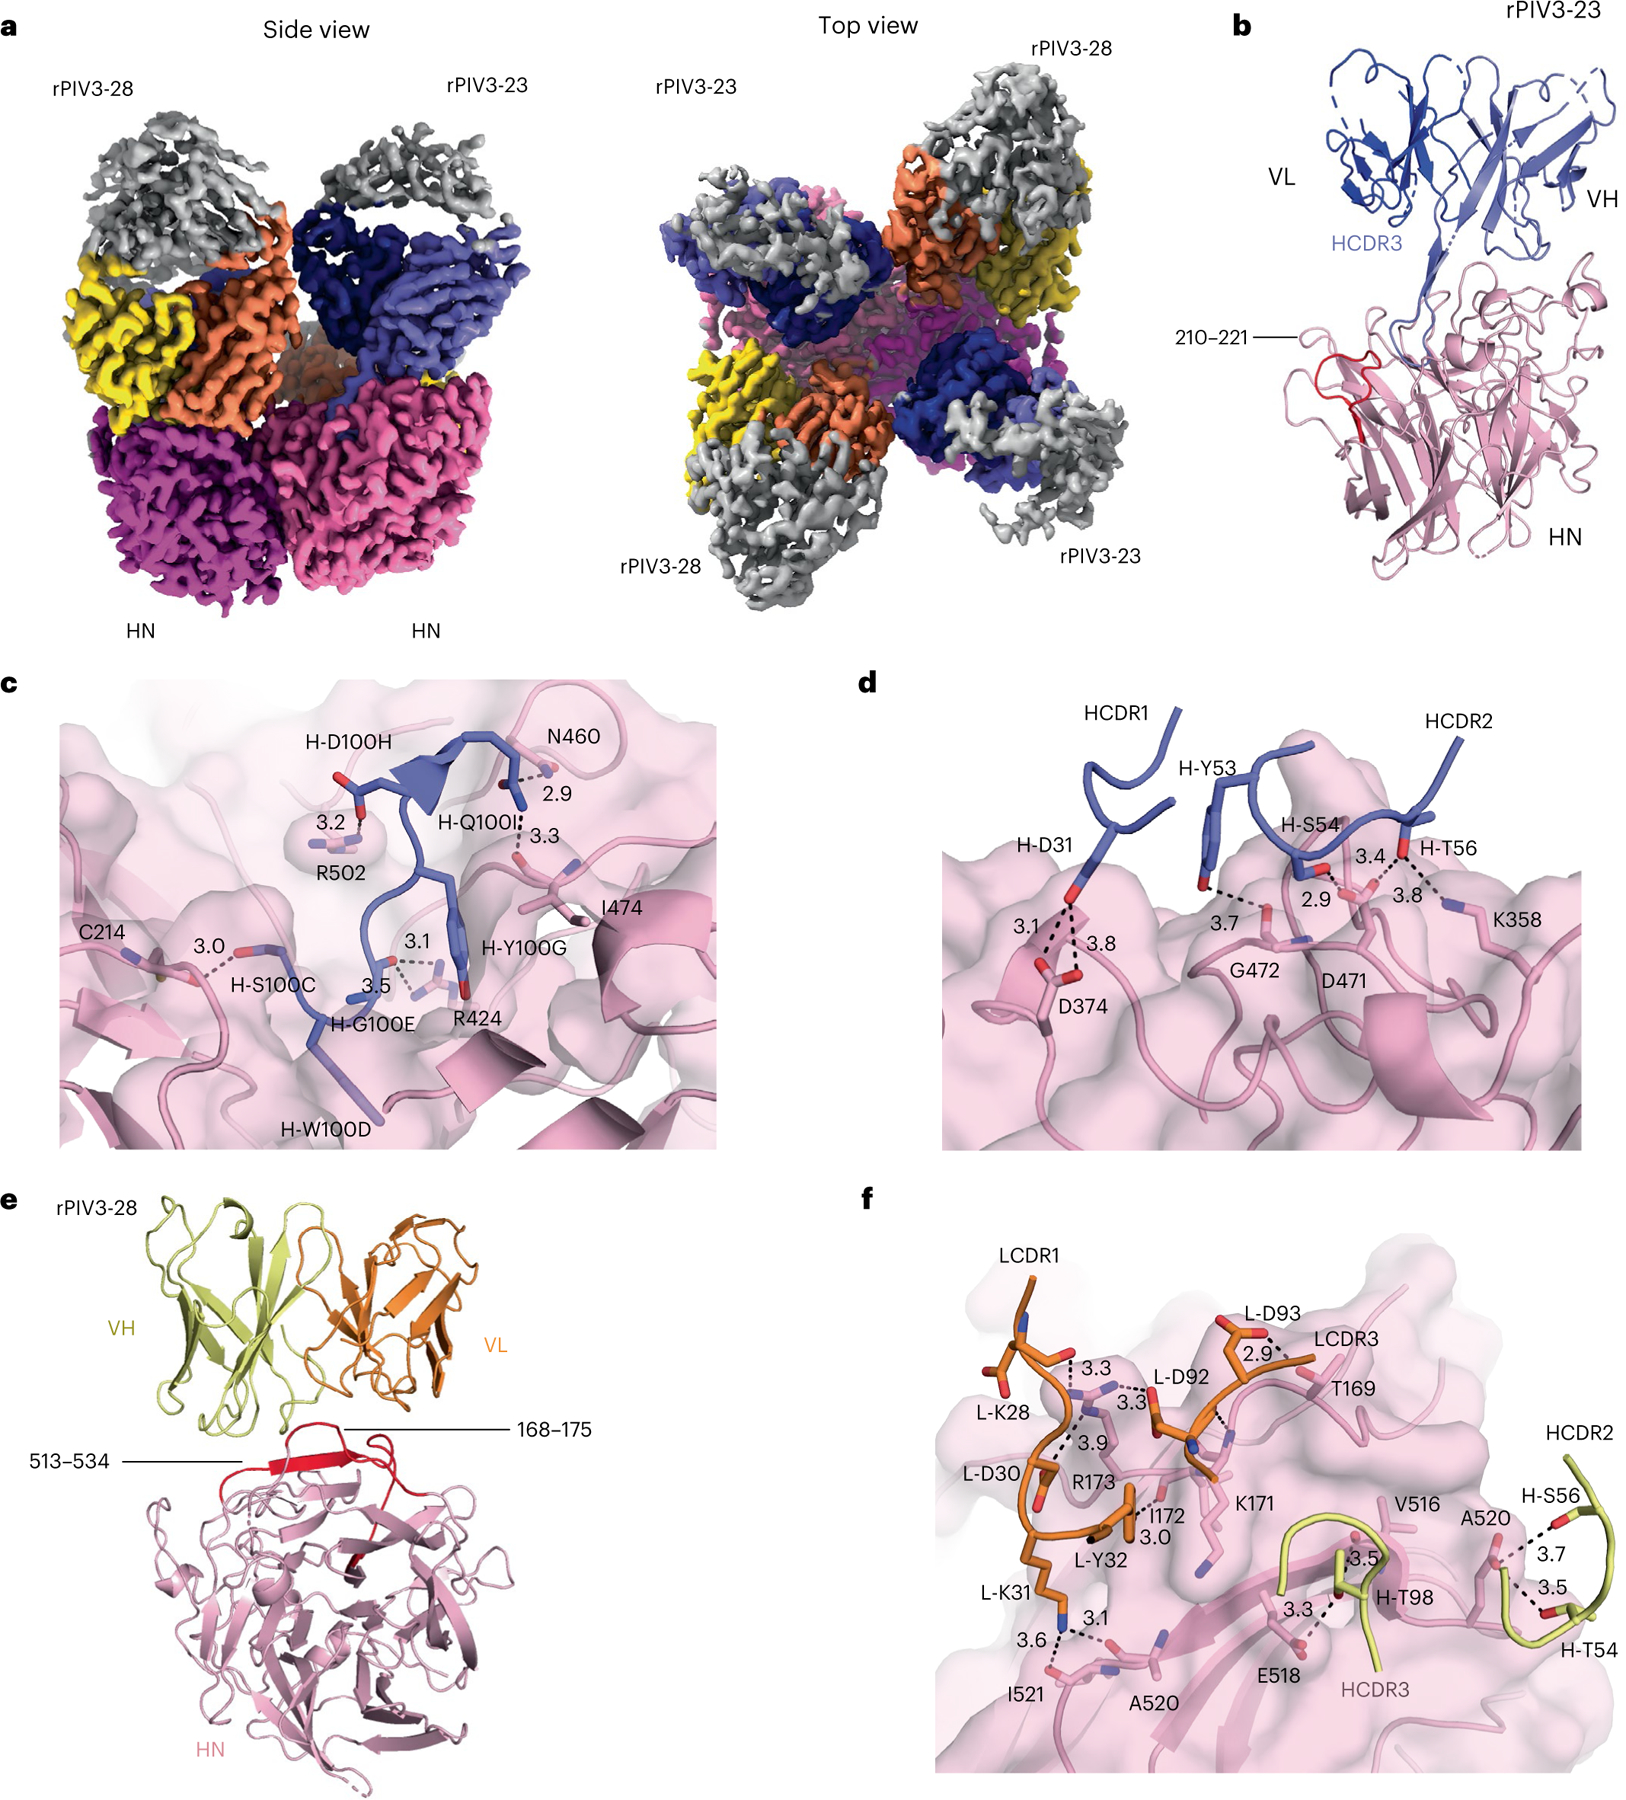
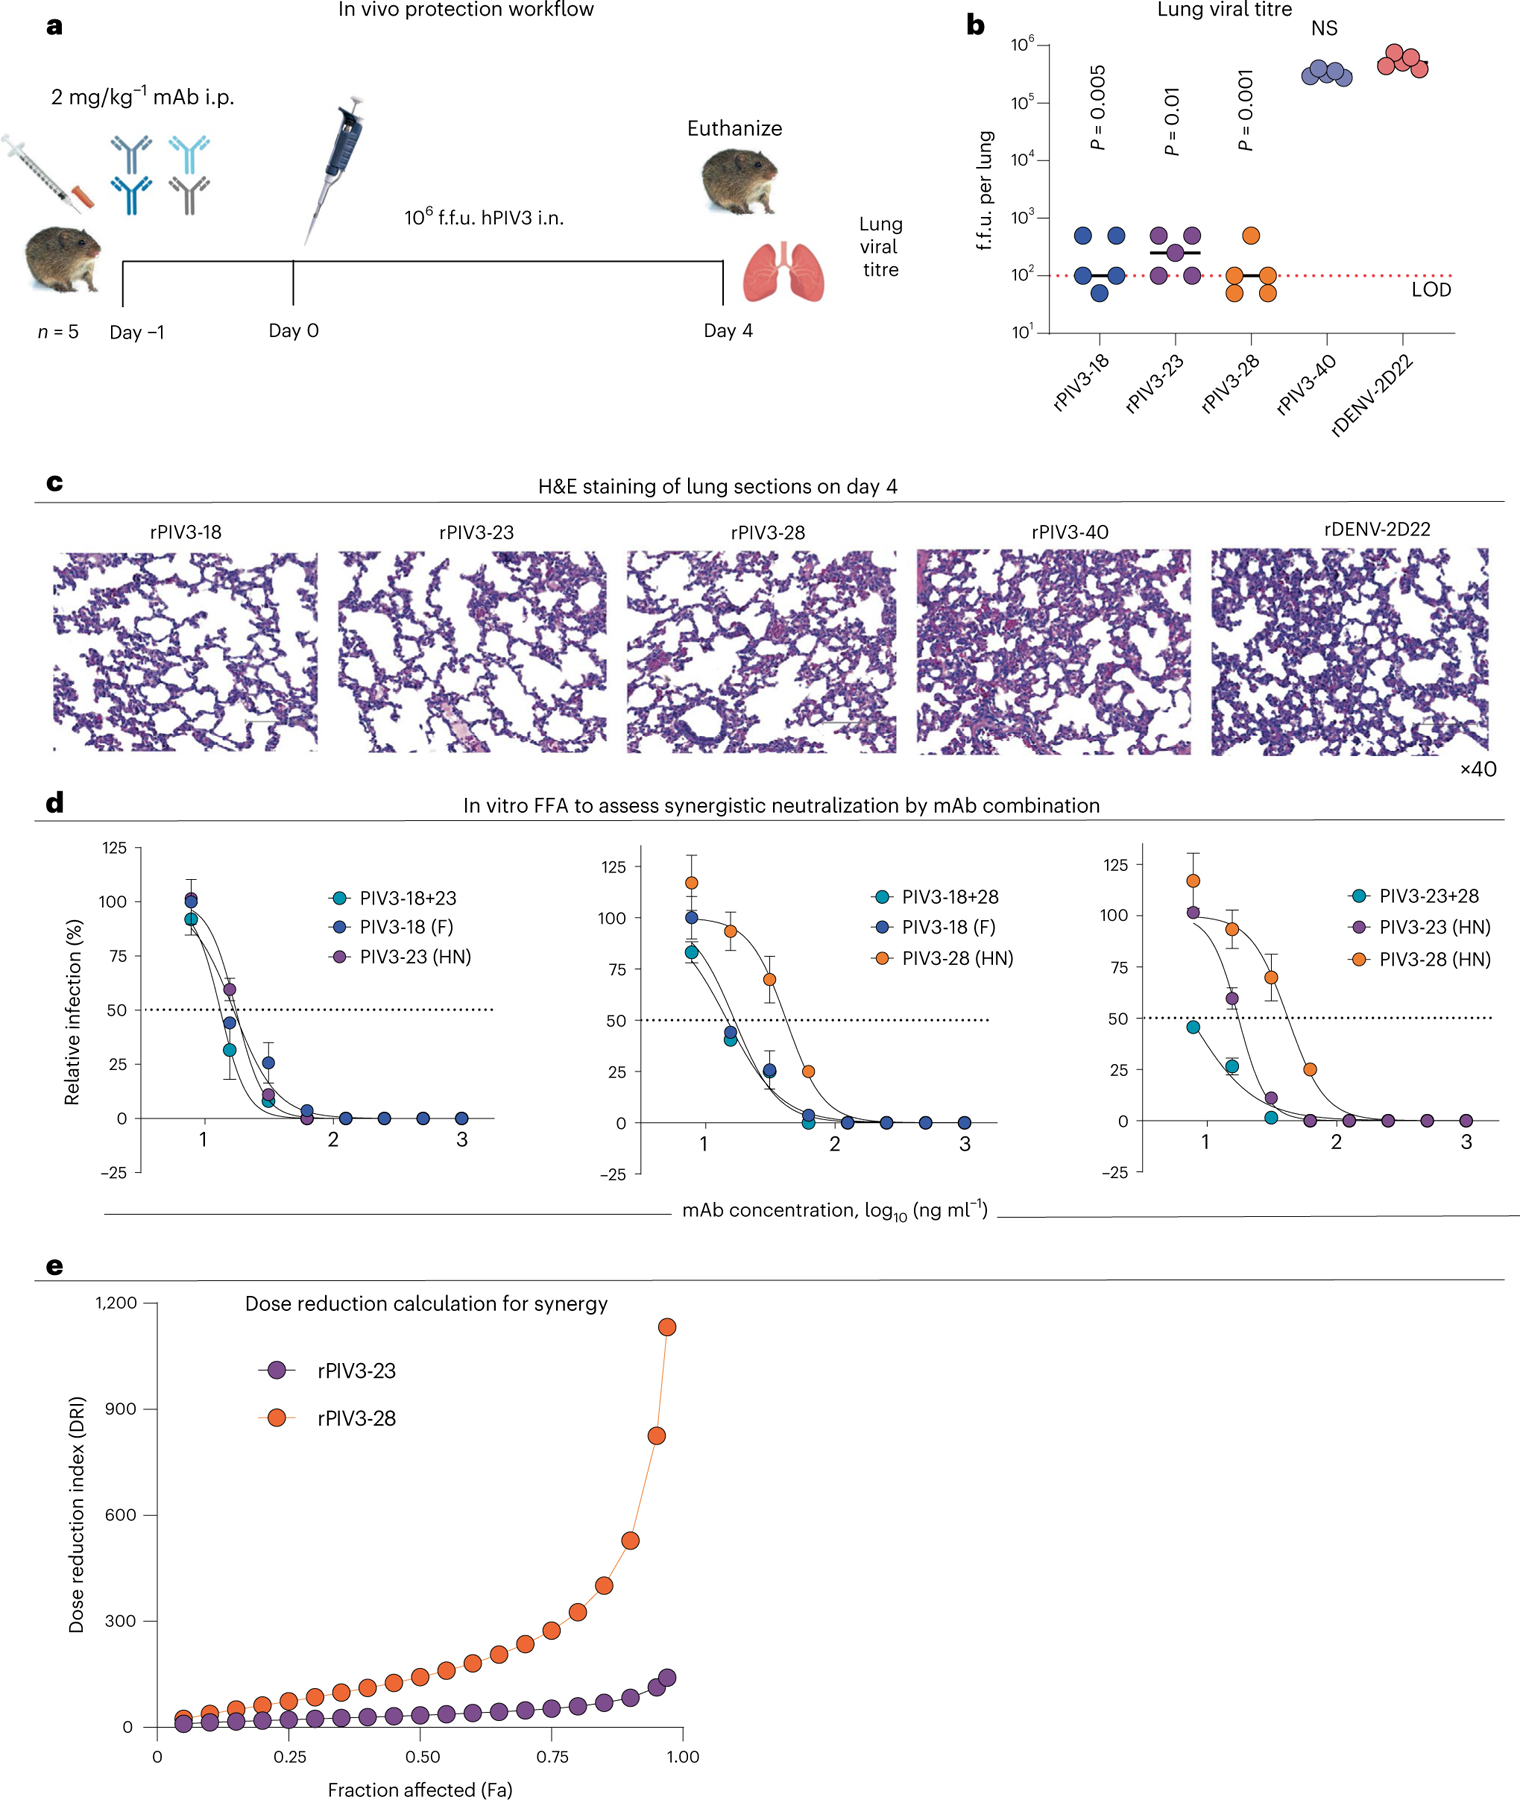
Human parainfluenza virus type 3 (hPIV3) is a respiratory pathogen that can cause severe disease in older people and infants. Currently, vaccines against hPIV3 are in clinical trials but none have been approved yet. The haemagglutinin-neuraminidase (HN) and fusion (F) surface glycoproteins of hPIV3 are major antigenic determinants. Here we describe naturally occurring potently neutralizing human antibodies directed against both surface glycoproteins of hPIV3. We isolated seven neutralizing HN-reactive antibodies and a pre-fusion conformation F-reactive antibody from human memory B cells. One HN-binding monoclonal antibody (mAb), designated PIV3-23, exhibited functional attributes including haemagglutination and neuraminidase inhibition. We also delineated the structural basis of neutralization for two HN and one F mAbs. MAbs that neutralized hPIV3 in vitro protected against infection and disease in vivo in a cotton rat model of hPIV3 infection, suggesting correlates of protection for hPIV3 and the potential clinical utility of these mAbs.


Conflict of interest statement

Competing interests

J.E.C. has served as a consultant for Luna Labs USA, Merck Sharp & Dohme Corporation, Emergent Biosolutions, and BTG International Inc., is a member of the Scientific Advisory Board of Meissa Vaccines, a former member of the Scientific Advisory Board of Gigagen (Grifols) and is founder of IDBiologics. The laboratory of J.E.C. received unrelated sponsored research agreements from AstraZeneca, Takeda Vaccines, and IDBiologics during the conduct of the study. T.S.J. has served as a consultant for Pfizer. A.L.G reports contract testing from Abbott, Cepheid, Novavax, Pfizer, Janssen and Hologic, and research support from Gilead, outside of the described work. A.M. reports potential future financial interests in Thylacine Biotherapeutics Inc. unrelated to the present study. All other authors declare no competing interests. Vanderbilt University has applied for a patent for some of the antibodies in this paper (2024 International Patent Application No. PCT/US2024/028239 based on US Serial No. 63/504,549).

Figures

Extended Data Fig. 1 |
Extended Data Fig. 1 |. Haemagglutination Inhibition assay and Fab neutralization.
1a. Haemagglutination Inhibition assay (Highlighted in Red- IgG, Blue -Fab, Green- RBCs only, Yellow - RBCs + PIV3 virus) 1b. Neutralization assay of PIV-3 virus using equimolar ratio IgG (30 µg/mL starting concentration) and Fabs (10 µg/mL starting concentration) of the PIV3 mAbs. Error bars indicate mean ± S.D.; data are representative of n = 2 independent experiments performed in technical triplicates.
Extended Data Fig. 2 |
Extended Data Fig. 2 |. Overview of the HPIV3 F and rPIV3-18 structure determination.
A. Comparison of the gel filtration profile for the HPIV3 F and the HPIV3 F: r-PIV3-18 complex. The complex was purified at least three times independently with consistent results. B. Motion corrected micrograph for HPIV3 F:rPIV3-18 complex (n = 11194). Two independent datasets were collected with similar results. C. Representative 2D class averages for HPIV3 F:rPIV3-18. D. FSC curves. E. Cryo-EM image processing flowchart. F. Local resolution map.
Extended Data Fig. 3 |
Extended Data Fig. 3 |. Overview of the HPIV3 HN and rPIV3-23:rPIV3-28 structure determination.
A. Comparison of the gel filtration profile for the HPIV3 HN and the HPIV3 HN: r-PIV3-23:rPIV3-28 complex. The complex was purified at least three times independently with consistent results. B. Motion-corrected micrograph for HPIV3 HN:rPIV3-23:rPIV3-28 complex (n = 7242). C. Representative 2D class averages for HPIV3 HN:rPIV3-23:rPIV3-28. D. FSC curves. E. Cryo-EM image processing flowchart. F. Local resolution map.
Extended Data Fig. 4 |
Extended Data Fig. 4 |. Overview of the HPIV3 HN and rPIV3-23 structure determination.
A. Gel filtration profile for the HPIV3 HN: r-PIV3-23 complex. The complex was purified at least two times independently with consistent results. B. Motion-corrected micrograph for HPIV3 HN:rPIV3-23 complex (n = 7524). C. Representative 2D class averages for HPIV3 HN:rPIV3-23. D. FSC curves. E. Comparison between the HPIV3 HN:rPIV3-23 density map (blue), the HPIV3 HN:rPIV3-23:rPIV3-28 atomic model (beige) and the HPIV3 HN:rPIV3-23:rPIV3-28 density map (gray).
Extended Data Fig. 5 |
Extended Data Fig. 5 |. Superimposition with HPIV3 HN dimer and tetramer structures.
A. Stereoview with superimposition of the HN complex with other paramyxovirus HN dimer structures (PDB IDs: 4WEF, 4MZA, 4MZE, 1V2I, 1V3B, 1V3D, 1V3C, 1V3E, 5KV9, 4XJR, 6C0M, 5KV8, 4XJQ and 1USR). B. Superimposition of the HPIV3 HN (light pink) +rPIV3-23 (purple) +rPIV3-28 (yellow) complex with the ‘4 heads down’ NDV HN tetramer (green) (PDB ID: 3T1E). C. Superimposition of the HPIV3 HN (light pink) +rPIV3-23 (purple) +rPIV3-28 (yellow) complex with the ‘2 heads up 2 heads down’ PIV5 HN tetramer (green) (PDB ID: 4JF7).
Extended Data Fig. 6 |
Extended Data Fig. 6 |. Comparison between the HPIV3 HN binding site with rPIV3-23 HCDR3 and the Neu5Ac.
A. Comparison between the HPIV3 HN binding site with rPIV3-23 (purple) HCDR3 and the Neu5Ac (PDB model ID 1V3C) bound. B. Comparison of Ulster strain NDV HN (old rose) with HPIV3 HN (light rose):rPIV3-23 (purple). Relevant residues are displayed as sticks. C. Superimposition of NDV HN dimer with Neu5Acen (yellow) and Neu5Ac (green) displayed as spheres (PDB ID 1USR). Glycan represented as sticks. A single rPIV3-28 Fab (yellow) is shown binding to the HN dimer for clarity.
Fig. 1 |
Fig. 1 |. Strong binding of hPIV3 mAbs to surface glycoproteins of hPIV3.
a, Serum or plasma antibody reactivity for the donor assessed by ELISA using hPIV3-recombinant HN, recombinant pre-fusion F proteins or PBS. Optical density at 450 nm (OD450) was measured using a microplate reader. Data are mean ± s.d. of n = 2 independent experiments performed in technical triplicates. b, Left: ELISA binding of hPIV3 mAbs to HN protein. Data are mean ± s.d. of technical duplicates from a representative experiment repeated twice. Right: ELISA binding of hPIV3 mAbs to pre-fusion F trimeric protein. Data are mean ± s.d. of technical duplicates from a representative experiment repeated twice.
Fig. 2 |
Fig. 2 |. Potent neutralizing activity of PIV3 mAbs against PIV3 clinical isolates.
a, Neutralization curves for hPIV3 mAbs and rDENV-2D22 in an hPIV3 JS strain neutralization assay using RTCA. Data are mean ± s.d. of n = 2 independent experiments performed in technical triplicates. b, Phylogenetic tree obtained after alignment of hPIV3 clinical isolate sequences to its parental strain CI-1. Clinical isolates with asterisks were used for FRNT neutralization studies; clinical isolates with asterisks were not used because of insufficient titres for performing reliable FRNT assays. c, FRNT for hPIV3 mAbs and rDENV-2D22 in hPIV3 clinical isolate virus neutralization assays. Data are mean ± s.d. of n = 2 independent experiments performed in technical triplicates.
Fig. 3 |
Fig. 3 |. HN-reactive mAb rPIV3-23 inhibits hPIV3 virus by diverse mechanisms, competition ELISA of HN-reactive mAbs and rPIV3-18 binding map to the pre-fusion F protein of hPIV3.
Individual mAbs were assessed for virus neutralization using HI and NI assays. a, Representative image of the HI assays. Data shown represent 1 of 2 independent experiments. Haemagglutinin-inhibiting hPIV3 mAbs are highlighted in green and non-inhibiting mAbs are highlighted in blue. Isotype-matched control mAb is indicated by red colour. Yellow asterisks in the wells indicate IC100 of the mAbs for haemagglutinin inhibition. b, NI test for HN-binding rPIV3 mAbs, rPIV3-23 Fab and isotype control rDENV-2D22 using the PIV3-CI-24 clinical isolate. Data are mean ± s.d. of n = 2 independent experiments performed in technical triplicates. c, Competition binding of the panel of HN-reactive hPIV3 mAbs. Binding of hPIV3 mAbs to HN protein was measured in the presence of saturating concentration of competitor mAb in a competition ELISA and normalized to binding in the presence of rDENV-2D22. White indicates full competition (<25% binding of reference antibody), pink indicates partial competition (25% to 60% binding of reference antibody) and red indicates no competition (>60% binding of reference antibody). d, Side view (top left) and top view (bottom left) of PIV3-18 Fab pre-fusion F trimer complexes visualized by negative-stain EM for rPIV3-18 Fab model in red, pre-fusion F protein in blue, 3D volume of PIV3-18 Fab pre-fusion F trimer complex in yellow. Right: representative 2D class averages for each complex (box size is 128 pixels, with 4.36 Å per pixel). Data are from a single experiment; detailed collection statistics are provided in Supplementary Table 1. e, Superimposed rPIV3-18 Fab pre-fusion F protein negative-stain EM. Side view (left) and top view (right) of rPIV3-18 Fab pre-fusion F trimer complexes visualized by negative-stain EM for rPIV3-18 Fab model in red, PIA174 Fab in purple, pre-fusion F protein in blue or 3D volume of rPIV3-18 Fab pre-fusion F trimer complex in yellow.
Fig. 4 |
Fig. 4 |. Cryo-EM structure of the rPIV3-18 and hPIV3 F complex.
a, Cryo-EM map of the hPIV3 bound to Fab rPIV3-18. The density that corresponds to the different hPIV3 F protomers is coloured in dark green, bright green and yellow, and the three copies of the rPIV3-18 are coloured in light blue (VH chain) and cyan (VL chain). The grey colour corresponds to low-resolution regions of the rPIV3-18 CH and CL domains. b, Cartoon representation of rPIV3-18 (cyan, light chain; light blue, heavy chain) bound to hPIV3 F protomer (in green). F domains DI through DIII and heptad repeat B (HRB) are indicated. F protein segments involved in the rPIV3-18 epitope (58–66 and 184–193) are indicated in red. c, Enlarged view of the interaction between hPIV3 F (green) and rPIV3-18 (cyan and light blue), with key residues represented in stick format. A transparent surface for the F subunit is shown and the 184–193 and 58–66 segments are indicated. Hydrogen bonds are indicated with dotted black lines. d, Comparison between the binding to F trimers of rPIV3-18 (left) and other anti-hPIV3 F-specific neutralizing antibodies, PIA174 (middle) or 3×1 (right). PIA174 engages multiple protomers of the F trimer, resulting in a stoichiometry of 1 Fab per trimer. The 3×1 Fab binds an epitope that is located near the midsection of the F trimer head. Sites of amino acid variation in F across 255 hPIV3 F sequences are indicated as a gradient from pale yellow (most variable) to steel blue (conserved). e, Distortion of the central three-helix bundle of the hPIV3 pre-fusion F in the rPIV3-18 complex (green) relative to the PIA174 complex (pale blue) to accommodate three copies of the antibody. f, rPIV13-18 binding separates the central F helices, causing a gap in the core of the fusion protein (left) as compared with PIA174 complex (right). The view is directly down the 3-fold axes of the F trimer.
Fig. 5 |
Fig. 5 |. Cryo-EM structure of the rPIV3-23 and rPIV3-28 Fabs bound to the hPIV3 HN dimer.
a, Cryo-EM map of the hPIV3 HN bound to rPIV3-23 and rPIV3-28 Fabs. hPIV3 HN dimer density is coloured in magenta and pink, two copies of rPIV3-23 in purple (VH chain) and dark blue (VL chain), and two copies of the rPIV3-28 in yellow (VH chain) and orange (VL chain). The grey colour corresponds to low-resolution regions of the rPIV3-23 and rPIV3-28 CH and CL domains. b, Cartoon representation of one rPIV3-23 Fab (purple) copy bound to hPIV3 HN monomer (light pink). rPIV3-23 recognizes HN using only its heavy-chain CDRs. The HN-216 loop is indicated in red. c, Enlarged view of the interactions between the hPIV3 HN (pink) active site and rPIV3-23 (purple) HCDR3 with key residues represented as sticks. Hydrogen bonds are indicated with black dotted lines and a transparent surface for HN is shown. d, Enlarged view of the interactions between the hPIV3 HN (pink) and HCDR1 and HCDR2 of rPIV3-23 (purple). Interacting residues are represented as sticks, hydrogen bonds shown as dotted black lines and a transparent surface for HN is shown. e, Cartoon representation of one rPIV3-28 Fab (yellow and orange) copy bound to hPIV3 HN monomer (light pink). CDR regions of the antibody are indicated and interacting HN segments (residues 168–175 and 513–534) are coloured red. f, Detailed view of the interactions between hPIV3 HN (light pink) and rPIV3-28 (yellow for VH and orange for VL). Key residues from rPIV3-28 CDR loops shown in stick format and hydrogen bonds across the interface are indicated with dotted lines. The HCDR and LCDR loops are labelled, and a transparent surface is shown for HN.
Fig. 6 |
Fig. 6 |. PIV3 mAbs mediate prophylactic protection in cotton rats challenged with PIV3-CI-24 and synergize for neutralization.
Ten-week-old female cotton rats were inoculated with 106 f.f.u. of PIV3-CI-24. A day before the virus challenge, cotton rats were given i.p. administration of 2 mg kg−1 of PIV3 mAbs or DENV-2D22, an isotype-matched control mAb. a, Schematic showing in vivo model of cotton rat to study protective efficacy of hPIV3 mAbs indicating routes and days of antibody or virus administration, and days of tissue collection for lung tissue FFA virus load assay. b, Viral titre/burden at 4 days post infection in the lungs, measured by FFA assay; comparisons were made using a Kruskal–Wallis ANOVA with Dunn’s post hoc test (n = 5 cotton rats per group). NS, not significant. LOD, limit of detection. c, H&E-stained lung sections of n = 1 cotton rat per group. d, In vitro cooperative neutralization of PIV3-CI-24 by the combination. Dose–response neutralization curves by rPIV3-18 alone (blue), rPIV3-23 alone (purple), rPIV3-28 alone (orange) or a 1:1 mixture (teal) of mAbs shown in the graphs. Data represent one of n = 2 experiments with similar results. Dotted line indicates 50% relative infection. e, Analysis of synergy between rPIV3-23 (purple) and rPIV3-28 (orange) in neutralization of PIV3-CI-24 performed as in b. DRI, dose reduction index; Fa, fraction affected (neutralized).

Similar articles

Cited by

References

    1. Chanock RM et al. Newly recognized myxoviruses from children with respiratory disease. N. Engl. J. Med 258, 207–213 (1958). - PubMed
    1. Shah DP, Shah PK, Azzi JM & Chemaly RF Parainfluenza virus infections in hematopoietic cell transplant recipients and hematologic malignancy patients: a systematic review. Cancer Lett 370, 358–364 (2016). - PMC - PubMed
    1. Fontana L & Strasfeld L Respiratory virus infections of the stem cell transplant recipient and the hematologic malignancy patient. Infect. Dis. Clin. North Am 33, 523–544 (2019). - PMC - PubMed
    1. Moscona A & Peluso RW Fusion properties of cells persistently infected with human parainfluenza virus type 3: participation of hemagglutinin-neuraminidase in membrane fusion. J. Virol 65, 2773–2777 (1991). - PMC - PubMed
    1. Porotto M et al. Regulation of paramyxovirus fusion activation: the hemagglutinin-neuraminidase protein stabilizes the fusion protein in a pretriggered state. J. Virol 86, 12838–12848 (2012). - PMC - PubMed

MeSH terms

LinkOut - more resources