. 2024 Jul;6(7):1294-1309.
doi: 10.1038/s42255-024-01060-5. Epub 2024 Jun 10.

ASS1 metabolically contributes to the nuclear and cytosolic p53-mediated DNA damage response

Affiliations

ASS1 metabolically contributes to the nuclear and cytosolic p53-mediated DNA damage response

Lisha Qiu Jin Lim et al. Nat Metab. 2024 Jul.

Erratum in

Abstract

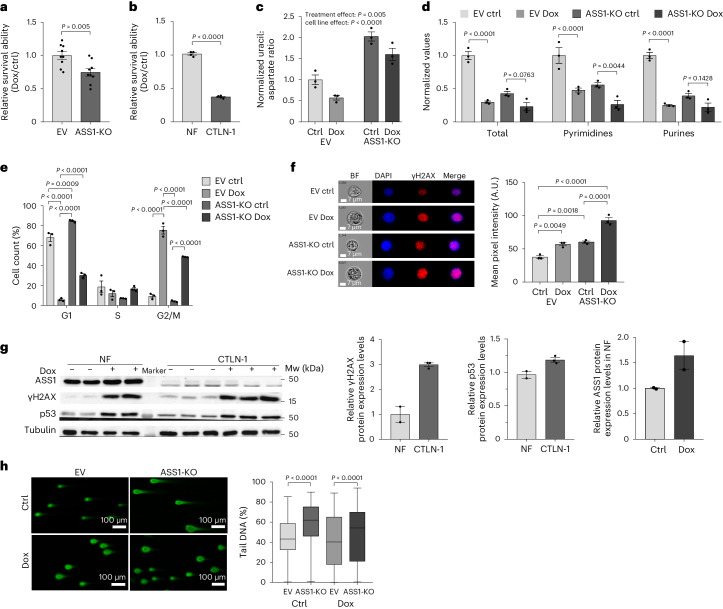
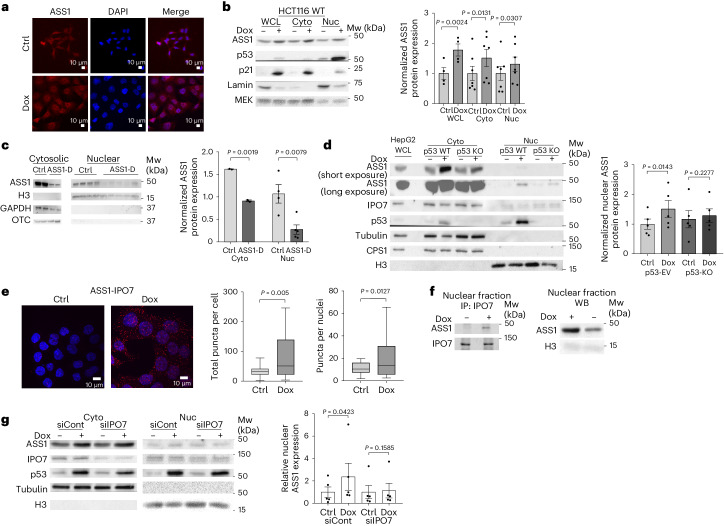
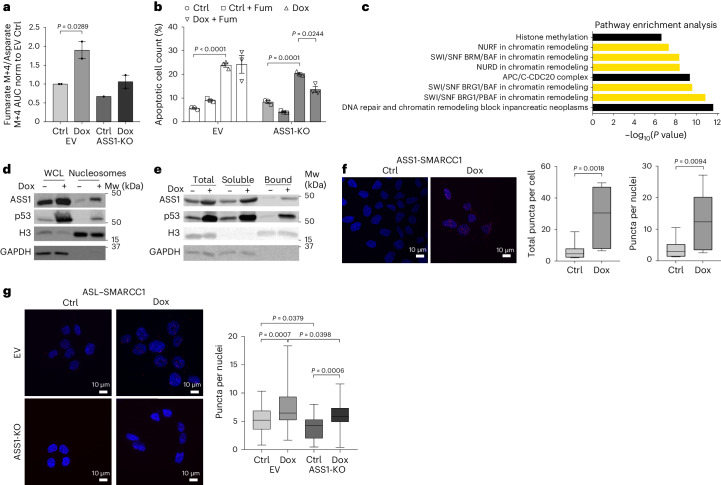
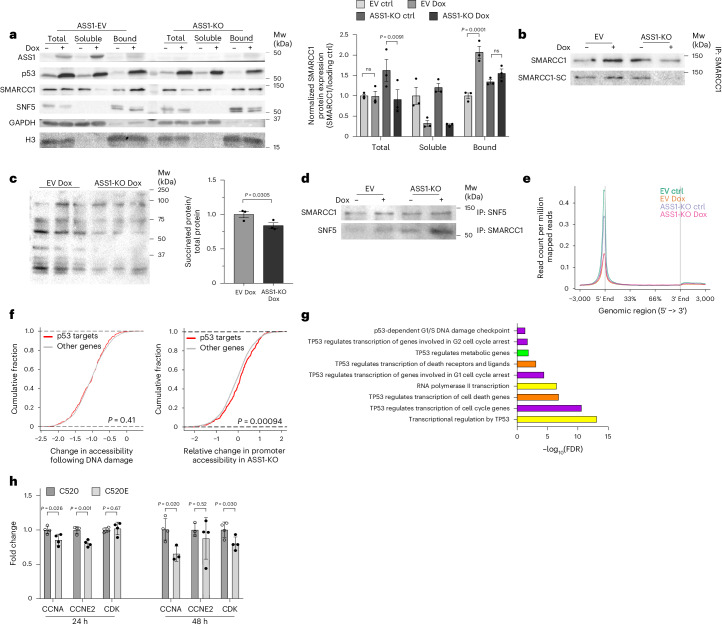
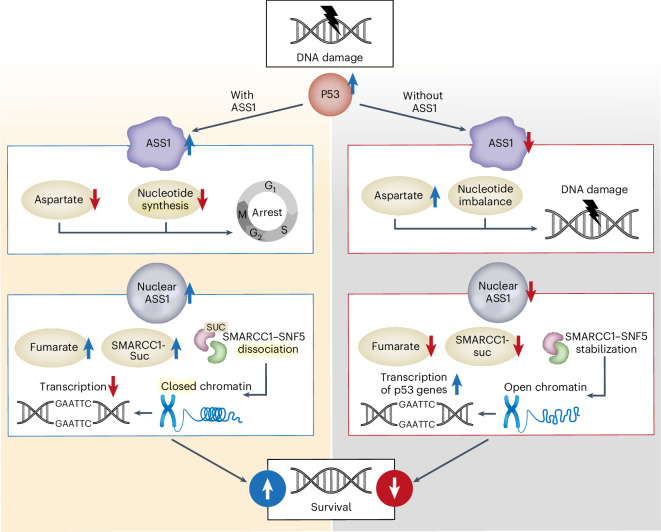
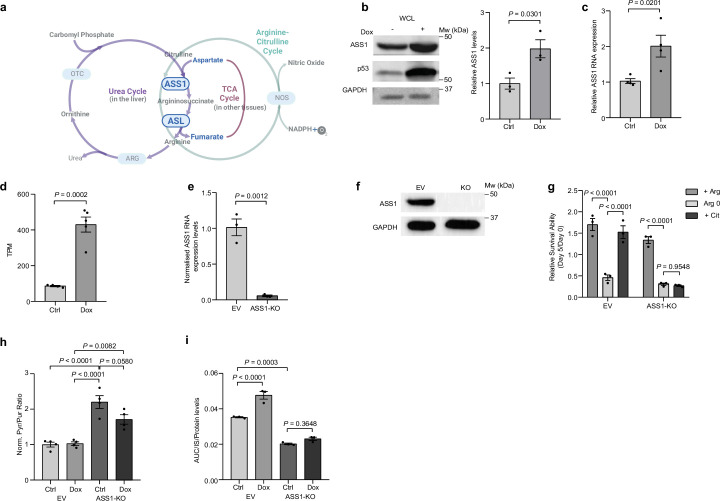
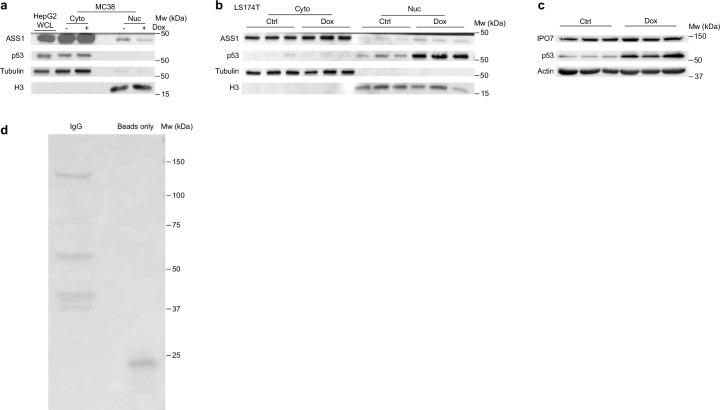
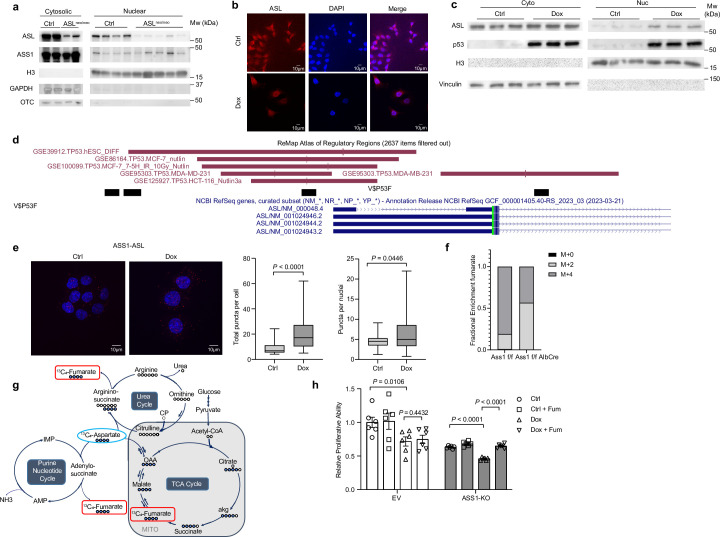
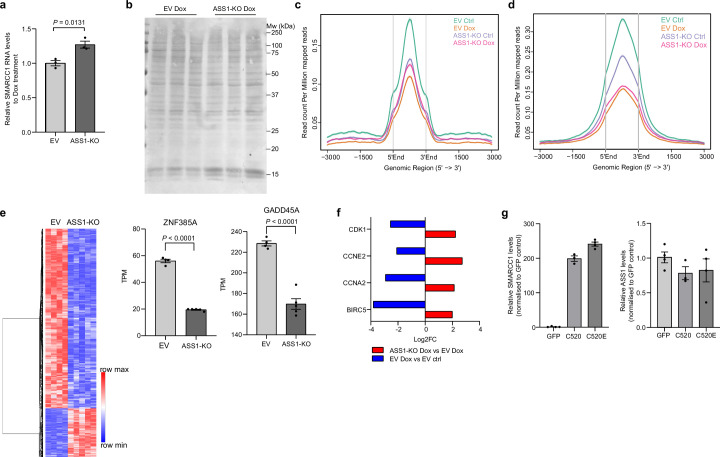
Downregulation of the urea cycle enzyme argininosuccinate synthase (ASS1) in multiple tumors is associated with a poor prognosis partly because of the metabolic diversion of cytosolic aspartate for pyrimidine synthesis, supporting proliferation and mutagenesis owing to nucleotide imbalance. Here, we find that prolonged loss of ASS1 promotes DNA damage in colon cancer cells and fibroblasts from subjects with citrullinemia type I. Following acute induction of DNA damage with doxorubicin, ASS1 expression is elevated in the cytosol and the nucleus with at least a partial dependency on p53; ASS1 metabolically restrains cell cycle progression in the cytosol by restricting nucleotide synthesis. In the nucleus, ASS1 and ASL generate fumarate for the succination of SMARCC1, destabilizing the chromatin-remodeling complex SMARCC1-SNF5 to decrease gene transcription, specifically in a subset of the p53-regulated cell cycle genes. Thus, following DNA damage, ASS1 is part of the p53 network that pauses cell cycle progression, enabling genome maintenance and survival. Loss of ASS1 contributes to DNA damage and promotes cell cycle progression, likely contributing to cancer mutagenesis and, hence, adaptability potential.


Conflict of interest statement

The authors declare no competing interests.

Figures

Fig. 1
Fig. 1. ASS1 is essential for the p53 regulation of the cell cycle and genome integrity.
a, Quantification of the relative cell survival ability of HCT116 EV and ASS1-KO cells with and without Dox treatment. n = 8 independent experiments; EV, empty vector; ctrl, control. b, Quantification of the relative cell survival ability of normal fibroblasts (NF) and ASS1-deficient patient-derived skin fibroblasts (CTLN-I) with and without Dox. n = 4 independent experiments. c, Uracil:aspartate ratio of HCT116 EV and ASS1-KO cells with and without Dox. Treatment effect was significant (F1,8 = 14.7, P = 0.005) and similar in both cell lines (non-significant interaction between cell line and treatment; F1,8 < 0.01, P = 0.984). n = 3 biologically independent samples. d, Normalized total, pyrimidine and purine nucleotide levels as measured by LC–MS for HCT116 EV and ASS1-KO cells, with and without Dox (total: EV ctrl-EV Dox, P < 0.0001; ASS1-KO ctrl-ASS1-KO Dox, P = 0.0763. Pyrimidines: EV ctrl-EV Dox, P < 0.0001; ASS1-KO ctrl-ASS1-KO Dox, P = 0.0044. Purines: EV ctrl-EV Dox, P < 0.0001; ASS1-KO ctrl-ASS1-KO Dox, P = 0.1428). n = 3 biologically independent samples. e, Cell cycle of HCT116 EV and ASS1-KO cells, with and without Dox (G1: EV ctrl-EV Dox, P < 0.0001; EV ctrl-ASS1-KO ctrl, P= 0.0009; EV Dox-ASS1-KO ctrl, P < 0.0001; EV Dox-ASS1-KO Dox, P < 0.0001. G2M: EV ctrl-EV Dox, P < 0.0001; EV Dox-ASS1-KO ctrl, P < 0.0001; EV Dox-ASS1-KO Dox, P < 0.0001; ASS1-KO ctrl-ASS1-KO Dox, P < 0.0001). n = 3 biologically independent samples. f, Representative immunofluorescence images of γH2AX levels (Alexa Fluor 647) in control and Dox-treated HCT116 EV and ASS1-KO cells. Right panel: mean pixel intensity quantification (EV ctrl-EV Dox, P = 0.0049; EV ctrl-ASS1-KO ctrl, 0.0018; EV ctrl-ASS1-KO Dox, P < 0.0001; ASS1-KO ctrl-ASS1-KO Dox, P < 0.0001). n = 3 biologically independent samples. g, NF and ASS1-deficient patient-derived skin fibroblasts (CTLN-I) treated with and without Dox were immunoblotted for γH2AX, p53 and ASS1. Tubulin: loading control; MW, molecular weight. Right panel: Quantification of γH2AX and p53 protein expression levels comparing untreated NF and untreated CTLN-I cells; and for ASS1 protein expression levels in treated and untreated NF (NF, n = 2; CTLN-I, n = 3 biologically independent samples). h, Tail DNA percentage (%), in HCT116 EV and ASS1-KO cells with and without Dox treatment visualized using the comet assay. Representative fluorescent images for each sample are shown. Right panel: tail DNA percentage quantification. n = 600 biologically independent cells across 3 biologically independent samples (ctrl EV-ASS1-KO, P < 0.0001; Dox EV-ASS1-KO, P < 0.0001). Data are represented as the mean ± s.e.m. P values were determined by two-way ANOVA with Tukey’s honest significant differences method (in c and e), two-way ANOVA with Tukey’s multiple-comparison test (in d), ordinary one-way ANOVA with Sidak’s multiple-comparison test (in f and h) or unpaired two-tailed Student’s t-test (in a, b and g). Boxplot for h is min–max with the line at the median; shaded area, 50th percentile of each dataset. Source data
Fig. 2
Fig. 2. ASS1 generates fumarate in the nucleus.
a, Control and Dox-treated HCT116 WT cells were stained for ASS1 with Alexa Fluor 594 (red). n = 3 biologically independent experiments. b, Cytosolic and nuclear fractions of control and Dox-treated HCT116 WT cells were immunoblotted. Markers: lamin, nuclear; MEK, cytoplasmic Right panel: quantification of nuclear ASS1 normalized to H3 (Nuc), cytosolic ASS1 normalized to GAPDH (Cyto) and WCL ASS1 normalized to GAPDH (WCL). n = 4 biologically independent experiments. c, Livers from control (ASSFlox/Flox) and Alb-cre ASS1 mice (ASS1-D) were fractionated and immunoblotted for ASS1. Markers: H3, nuclear; GAPDH, cytoplasmic; OTC, mitochondrial. The faint band in cytosolic ASS1-D probably results from other liver cells expressing ASS1. n = 4 biologically independent samples. Right panel: quantification of nuclear ASS1 levels relative to H3 (Nuc) and cytosolic ASS1 levels normalized to GAPDH (Cyto). d, Control and Dox-treated HCT116 p53 WT and p53-KO cells were fractionated into cytosol (Cyto) and nuclear (Nuc) fractions and immunoblotted. Markers: H3, nuclear; tubulin, cytoplasmic; CPS1, mitochondrial. n = 5 biologically independent samples. Right panel: quantification of nuclear ASS1 levels relative to H3. e, ASS1–IPO7 interactions in control and Dox-treated HCT116 ASS1-EV and ASS1-KO cells. Right panel: quantification of total and nuclear puncta. n = 300 biologically independent cells across three biologically independent samples. f, Immunoprecipitation of IPO7 was performed on the nuclear fraction of control and Dox-treated HCT116 WT cells and immunoblotted (left). The nuclear lysate was immunoblotted for ASS1 and H3 (nuclear marker) (right). n = 3 independent experiments. g, Cytosolic and nuclear fractions of control and Dox-treated HCT116 WT cells transfected with scrambled or IPO7-targeted siRNA were immunoblotted for ASS1, p53 and IPO7. Markers: H3, nuclear; tubulin, cytoplasmic. Right panel: quantification of nuclear ASS1 protein expression levels, normalized to H3, and relative to ctrl. n = 5 independent experiments. Data are represented as the mean ± s.e.m. P values were determined by paired two-tailed Student’s t-test (in b and d), unpaired two-tailed Student’s t-test (in c and e) and two-tailed ratio paired t-test (in g). Boxplot in e represents min–max, with the line at the median and the shaded area representing the 50th percentile of each dataset. Source data
Fig. 3
Fig. 3. Nuclear ASS1 contributes to fumarate generation and interacts with SMARCC1.
a, Isotopic tracing of labeled M + 4 fumarate (AUC) generated from M + 4 aspartate (AUC) in the nuclei was performed on control and Dox-treated HCT116 ASS1-EV (EV) and ASS1-KO cells. n = 2 biologically independent samples, ASS1-KO, n = 1. b, Cell survival of control and Dox-treated HCT116 ASS1-EV (EV) and ASS1-KO cells were incubated with (+Fum) or without Fumarate (1 mM) using Apotracker. n = 3 biologically independent samples (EV ctrl-Dox, P < 0.0001; ASS1-KO ctrl-Dox, P < 0.0001; ASS1-KO Dox-Dox+Fum, P = 0.0244). c, Pathway analysis of ASS1 protein interactors from the nuclear fraction of HCT116 WT cells, after immunoprecipitation–MS using ASS1 antibody of the nuclear fraction of HCT116 WT cells. Chromatin-remodeling pathways related to SWI/SNF are highlighted in yellow. n = 3 biologically independent samples. d, Nucleosomes from control and Dox-treated HCT116 WT cells isolated by MNase digestion and immunoblotted for ASS1 and p53. Markers: H3, nuclear; GADPH, cytoplasmic. n = 3 independent experiments. e, Control and Dox-treated HCT116 WT cells assayed for the total, soluble and chromatin-bound fraction and immunoblotted for ASS1 and p53. Markers: H3, nuclear; GADPH, cytoplasmic. n = 3 independent experiments. f, Interactions between ASS1 and SMARCC1 of control and Dox-treated HCT116 WT cells visualized using PLA. Right panel: quantification of total puncta and nuclear puncta. n = 100 biologically independent cells across three biologically independent samples. g, interactions between ASL and SMARCC1 of control and Dox-treated HCT116 ASS1-EV (EV) and ASS1-KO cells visualized using a PLA. Right panel: quantification of nuclear puncta. n = 200 biologically independent cells across three biologically independent samples. Data are represented as the mean ± s.e.m. ns, not significant. P values were determined by one-way ANOVA with Tukey’s multiple-comparison test (in g), two-way ANOVA on the log10 transformed values (in b) or unpaired two-tailed Student’s t-test (in a, c and f). Boxplot in f and g is min–max, with the line at the median and the shaded area representing the 50th percentile of each dataset. Source data
Fig. 4
Fig. 4. ASS1 regulates p53-related gene transcription following DNA damage via SMARCC1 succination.
a, Control and Dox-treated HCT116 ASS1-EV (EV) and ASS1-KO cells were assayed for the total, soluble and chromatin-bound fraction and immunoblotted for ASS1, SMARCC1, SNF5 and p53. Markers: H3, nuclear; GADPH, cytoplasmic. n = 3 independent experiments. Right panel: quantification of total and soluble SMARCC1 levels relative to GAPDH, and nuclear SMARCC1 levels relative to H3. b, Immunoprecipitation with anti-SMARCC1 of the chromatin-bound fraction of control and Dox-treated HCT116 ASS1-EV (EV) and ASS1-KO cells and immunoblotted for SMARCC1 and SC. n = 3 independent experiments. c, The nuclear fraction of control and Dox-treated HCT116 ASS1-EV (EV) and ASS1-KO cells immunoblotted for general succination (SC). n = 3 biologically independent samples. d, Immunoprecipitation with anti-SMARCC1 or anti-SNF5 of the chromatin-bound fraction of control and Dox-treated HCT116 ASS1-EV (EV) and ASS1-KO immunoblotted for SNF5 or SMARCC1, respectively. n = 3 independent experiments. e, Mapping of read counts of promoter accessibility using ATAC–seq of control and Dox-treated HCT116 ASS1-EV (EV) and ASS1-KO cells. n = 3 biologically independent samples. f, Promoter accessibility of p53 DDR target genes using ATAC–seq of control and Dox-treated HCT116 ASS1-EV (left) and ASS1-KO cells (right). n = 3 biologically independent samples. g, Pathway enrichment analysis of p53 target genes significantly changing between Dox-treated HCT116 ASS1-KO and EV cells. Each bar shows the fold enrichment of a specific pathway. The bars are color-coded according to the different pathway types: yellow, transcription general; purple, cell cycle; orange, death; green, metabolism. n = 5 biologically independent samples. FDR, false discovery rate. h, Real-time PCR for p53 cell cycle genes performed on SKOV3 cells transfected with GFP, SMARCC1 C520 or SMARCC1 C520E plasmids for 24 h or 48 h. n = 3 biologically independent samples for (C520, CCNE2, 24 h), (C520E, CCNA, 48 h), (C520, CCNE2, 48 h); all others, n = 4 biologically independent samples. Data are represented as the mean ± s.e.m. ns, not significant. P values were determined by two-way ANOVA with Tukey’s multiple-comparison test (in a), Wilcoxon rank-sum test (in f) or unpaired two-tailed Student’s t-test (in c and h). Source data
Fig. 5
Fig. 5. Suggested model for the requirement of ASS1 in the p53-response to DNA damage.
In cells expressing ASS1, upon DNA damage, p53 levels are elevated, upregulating the expression of ASS1. ASS1 acts as a metabolic cell cycle checkpoint in the cytosol by regulating nucleotide levels. In the nucleus, ASS1 regulates fumarate levels needed for the succination of SMARCC1. Upon succination, there is a dissociation of SMARCC1 from SNF5, decreasing chromatin accessibility and p53-related transcription. In the absence of ASS1, there is an increase in cytosolic aspartate levels, leading to unregulated nucleotide synthesis and promoting DNA damage. In the nucleus, loss of ASS1 expression leads to increased SMARCC1–SNF complex, higher chromatin accessibility and transcription of p53 genes. Upwards and downward arrowheads indicate an increase or decrease, respectively. The scheme was created by Weizmann Graphics team.
Extended Data Fig. 1
Extended Data Fig. 1. Expression of ASS1 protein and mRNA is elevated upon Dox treatment.
a, Role of ASS1 in the urea, TCA and arginine-citrulline cycles. The scheme was created with BioRender. b, Protein samples from control and dox-treated HCT116 WT cells were extracted and immunoblotted for ASS1 and p53. Loading control - GAPDH. (n = 3 independent experimetns) Right panel: Quantitative analysis of ASS1 protein expression levels, normalised to GAPDH. c, ASS1 RNA expression levels of Ctrl or Dox-treated NF were quantified using RT-PCR. (n = 4 independent experiments) d, RNA seq analysis of ASS1 levels in control and dox-treated HCT116 cells (upper panel), and normal fibroblasts (lower panel) (n = 5 biologically independent samples) e, HCT116 ASS1-KO cells were generated using CRISPR-Cas9 and validated for ASS1 RNA expression using qRTPCR. (n = 3 independent experiments) f, HCT116 ASS1-KO cells were generated using CRISPR-Cas9 and validated for ASS1 protein expression using immunoblotting. (n = 3 independent experiments). g, HCT116 ASS1-KO cells were generated using CRISPR-Cas9 and validated for ASS1 enzymatic activity using a proliferative assay, in which citrulline supplementation (200 mg/ml), in the absence of arginine, does not rescue survival of cells deficient in ASS1. (n = 3 independent experiments) (P-values: EV Arg0-+Arg:<0.0001; EV Arg0-+Cit:<0.0001; ASS1-KO Arg0-+Arg:<0.0001; ASS1-KO Arg0-+Cit: 0.9548) h, Nucleotide levels of Ctrl or Dox-treated HCT116 ASS1-EV (EV) and ASS1-KO cells were measured and quantified as a normalised Pyr/Pur ratio. (n = 4 independent experiments) (P-values: EV Ctrl-ASS1-KO Ctrl:<0.0001; EV Dox-ASS1-KO Ctrl:<0.0001); EV Dox-ASS1-KO Dox:0.0082; ASS1-KO Ctrl-ASS1-KO Dox:<0.0001) i, Fumarate levels of Ctrl or Dox-treated HCT116 ASS1-EV (EV) and ASS1-KO cells were measured and quantified by GC/MS. (n = 3 biologically independent samples). (P-value: EV Ctrl-EV Dox:<0.0001; EV Ctrl-ASS1-KO Ctrl:0.0003; ASS1-KO Ctrl-ASS1-KO Dox:0.3648). Data are represented as the mean ± s.e.m. ns, not significant. P values were determined by two-way ANOVA with Tukey’s multiple-comparison test (g), one-way ANOVA with Tukey’s multiple-comparison test (h and i) or unpaired two-tailed Student’s t-test (b, c, d and e).
Extended Data Fig. 2
Extended Data Fig. 2. Nuclear expression of ASS1 is dependent on WT.
a, MC38 cells, colon cancer cells with mutated p53, were incubated with (+) or without Dox (-) for 2 hrs, and after 48 hrs, fractionated into nuclear (Nuc) and cytoplasmic (Cyto) fractions and immunoblotted for ASS1 and p53. Tubulin and H3 were used as a cytoplasmic or nuclear marker, respectively. (n = 3 biologically independent samples). HepG2 WCL was used as a positive control for CPS1 b, LS-174-T cells, colon cancer cells with wild-type p53, were incubated with (Dox) or without Dox (Ctrl) for 2 hrs, and after 48 hrs, fractionated into nuclear (Nuc) and cytoplasmic (Cyto) fractions and immunoblotted for ASS1 and p53. Tubulin and H3 were used as a cytoplasmic or nuclear marker, respectively. (n = 3 biologically independent samples). c, HCT116 WT cells were incubated with (Dox) or without Dox (Ctrl) for 2 hrs, and after 48 hrs, protein was extracted and immunoblotted for ASS1, IPO7 and p53. β-actin was used as a loading control. (n = 3 biologically independent samples) d, HCT116 WT cells were incubated with (+) or without Dox (-) for 2 hrs, and fractionated after 48 hrs. IgG and beads only controls were also immunoblotted for IPO7. (n = 3 independent experiments).
Extended Data Fig. 3
Extended Data Fig. 3. ASL participates in the nuclear generation of fumarate.
a, Livers from control and ASL-KO (ASLneo/neo) were fractionated and immunoblotted for ASS1. H3 and GAPDH are used as a nuclear and cytoplasmic marker, respectively. (n = 4 biologically independent samples) b, Control and dox-treated HCT116 WT cells were stained for ASL using Alexa Fluor 594 (red). Nuclei were counter-stained with DAPI (blue). Scale bar, 10 μm. (n = 3 independent experiments) c, Control and dox-treated HCT116 WT cells were fractionated and immunoblotted for ASL and p53. Markers: Vinculin - cytoplasmic; H3 nuclear (n = 3 biologically independent samples) d, 1,100 bp surrounding the ASL transcription start site (GRCh38 chr7:66,075,357-66,076,456) taken from the UCSC genome browser (http://genome.ucsc.edu) The tracks shown: ReMap Altas of Regulatory regions filtered for TP53, TP63, TP73 binding sites (only TP53 are found); MatInspector (Genomatix Genome Analyzer)predicted P53 binding sites; and RefSeq mRNAs. A binding site in HCT116 can be found in the proximal promoter, which overlaps a predicted binding site as well as binding peaks found in other cell lines. e, Left panel: Interactions between ASS1 and ASL were visualised in control and dox-treated HCT116 ASS1-EV (EV) and ASS1-KO cells using a proximity ligation assay. Scale bar, 10 μm. (P-values: Total: <0.0001, Nuclear: 0.0446) Right panel: Quantification of total puncta and nuclear puncta. (n = 100 biologically independent cells). f, Fractional labelling of fumarate M + 4/all masses generated from 13C4-aspartate in purified nuclei isolated from mice’s livers with and without ASS1. (Ass1Flox/Flox ; Ass1Flox/Flox AlbCre: n = 1 in each group. biologically independent mouse) g, Schematic depiction of the potential sources of fumarate M + 4 from labelled 13C-aspartate M + 4. h, Control and dox-treated HCT116 ASS1-EV (EV) and ASS1-KO cells were incubated with (+ Fum) or without Fumarate (1 mM), and survival was measured and quantified using XTT. (n = 6 biologically independent experiments) (P-value: EV Ctrl-EV Dox:0.0195; EV Dox-EV Dox+Fum:0.4432; ASS1-KO Ctrl-ASS1-Dox:<0.0001; ASS1-KO Dox-ASS1-KO Dox+Fum:<0.0001) Data are represented as the mean ± s.e.m. ns, not significant. P values were determined by RM one-way ANOVA (h), unpaired two-tailed Student’s t-test (e), or Tukey’s multiple-comparison test (f). Box plot for e is min-max with the line at the median and the shaded area represents 50 percentile of each dataset.
Extended Data Fig. 4
Extended Data Fig. 4. ASS1 regulates p53-related gene transcription following DNA damage via SMARCC1 succination.
a, HCT116 ASS1-EV (EV) and ASS1-KO cells were incubated with (Dox) or without Dox (Ctrl) for 2 hrs, and incubated for 48 hrs. RNA was extracted and SMARCC1 RNA levels were detected using quantitative real-time PCR. (n = 3 biologically independent samples) b, HCT116 ASS1-EV (EV) and ASS1-KO cells were incubated with Dox for 2 hrs, and after 48 hrs, fractionated and the nuclear fraction was immunoblotted for succination (SC). Prior to succinaton staining, the membrane was stained with Ponceau for total protein. (n = 3 biologically independent samples) c, Mapping of read counts of promoter accessibility using ATAC-Seq around peaks of SMARCC1 binding to chromatin in HeLa cells from the ENCODE project (ENCODE experiment ENCFF971JGA). d, Mapping of read counts of promoter accessibility using ATAC-Seq around peaks of H3K27ac enhancer-associated histone marks, when considering only intergenic peaks, as annotated by HOMER, data from the ENCODE project (ENCODE experiment ENCSR661KMA). e, Left panel: Heat-map analysis of transcriptomic data comparing changes in gene expression between EV Ctrl and ASS1-KO Ctrl cells. (n = 5 biologically independent samples) Right panels: RNA expression levels of selected cell cycle and survival genes regulated by p53. (P-value: ZNF385A: <0.0001; GADD45A: <0.0001) (n = 5 biologically independent samples) f, RNA expression levels of p53-related genes are down-regulated in EV treated with Dox vs. untreated, while their expression is increased in ASS1 KO cells treated with Dox compared to treated EV. (n = 5 biologically independent samples) g, SKOV3 cells were transfected with GFP, SMARCC1 C520 or SMARCC1 C520E plasmids for 48 hrs, and subsequently real-time PCR for SMARCC1 and ASS1 was performed to verify transfection. (n = 4 biologically independent samples) Data are represented as the mean ± s.e.m. ns, not significant. P values were determined by unpaired two-tailed Student’s t-test (a, e, and g).

Similar articles

Cited by

References

    1. Erez, A. et al. Requirement of argininosuccinate lyase for systemic nitric oxide production. Nat. Med.17, 1619–1626 (2011). 10.1038/nm.2544 - DOI - PMC - PubMed
    1. Ah Mew, N et al. Urea cycle disorders overview in GeneReviews (eds. Adam M. P. et al.) (University of Washington, 2017).
    1. Delage, B. et al. Arginine deprivation and argininosuccinate synthetase expression in the treatment of cancer. Int. J. Cancer126, 2762–2772 (2010). 10.1002/ijc.25202 - DOI - PubMed
    1. Rabinovich, S. et al. Diversion of aspartate in ASS1-deficient tumours fosters de novo pyrimidine synthesis. Nature527, 379–383 (2015). 10.1038/nature15529 - DOI - PMC - PubMed
    1. Keshet, R. et al. Targeting purine synthesis in ASS1-expressing tumors enhances the response to immune checkpoint inhibitors. Nat. Cancer1, 894–908 (2020). 10.1038/s43018-020-0106-7 - DOI - PubMed

MeSH terms

Substances

LinkOut - more resources