. 2024 Jul;43(14):2862-2877.
doi: 10.1038/s44318-024-00146-w. Epub 2024 Jun 10.

K128 ubiquitination constrains RAS activity by expanding its binding interface with GAP proteins

Affiliations

K128 ubiquitination constrains RAS activity by expanding its binding interface with GAP proteins

Wout Magits et al. EMBO J. 2024 Jul.

Abstract

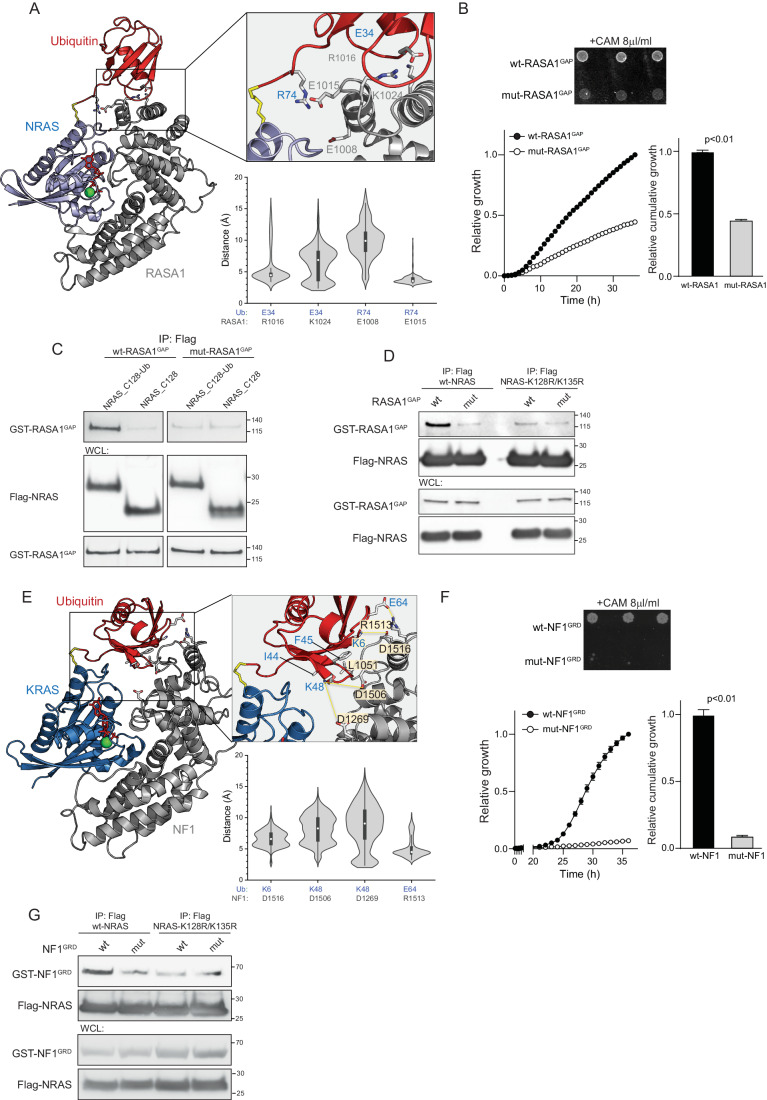
The RAS pathway is among the most frequently activated signaling nodes in cancer. However, the mechanisms that alter RAS activity in human pathologies are not entirely understood. The most prevalent post-translational modification within the GTPase core domain of NRAS and KRAS is ubiquitination at lysine 128 (K128), which is significantly decreased in cancer samples compared to normal tissue. Here, we found that K128 ubiquitination creates an additional binding interface for RAS GTPase-activating proteins (GAPs), NF1 and RASA1, thus increasing RAS binding to GAP proteins and promoting GAP-mediated GTP hydrolysis. Stimulation of cultured cancer cells with growth factors or cytokines transiently induces K128 ubiquitination and restricts the extent of wild-type RAS activation in a GAP-dependent manner. In KRAS mutant cells, K128 ubiquitination limits tumor growth by restricting RAL/ TBK1 signaling and negatively regulating the autocrine circuit induced by mutant KRAS. Reduction of K128 ubiquitination activates both wild-type and mutant RAS signaling and elicits a senescence-associated secretory phenotype, promoting RAS-driven pancreatic tumorigenesis.

Keywords: NF1; RAS Interactome; RAS Signaling; Senescence-Associated Secretory Phenotype; Ubiquitination.


Conflict of interest statement

The authors declare no competing interests.

Figures

Figure 1
Figure 1. K128 is the major site of RAS ubiquitination.
(A) Tandem affinity purification of ubiquitinated NRAS and KRAS. 6xHis–ubiquitin and Flag-NRAS or KRAS were co-transfected into HEK293T cells, and ubiquitinated RAS proteins were purified using anti-Flag resin followed by Co2+ metal affinity chromatography. Isolated RAS protein was visualized by immunoblotting with an anti-RAS antibody. Percentage of diGly-modified peptides to the total of identified peptides. N = 3. (B) Location of the identified ubiquitination sites on the 3D structures of RAS proteins. (C) Stability of the indicated proteins using the global-protein stability (GPS) approach. RAS turnover was monitored in HEK293T cells by FACS analysis. Data were shown as mean ± s.e.m, N = 4–5 technical replicates in independent experiments. P-value was determined by a two-sided t-test. (D) Immunofluorescence analysis of the indicated HA-tagged RAS proteins overexpressed in HeLa cells. Scale bar, 10 µm. Source data are available online for this figure.
Figure 2
Figure 2. Ubiquitination at K128 facilitates the interaction of RAS with the GAP proteins.
(A) Superimposition of five representative complex conformations from the ensemble clusters for the K128-ubiquitinated NRAS/ RASA1GAP complex. (B) The interaction energies of RASA1GAP with non-ubiquitinated NRAS and NRAS ubiquitinated at K128. The interaction energies were calculated over the entire trajectories and then averaged. Data represented as mean ± SD. N = 1250 snapshots. (C) Chemical ubiquitination of NRAS-C118S/ K128C mutant and purification of monoubiquitinated NRAS by size-exclusion chromatography. Proteins were separated by SDS-PAGE under non–reducing conditions or in the presence of a reducing agent, tris(2-carboxyethyl) phosphine (TCEP), and stained by Coomassie blue. (D) In vitro Co-IP of non-conjugated or ubiquitin-conjugated NRAS-K128C and RAF1. Equimolar amounts of NRAS-K128C/ Ubiquitin-G76C complex or NRAS-K128C mutant were incubated with V5-tagged RAF1 in the presence of GDP or GTPγS. (E) In vitro Co-IP of non-conjugated or ubiquitin-conjugated NRAS-K128C and SOS1. Equimolar amounts of NRAS-K128C-Ubiquitin-G76C complex or NRAS-K128C mutant were incubated with equal amounts of the GDP/GTP exchange domain of SOS1 in the presence of GDP. (F) In vitro Co-IP of non-conjugated or ubiquitin-conjugated NRAS-K128C and RASA1. Equimolar amounts of the indicated NRAS proteins were incubated with equal amounts of RASA1GAP in the presence of GTPγS. (G) RASA1-mediated GTPase activity of ubiquitinated and non-ubiquitinated NRAS normalized to intrinsic GTPase activity. Equimolar amounts of the indicated NRAS proteins were mixed with the GAP domain of RASA1. GTP hydrolysis reaction was initiated by the addition of GTP. Data were present as mean ± s.e.m. N = 3 technical replicates in independent experiments. P-value was calculated by a two-sided t-test. (H) wt-RAS and ubiquitination-deficient RAS mutant were co-immunoprecipitated with GST-tagged RASA1GAP using anti-Flag resin followed by immunoblotting with the indicated antibodies. (I) Superimposition of five representative complex conformations from the ensemble clusters for the K128-ubiquitinated KRAS/ NF1GRD complex. (J) The interaction energies of NF1GRD with non-ubiquitinated KRAS and KRAS ubiquitinated at K128. Data represented as mean ± SD. N = 1250 snapshots. (K) The indicated RAS proteins were co-immunoprecipitated with GST-tagged NF1GRD using anti-Flag resin, followed by immunoblotting with the indicated antibodies. Source data are available online for this figure.
Figure 3
Figure 3. The GAP proteins interact with ubiquitin.
(A) The best representative complex conformation (cluster 1) from the ensemble clusters for the K128-ubiquitinated NRAS/ RASA1GAP complex, highlighting the salt bridges. The distance of four salt bridges was measured. Data were represented by a density plot with the median as the center, the interquartile range indicated with a rectangular box and the minimum/maximum value as endpoints. The density reflects the frequency distribution. N = 625–1000 snapshots. (B) The interaction between RASA1GAP and Ubiquitin using Split-CAT-based binding assay. Ubiquitin fused to C-CAT fragment and wt-RASA1GAP or the RASA1GAP-E1015A/ R1016A fused to N-CAT were co-expressed in E. coli. The assembly of the N- and C-CAT fragments was monitored by E. coli growth in the presence of chloramphenicol. Data were present as mean ± s.e.m. N = 5 technical replicates in independent experiments. P-value was calculated by two-way ANOVA. (C) In vitro Co-IP of non-conjugated or ubiquitin-conjugated NRAS-K128C with either wt-RASA1GAP or RASA1GAP-E1015A/ R1016A mutant. (D) The indicated NRAS proteins were co-immunoprecipitated with GST-tagged wt-RASA1GAP or RASA1GAP-E1015A/ R1016A mutant using anti-Flag resin followed by immunoblotting with the indicated antibodies. (E) The best representative complex conformation (cluster 1) from the ensemble clusters for the K128-ubiquitinated KRAS/ NF1GRD complex, highlighting the salt bridges. The ubiquitin generated an extensive interface with NF1GRD. The distance of four salt bridges was measured. Data were represented by a density plot with the median as a center, the interquartile range indicated with a rectangular box and the minimum/maximum value as endpoints. The density reflects the frequency distribution. N = 1606 snapshots. (F) The interaction between NF1GRD and Ubiquitin using Split-CAT-based binding assay. Ubiquitin fused to C-CAT fragment and wt-NF1GRD or NF1GRD-L1501A/ D1506A/ R1513A mutant fused to N-CAT were constitutively co-expressed in E. coli. The assembly of the N- and C-CAT fragments was monitored by the E. coli growth in the presence of chloramphenicol. Data were present as mean ± s.e.m. N = 5 technical replicates in independent experiments. P-value was calculated by two-way ANOVA. (G) The indicated NRAS proteins were co-immunoprecipitated with GST-tagged wt-NF1GRD or NF1GRD- L1501A/D1506A/R1513A mutant using anti-Flag resin followed by immunoblotting with the indicated antibodies. Source data are available online for this figure.
Figure 4
Figure 4. Ubiquitination at K128 restricts the extent of wild-type RAS activation.
(A) K128 ubiquitination of NRAS or KRAS detected by the MS-based ubiquitinome analysis upon 10% serum stimulation of serum-starved MEFs for the indicated time periods. N = 3 biological replicates. (B) Immunoblot analysis of NRAS ubiquitination. HeLa cells were co-transfected with Flag-tagged NRAS and ubiquitin. Twenty-four hours after transfection, cells were serum-starved overnight and then stimulated for the indicated time. (C) Schematic illustration of the CRISPR-Cas9-based approach to generate conditional K128R knock-in HeLa clones. (D) Expression of wt-RAS in the single-cell clones harboring the RAS knock-in cassette after overexpression of Cre recombinase. Data were shown as mean ± s.e.m. P-value is determined by a two-sided t-test. N = 3 technical replicates in independent experiments. (E, F) The indicated HeLa cells were serum-starved overnight, stimulated with 10% serum, and analyzed by immunoblotting. (G) K128 ubiquitination of RAS proteins detected by CPTAC ubiquitinome analysis in tumor (n = 85) and normal (n = 58) tissue of LUSC patients. Data were represented as box plots with the median as the center, the interquartile range (IQR) indicated with a rectangular box, and the whiskers are defined by the first and third quartile ± 1.5x IQR. Data were shown as mean ± s.e.m. P-value is determined by a two-sided t-test. (H) GSEA analysis of the TCGA LUSC tumors stratified by NF1/ RASA1 status. Statistical analysis was performed by permutation test. (I) GSEA analysis of the CPTAC LUSC tumors stratified by the levels of KRAS ubiquitination at K128. Statistical analysis was performed by permutation test. Source data are available online for this figure.
Figure 5
Figure 5. Dysregulated ubiquitination of KRAS-G12D at K128 promotes activation of the RAL-TBK1 branch.
(A) Schematic illustration of the CRISPR-Cas9-based approach to generate conditional K128R knock-in SW1990 clones. (B) 2D colony formation assay of three independent SW1990 single-cell clones expressing either KRAS-G12D or KRAS-G12D/K128R. Data were present as mean ± s.e.m. N = 3 biological replicates. P-value was calculated by a two-sided t-test. (C) Tumor growth of SW1990 xenografts expressing either KRAS-G12D or KRAS-G12D/ K128R. Xenograft volumes were evaluated for 20 days every two days. Data were presented as mean ± s.e.m.; the P-value was determined by two-way ANOVA. N = 5–6 biological replicates. (D) Tumor weight of SW1990 xenografts expressing either KRAS-G12D or KRAS-G12D/ K128R mutants at the endpoint. Data were presented as mean ± s.e.m.; the P-value was determined by a two-sided t-test. N = 5–6 biological replicates. (E) Immunoblot analysis of phosphorylated and total TBK1 expression in SW1990 single-cell clones expressing either KRAS-G12D or KRAS-G12D/K128R. (F) Immunohistochemistry analysis of phosphorylated TBK1 (p-TBK1) in SW1990 xenografts expressing either KRAS-G12D or KRAS-G12D/ K128R. Scale bar, 100 µm. (G) RALB activity in SW1990 cells expressing either KRAS-G12D or KRAS-G12D/K128R. The RALB activity was determined by its ability to interact with SEC5. (H) Immunoblot analysis of phosphorylated and total TBK1 expression in the indicated SW1990 cells expressing shGFP or shNF1. (I) The SASP-related gene expression in three SW1990 single-cell clones expressing either KRAS-G12D or KRAS-G12D/K128R. (J) GSEA analysis of the gene expression profiles in SW1990 single-cell clones expressing KRAS-G12D or KRAS-G12D/K128R. N = 3 biological replicates. Statistical analysis was performed by permutation test. (K) GSEA analysis of the TCGA PDAC tumors stratified by NF1 status. Statistical analysis was performed by permutation test. (L) Colony formation assay of SW1990 cells expressing either KRAS-G12D or KRAS-G12D/K128R treated with DMSO or Amlexanox. Data were present as mean ± s.e.m. N = 3 technical replicates in independent experiments. P-value was calculated by a two-sided t-test. Source data are available online for this figure.

Similar articles

Cited by

References

    1. Baietti MF, Simicek M, Abbasi Asbagh L, Radaelli E, Lievens S, Crowther J, Steklov M, Aushev VN, Martinez Garcia D, Tavernier J, et al. OTUB1 triggers lung cancer development by inhibiting RAS monoubiquitination. EMBO Mol Med. 2016;8:288–303. doi: 10.15252/emmm.201505972. - DOI - PMC - PubMed
    1. Baker R, Lewis SM, Sasaki AT, Wilkerson EM, Locasale JW, Cantley LC, Kuhlman B, Dohlman HG, Campbell SL. Site-specific monoubiquitination activates Ras by impeding GTPase-activating protein function. Nat Struct Mol Biol. 2013;20:46–52. doi: 10.1038/nsmb.2430. - DOI - PMC - PubMed
    1. Baker R, Wilkerson EM, Sumita K, Isom DG, Sasaki AT, Dohlman HG, Campbell SL. Differences in the regulation of K-Ras and H-Ras isoforms by monoubiquitination. J Biol Chem. 2013;288:36856–36862. doi: 10.1074/jbc.C113.525691. - DOI - PMC - PubMed
    1. Birch J, Gil J. Senescence and the SASP: many therapeutic avenues. Genes Dev. 2020;34:1565–1576. doi: 10.1101/gad.343129.120. - DOI - PMC - PubMed
    1. Campbell SL, Philips MR. Post-translational modification of RAS proteins. Curr Opin Struct Biol. 2021;71:180–192. doi: 10.1016/j.sbi.2021.06.015. - DOI - PMC - PubMed

MeSH terms