. 2024 Jun;4(6):839-853.
doi: 10.1038/s43587-024-00633-z. Epub 2024 Jun 10.

Estrogen counteracts age-related decline in beige adipogenesis through the NAMPT-regulated ER stress response

Affiliations

Estrogen counteracts age-related decline in beige adipogenesis through the NAMPT-regulated ER stress response

Jooman Park et al. Nat Aging. 2024 Jun.

Abstract

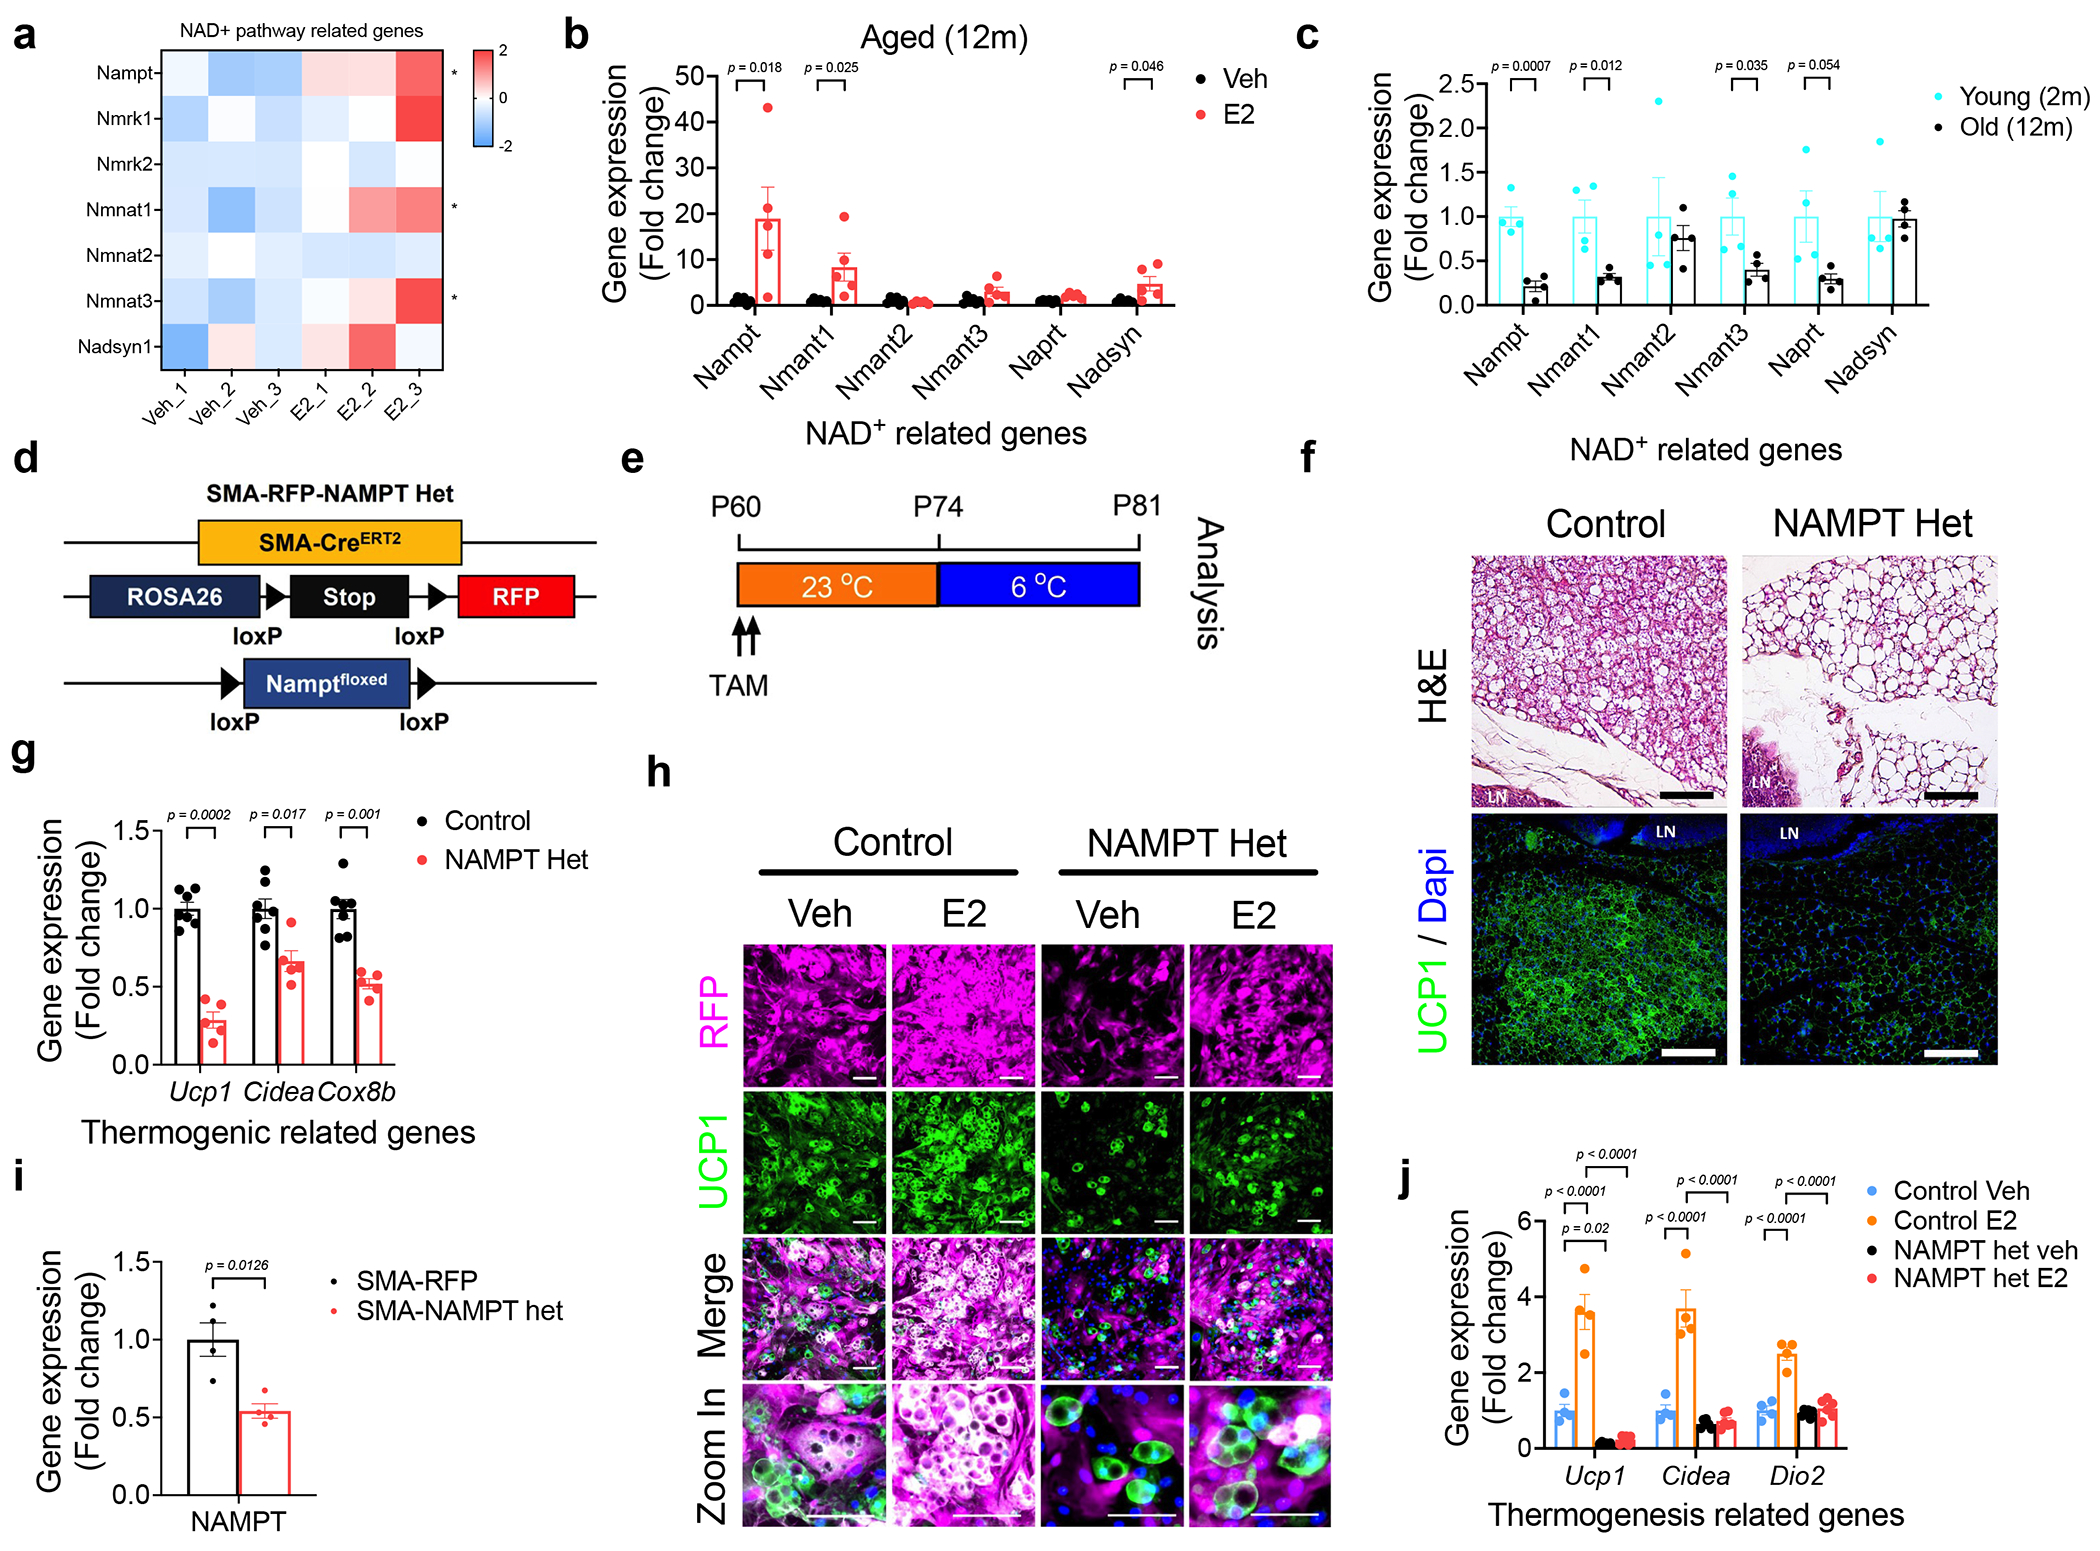
Thermogenic beige adipocytes are recognized as potential therapeutic targets for combating metabolic diseases. However, the metabolic advantages that they offer are compromised with aging. Here we show that treating mice with estrogen (E2), a hormone that decreases with age, can counteract the age-related decline in beige adipogenesis when exposed to cold temperature while concurrently enhancing energy expenditure and improving glucose tolerance in mice. Mechanistically, we found that nicotinamide phosphoribosyl transferase (NAMPT) plays a pivotal role in facilitating the formation of E2-induced beige adipocytes, which subsequently suppresses the onset of age-related endoplasmic reticulum (ER) stress. Furthermore, we found that targeting NAMPT signaling, either genetically or pharmacologically, can restore the formation of beige adipocytes by increasing the number of perivascular adipocyte progenitor cells. Conversely, the absence of NAMPT signaling prevents this process. Together, our findings shed light on the mechanisms regulating the age-dependent impairment of beige adipocyte formation and underscore the E2-NAMPT-controlled ER stress pathway as a key regulator of this process.


Conflict of interest statement

Competing interests

The authors declare no conflict of interest.

Figures

Extended Data Fig. 1
Extended Data Fig. 1. Age-related decline and restoration of serum E2 levels in male mice.
Serum E2 levels were compared between 2-month-old (Young) and 12-month-old (Old) males and assessed 4 and 24 hours after intraperitoneal injections of E2 (10 μg/Kg) to 12-month-old males by one way-ANOVA followed by Tukey’s post-hoc test. Animal number: Young (n=5), Old (n=4), Old E2 4h (n=5), Cold E2 (n=4). Data information: All results are presented as means ± SEM.
Extended Data Fig. 2
Extended Data Fig. 2. Estrogen treatment ameliorates some metabolic dysfunctions associated with aging.
a, Body lean mass composition. Animal number: RT Veh (n=4), RT E2 (n=4), Cold Veh (n=9), Cold E2 (n=10). b-c, Weight of adipose tissues (b), ANOVA summary (IGW; Interaction P = 0.039, Temperature P = 0.103, Treatment P < 0.0001, PGW; Interaction P = 0.862, Temperature P = 0.056, Treatment P = 0.0002, by two way-ANOVA followed by Tukey’s post-hoc test), and other tissues (c). Animal number: RT Veh (n=4), RT E2 (n=4), Cold Veh (n=9), Cold E2 (n=10). d-e, Serum and hepatic triglyceride by two-tailed unpaired Student’s t-test (D), and serum and hepatic cholesterol (e). Animal number: Cold Veh (n=9), Cold E2 (n=10). f-j, Oxygen consumption and quantification (f), ANOVA summary (Time, Treatment and Temperature; Interaction P = 0.07, Time P < 0.0001, Treatment and Temperature P = 0.006, Light; Interaction P = 0.56, Temperature P = 0.79, Treatment P < 0.0001, Dark; Interaction P = 0.35, Temperature P = 0.011, Treatment P < 0.0001, by two way-ANOVA followed by Tukey’s post-hoc test). Carbone dioxygen consumption and quantification (g), ANOVA summary (Time, Treatment and Temperature; Interaction P = 0.28, Time P = 0.006, Treatment and Temperature P < 0.0001, Light; Interaction P < 0.0001, Treatment P = 0.039, Temperature P <0.0001, Dark; Interaction P < 0.0001, Treatment P = 0.0019, Temperature P < 0.0001, by two way-ANOVA followed by Tukey’s post-hoc test). RER (H), ANOVA summary (Interaction P <0.0001, Temperature P < 0.0001, Treatment P <0.0001), food intake (I), ANOVA summary (Interaction P = 0.51, Temperature P < 0.0001, Treatment P = 0.41, by two way-ANOVA followed by Tukey’s post-hoc test), and physical activity (j), Animal number: RT Veh (n=5), RT E2 (n=4), Cold Veh (n=6), Cold E2 (n=7). Data information: All results are presented as means ± SEM.
Extended Data Fig. 3
Extended Data Fig. 3. Estrogen treatment has minimal impact on BAT thermogenesis upon cold exposure.
a, Representative H&E staining of BAT from vehicle (Veh) or E2-treated (10 μg/Kg) groups upon cold exposure. Scale bar, 100 μM. b, qPCR analysis of mRNA expression of thermogenic genes in BAT from vehicle or E2-treated groups by two-tailed unpaired Student’s t-test (n=7 per group). Data information: All results are presented as means ± SEM.
Extended Data Fig. 4
Extended Data Fig. 4. Estrogen does not significantly impact cold-induced beige adipocyte formation in aged female mice.
a-b, Body weight and the difference in body fat composition by two-tailed unpaired Student’s t-test. Animal number: Veh (n=8), E2 (n=10). c, Representative images of H&E staining and UCP1 immunofluorescence staining in the middle part of iWAT. Scale bar, 100 μm. Data information: All results are presented as means ± SEM.
Extended Data Fig. 5
Extended Data Fig. 5. ERα but not ERβ antagonist abolishes estrogen-promoted beige adipogenesis in old SVF cells.
a, qPCR analysis of estrogen receptor-related gene expression between young and old SVF cells (n=3 per group) by two-tailed unpaired Student’s t-test. b, Schematic illustration. SVF cells isolated from iWAT of 12-month-old male mice were pre-treated with either vehicle or E2 (10 nM) or a combination with ERα antagonist MPP (10μM) and E2, or a combination with ERβ antagonist PHTPP (10μM) and E2 before differentiating into beige adipocytes. c, Representative images of UCP1 immunofluorescence staining. Scale bar, 100 μM. d, Quantification of UCP1 by one way-ANOVA followed (n=5 per group) by Tukey’s post-hoc test. e, qPCR analysis of the thermogenic gene expression (n=3 per group) by one way-ANOVA followed by Tukey’s post-hoc test. Data information: All results are presented as means ± SEM.
Extended Data Fig. 6
Extended Data Fig. 6. ER stress inducer tunicamycin reduces energy expenditure in young mice.
a, Downregulated gene ontology (GO) cellular component to E2 by two-tailed unpaired Student’s t-test. b, Downregulated GO reactome pathway to E2 by two-tailed unpaired Student’s t-test. c, The lean mass composition in vehicle and tunicamycin treated group (n=5 per group). d-h, Oxygen consumption and quantification (d), ANOVA summary (Interaction P = 0.798, Treatment P < 0.0001, Time P = 0.657, by two way-ANOVA followed by Tukey’s post-hoc test), Carbone dioxygen consumption and quantification (e), ANOVA summary (Interaction P = 0.788, Treatment P < 0.0001, Time P = 0.174, by two way-ANOVA followed by Tukey’s post-hoc test), RER (f), food intake (g), and physical activity (h) (n=7 per group). i, Quantification of basal respiration, ATP-turnover, and maximum respiratory capacity of the samples in panel (n=7 per group). ANOVA summary (Basal; Interaction P = 0.178, PBS verse Tunicamycin P < 0.0001, Vehicle verse Estrogen P = 0.432, ATP-Linked; Interaction P = 0.505, PBS verse Tunicamycin P < 0.0001, Vehicle verse Estrogen P = 0.763, Maximum; Interaction P = 0.119, PBS verse Tunicamycin P < 0.0001, Vehicle verse Estrogen P = 0.047, by two way-ANOVA followed by Tukey’s post-hoc test). Data information: All results are presented as means ± SEM.
Extended Data Fig. 7
Extended Data Fig. 7. NAD+ pathway analysis in E2-treated aged iWAT.
a-c, Upregulated gene ontology (GO) cellular component to E2 (a), upregulated gene ontology (GO) molecular function to E2 (b), and heat map of a list of NAD pathway gene expression (c) (n=3 per group), by two-tailed unpaired Student’s t-test. d, Quantification of the percentage of RFP+ cells. Animal number: Control Veh (n=8), Control E2 (n=6), NAMPT Het Veh (n=8), NAMPT Het E2 (n=8). ANOVA summary (Interaction P = 0.997, Condition P < 0.0001, Treatment P < 0.0001, by two way-ANOVA followed by Tukey’s post-hoc test). e, Quantification of the percentage of RFP+ cells that express endogenous UCP1 (n=6 per group). ANOVA summary (Interaction P = 0.896, Condition P < 0.0001, Treatment P < 0.0001, by two way-ANOVA followed by Tukey’s post-hoc test). Data information: All results are presented as means ± SEM.
Extended Data Fig. 8
Extended Data Fig. 8. FK866 treatment has minimal effect on BAT thermogenesis upon cold exposure.
a, Representative H&E staining of BAT from E2-treated (10 μg/Kg) or combination with FK866 (10 mg/Kg) groups upon cold exposure. Scale bar, 100 μM. b, qPCR analysis of mRNA expression of thermogenic genes in BAT from E2-treated or combination with FK866 groups (n=4 per group) by two-tailed unpaired Student’s t-test. Data information: All results are presented as means ± SEM.
Extended Data Fig. 9
Extended Data Fig. 9. NAD+ levels in SVF cells are modulated by NMN or FK866 treatment.
Comparison of NAD+ levels in young versus aged SVF cells, treated with NMN (50 μM) or FK866 (300 nM), shows a decline in the aged cells, an effect that is altered by the treatments. Animal number: Young Veh (n=5), Young NMN (n=4), Young FK866 (n=4), Old Veh (n=5), Old NMN (n=4), Old FK866 (n=4). ANOVA summary (Interaction P < 0.0001, Age P < 0.0001, Treatments P < 0.0001, by two way-ANOVA followed by Tukey’s post-hoc test). Data information: All results are presented as means ± SEM.
Extended Data Fig. 10
Extended Data Fig. 10. NMN treatment has minimal effect on BAT thermogenesis upon cold exposure.
a, Representative H&E staining of BAT from vehicle or NMN-treated (50 mg/Kg) groups upon cold exposure. Scale bar, 100 μM. b, qPCR analysis of mRNA expression of thermogenic genes in BAT from vehicle or NMN-treated groups by two-tailed unpaired Student’s t-test. Animal number: Veh (n=5), NMN (n=4). c, The illustration of the mechanisms of E2-restored beige adipogenesis in aging mice. Data information: All results are presented as means ± SEM.
Fig. 1.
Fig. 1.. Estrogen ameliorates age-related defects in iWAT beiging.
a, Experimental procedure to track iWAT beiging in aging. Twelve-month-old male mice were intraperitoneally injected with vehicle or E2 (10 μg/Kg) daily and housed in room temperature (RT; 23°C) for one week, followed by one week of cold (6°C). b-d, Body weight (b), Animal number: RT Veh (n=4), RT E2 (n=4), Cold Veh (n=9), Cold E2 (n=10), the difference of core temperature (c), Animal number: RT Veh (n=9), RT E2 (n=10), Cold Veh (n=10), Cold E2 (n=10), ANOVA summary (Interaction P = 0.049, Temperature P < 0.0001, Treatment P = 0.0003, by two way-ANOVA followed by Tukey’s post-hoc test), and difference of body fat composition (d). Animal number: RT Veh (n=4), RT E2 (n=4), Cold Veh (n=9), Cold E2 (n=10), ANOVA summary (Interaction P = 0.029, Temperature P = 0.633, Treatment P = 0.188, by two way-ANOVA followed by Tukey’s post-hoc test). e, Energy expenditure and quantification. Animal number: RT Veh (n=5), RT E2 (n=4), Cold Veh (n=6), Cold E2 (n=7). ANOVA summary (Time, Treatment and Temperature; Interaction P = 0.698, Time P < 0.0001, Treatment and Temperature P = 0.048, Light; Interaction P = 0.0003, Temperature P < 0.0001, Treatment P <0.0001, Dark; Interaction P = 0.0007, Temperature P < 0.0001, Treatment P < 0.0001, by two way-ANOVA followed by Tukey’s post-hoc test). f, Blood glucose levels of vehicle or E2 treated group in 12-month-old male mice after intraperitoneal injection of glucose tolerance test (GTT; n=7 per group) and Area under curve (AUC) analysis, ANOVA summary (Interaction P = 0.519, Temperature P = 0.0005, Treatment P = 0.0003, by two way-ANOVA followed by Tukey’s post-hoc test). g, A volcano plot of genes. Genes with log2FC ≥ 0.58 and log10P value ≥ 1.3 were considered significant. Twelve-month-old male C57BL/6 mice were divided into two groups with vehicle or E2 treated group upon cold exposure (6°C; n = 3 per group). h, Heat map of a list of thermogenic gene expressions by two-tailed unpaired Student’s t-test. i, Representative H&E and Immunofluorescence staining of UCP1/Perilipin in the middle part of iWAT. Scale bar, 100 μm. j, qPCR analysis of thermogenic gene expressions in iWAT from vehicle or E2 treated upon RT (23°C) or Cold (6°C), Animal number: RT Veh (n=3), RT E2 (n=4), Cold Veh (n=6), Cold E2 (n=6). ANOVA summary (Ucp1; Interaction P = 0.045, Temperature P = 0.0046, Treatment P = 0.019, Cidea; Interaction P = 0.073, Temperature P = 0.01, Treatment P = 0.041, Cox8b; Interaction P = 0.052, Temperature P = 0.003, Treatment P = 0.02, by two way-ANOVA followed by Tukey’s post-hoc test). Data information: All results are presented as means ± SEM.
Fig. 2.
Fig. 2.. Estrogen promotes beige adipogenesis in vitro.
a, Schematic illustration. SVF cells isolated from iWAT of 2- or 12-month-old male mice were pre-treated with either vehicle or E2 (10 nM) before differentiating into beige adipocytes. b, Representative images of bright field and immunofluorescence staining of UCP1. Scale bar, 100 μm. c, Quantification of UCP1. (n=3 per group) ANOVA summary (Interaction P = 0.035, Age P < 0.0001, Treatment P < 0.0001, by two way-ANOVA followed by Tukey’s post-hoc test). d, qPCR analysis of the thermogenic gene expression. Animal number: Young Veh (n=6), Young E2 (n=8), Old Veh (n=4), Old E2 (n=4), ANOVA summary (UCP1; Interaction P = 0.047, Age P <0.0001, Treatment P < 0.0001, Cox8b; Interaction P = 0.61, Age P = 0.056, Treatment P < 0.0001, PGC1α; Interaction P = 0.472, Age P < 0.0001, Treatment P < 0.0001, by two way-ANOVA followed by Tukey’s post-hoc test). e, Seahorse analysis of oxygen consumption rates (OCR) in vehicles and E2-treated beige adipocytes between young (2 months) and aging (12 months). f, Quantification of basal respiration, ATP-turnover, and maximum respiratory capacity of the samples in panel (e) (n=7 per group). ANOVA summary (Basal; Interaction P = 0.01, Age P < 0.0001, Treatment P = 0.0003, ATP-linked; Interaction P = 0.479, Age P < 0.0001, Treatment P = 0.213, Maximum; Interaction P < 0.0001, Age P < 0.0001, Treatment P < 0.0001, by two way-ANOVA followed by Tukey’s post-hoc test). Data information: All results are presented as means ± SEM.
Fig. 3.
Fig. 3.. ER stress blocks beige adipocyte formation in 2-month-old mice.
a, Heat map of a list of ER stress-related gene expressions. b, qPCR analysis of ER stress-related gene expression in vehicle or E2 treated group upon cold exposure (6°C) by two-tailed unpaired Student’s t-test (n=10 per group). c, qPCR analysis of ER stress-related gene expression between young and aged male mice by two-tailed unpaired Student’s t-test (n=4 per group). d, Experimental procedure to track beige adipocyte formation in the activation status of ER stress. Two-month-old male mice were intraperitoneally injected with vehicle or Tunicamycin (Tun; 0.25 mg/Kg) before cold exposure and housed in cold exposure (6°C). e, The core temperature difference between the vehicle and Tun treated group upon cold exposure by two-tailed unpaired Student’s t-test. Animal number: Veh (n=8), Tun (n=7). f, The difference in body fat composition between initial and final upon cold exposure by two-tailed unpaired Student’s t-test. Animal number: Veh (n=8), Tun (n=7). g, Energy expenditure and quantification. (n=7 per group) ANOVA summary (Interaction P = 0.89, Time P = 0.246, Treatment P <0.0001, by two way-ANOVA followed by Tukey’s post-hoc test). h, Representative images of H&E staining and UCP1 immunofluorescence staining in the middle part of iWAT. Scale bar, 100 μm. i-j, qPCR analysis of the thermogenic gene expression (i) and ER stress-related gene expression (j) in vehicle and tunicamycin treated group by two-tailed unpaired Student’s t-test (n=5 per group). k, Representative images of UCP1 immunofluorescence staining. SVF cells isolated from iWAT of 2-month-old male mice were pre-treated with either vehicle or E2 or tunicamycin (0.5 μg/ml) before differentiating into beige adipocytes. Scale bar, 100 μm. l, Seahorse analysis of oxygen consumption rates (OCR) in the vehicle and E2-treated beige adipocytes with/without tunicamycin. Data information: All results are presented as means ± SEM.
Fig. 4.
Fig. 4.. Activation of the PERK signaling pathway attenuates E2-induced beiging.
a, Representative images of UCP1 immunofluorescence staining. SVF cells isolated from iWAT of 2-month-old male mice were pre-treated with either vehicle, E2 (10 nM), or three different activators of ER stress (10 μM) before differentiating into beige adipocytes. Scale bar, 100 μm. b, Quantification of UCP1 intensity from (a) by two way-ANOVA followed by Tukey’s post-hoc test. c-d, Western blot analysis of PERK and PERK phosphorylation in iWAT from vehicle and MK-28 (c), and quantification of PERK phosphorylation (d) (n=3 per group) by two-tailed unpaired Student’s t-test. e, Experimental procedure to track beige adipocyte formation in the activation status of ER stress. Two-month-old male mice were intraperitoneally injected with vehicle or MK-28 daily and housed in room temperature (RT; 23°C) or cold exposure (6°C). f, The difference in body fat composition between initial and final upon RT or cold exposure (n=5 per group) by one way-ANOVA followed by Tukey’s post-hoc test. g, Representative images of H&E and UCP1 immunofluorescence staining in the middle part of iWAT. Scale bar, 100 μm. h, qPCR analysis of thermogenic gene expression (n=5 per group) by one way-ANOVA followed by Tukey’s post-hoc test. i, The blood glucose levels of the vehicle or MK28 treated group in 2-month-old male mice after intraperitoneal injection of glucose tolerance test (GTT; n=5 per group) and Area under curve (AUC) analysis by one way-ANOVA followed by Tukey’s post-hoc test. Data information: All results are presented as means ± SEM.
Fig. 5.
Fig. 5.. Sma+ APCs contribute to E2-induced beige adipogenesis.
a, Representative images of UCP1 and RFP immunofluorescence staining in Sma-RFP+ derived beige adipocytes. SVF cells isolated from iWAT of Sma-RFP 2-month-old male mice were pre-treated either vehicle or E2 before differentiating into beige adipocytes. Scare bar 100 μm. b, Representative images of UCP1 and RFP immunofluorescence staining in Pdgfrα-RFP+ derived beige adipocytes. SVF cells isolated from iWAT of Pdgfrα-RFP 2-month-old male mice were pre-treated either vehicle or E2 before differentiating into beige adipocytes. Scare bar 100 μm. c, Quantification of number of Sma-RFP+ cells and the percentage of Sma-RFP+ cells that express endogenous UCP1 by two-tailed unpaired Student’s t-test. (n=6 per group). d, qPCR analysis of the thermogenic gene expression in Sma-RFP mice model by two-tailed unpaired Student’s t-test. Animal number: Veh (n=4), E2 (n=5). e, Quantification of number of Pdgfrα-RFP+ cells and the percentage of Pdgfrα-RFP+ cells that express endogenous UCP1 by two-tailed unpaired Student’s t-test (n=6 per group). f, qPCR analysis of the thermogenic gene expression in Pdgfrα-RFP mice model by two-tailed unpaired Student’s t-test. Animal number: Veh (n=4), E2 (n=5). Data information: All results are presented as means ± SEM.
Fig. 6.
Fig. 6.. The ablation of NAMPT signaling in Sma+ APCs inhibits beige adipocyte formation.
a, Heat map of a list of NAD pathway gene expressions. b, qPCR analysis of NAD-related gene expression in the vehicle or E2 treated group upon cold exposure (6°C) by two-tailed unpaired Student’s t-test (n=5 per group). c, qPCR analysis of NAD-related gene expression in between young and aging groups by two-tailed unpaired Student’s t-test (n=4 per group). d-e, Experimental procedure to track beige adipocytes in vivo. Two-month-old conditionally knockout NAMPT in Sma+ cells (Sma-CreERT2; Rosa26RRFP; NAMPTfl/fl) were housed at room temperature (23°C) after injecting Tamoxifen (TAM) and then exposed to cold temperature (6°C) for one week. f, Representative images of H&E staining and UCP1 immunofluorescence staining in control and NAMPT het mice. Scale bar, 100 μm. g, qPCR analysis of thermogenic gene expression from iWAT of control and NAMPT het mice by two-tailed unpaired Student’s t-test. Animal number: Control (n=5), NAMPT Het (n=6). h, Representative images of UCP1 and RFP immunofluorescence staining in Sma-RFP+ or Sma-RFP+ NAMPT het derived beige adipocytes. SVF cells isolated from iWAT of 2-month-old male control and NAMPT het mice were pre-treated with either vehicle or E2 (10 nM) before differentiating into beige adipocytes. Scare bar 100 μm. i-j, qPCR analysis of the expression of NAMPT (i) and thermogenic gene markers by two-tailed unpaired Student’s t-test (j) Animal number: Control Veh (n=4), Control E2 (n=4), NAMPT Het Veh (n=6), NAMPT Het E2 (n=6). ANOVA summary (UCP1; Interaction P < 0.0001, Condition P < 0.0001, Treatment P < 0.0001, Cidea; Interaction P < 0.0001, Condition P < 0.0001, Treatment P < 0.0001, Dio2; Interaction P < 0.0001, Condition P < 0.0001, Treatment P < 0.0001, by two way-ANOVA followed by Tukey’s post-hoc test). Data information: All results are presented as means ± SEM.
Fig. 7.
Fig. 7.. FK866 abolishes E2-restored beige adipocyte formation in aging mice.
a, Experimental procedure. Twelve-month-old male mice were intraperitoneally injected with E2 or FK866 (10 mg/Kg) the other day for two weeks and housed in RT (23°C) for one week, followed by one week of cold exposure (6°C). b, Body weight. Animal number: E2 (n=4), E2 + FK866 (n=5). c, Representative images of H&E staining and UCP1 immunofluorescence staining in the middle part of iWAT. Scale bar, 100 μm. d, The difference in core temperature by two-tailed unpaired Student’s t-test. Animal number: E2 (n=4), E2 + FK866 (n=5). e, qPCR analysis of the thermogenic gene markers by two-tailed unpaired Student’s t-test. f, Representative images of UCP1 immunofluorescence staining. SVF cells isolated from iWAT of 12-month-old male mice were pre-treated with either vehicle or E2 (10 nM) or FK866 (300 nM) before differentiating into beige adipocytes. Scale bar, 100 μM. g, qPCR analysis of ER stress related genes in E2 or E2+FK866 by two-tailed unpaired Student’s t-test (n=4 per group). h, qPCR analysis of ER stress related genes in control or NAMPT het mice upon vehicle or E2 treatment. Animal number: Control Veh (n=4), Control E2 (n=4), NAMPT Het Veh (n=6), NAMPT Het E2 (n=6). ANOVA summary (Perk; Interaction P = 0.41, Condition P = 0.0002, Treatment P < 0.0001, Atf4; Interaction P =0.94, Condition P = 0.19, Treatment P = 0.01, Chop; Interaction P = 0.0048, Condition P = 0.04, Treatment P = 0.713, by two way-ANOVA followed by Tukey’s post-hoc test). Data information: All results are presented as means ± SEM.
Fig. 8.
Fig. 8.. NMN administration promotes beige adipocyte formation in aging mice.
a, Experimental procedure. Twelve-month-old male mice were intraperitoneally injected with vehicle or Nicotinamide mononucleotide (NMN; 50 mg/Kg) daily and housed at RT (23°C) for one week, followed by one week of cold exposure (6°C). b-c, Body weight (b) and the difference in core temperature (c). Animal number: Veh (n=5), NMN (n=4). ANOVA summary (Interaction P = 0.022, Temperature P < 0.0001, Treatment P < 0.0001, by two way-ANOVA followed by Tukey’s post-hoc test). d, Representative images of H&E staining and UCP1 immunofluorescence staining in the middle part of iWAT. Scale bar, 100 μm. e, qPCR analysis of the thermogenic gene markers by two-tailed unpaired Student’s t-test (n=4 per group). f, The blood glucose levels of the vehicle or NMN-treated group in 12-month-old male mice after intraperitoneal injection of GTT and Area under curve (AUC) analysis by two-tailed unpaired Student’s t-test. Animal number: Veh (n=5), NMN (n=4). g-h, SVF cells isolated from iWAT of 12-month-old male mice were pre-treated with either vehicle or NMN (50 μM) before differentiating into beige adipocytes. Western blot (g) and quantification (h) of ER stress proteins between vehicle and NMN-treated aging mice by two-tailed unpaired Student’s t-test. Animal number: Veh (n=3), NMN (n=3). i, qPCR analysis of ER stress-related gene expression in the vehicle or NMN-treated group by two-tailed unpaired Student’s t-test. Animal number: Veh (n=5), NMN (n=4). All results are presented as means ± SEM.

Similar articles

Cited by

References

    1. Spiegelman BM & Flier JS Obesity and the regulation of energy balance. Cell 104, 531–543 (2001). https://doi.org:S0092-8674(01)00240-9 [pii] - PubMed
    1. Friedman JM Obesity: Causes and control of excess body fat. Nature 459, 340–342 (2009). https://doi.org.459340a [pii] 10.1038/459340a - DOI - PubMed
    1. Jura M & Kozak LP Obesity and related consequences to ageing. Age (Dordr) 38, 23 (2016). 10.1007/s11357-016-9884-3 - DOI - PMC - PubMed
    1. Finucane MM et al. National, regional, and global trends in body-mass index since 1980: systematic analysis of health examination surveys and epidemiological studies with 960 country-years and 9.1 million participants. Lancet 377, 557–567 (2011). 10.1016/S0140-6736(10)62037-5 - DOI - PMC - PubMed
    1. Stout MB, Justice JN, Nicklas BJ & Kirkland JL Physiological Aging: Links Among Adipose Tissue Dysfunction, Diabetes, and Frailty. Physiology (Bethesda) 32, 9–19 (2017). 10.1152/physiol.00012.2016 - DOI - PMC - PubMed

Substances