

Transcriptome and metabolome analysis reveals mechanism of light intensity modulating iridoid biosynthesis in Gentiana macrophylla Pall
- PMID: 38858643
- PMCID: PMC11165902
- DOI: 10.1186/s12870-024-05217-y
Transcriptome and metabolome analysis reveals mechanism of light intensity modulating iridoid biosynthesis in Gentiana macrophylla Pall
Abstract
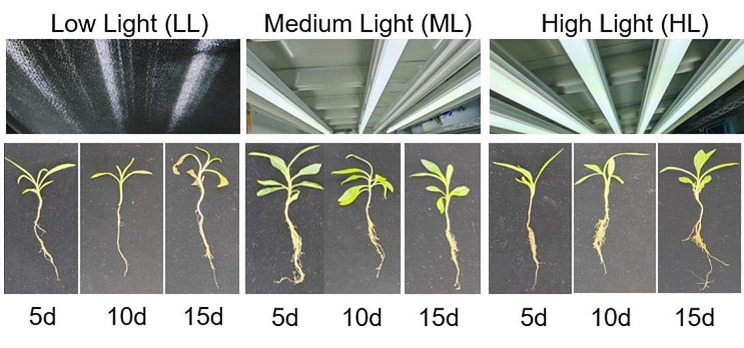
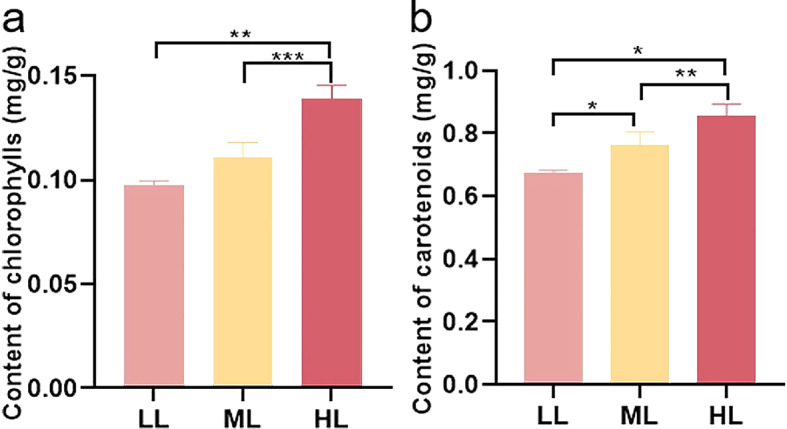
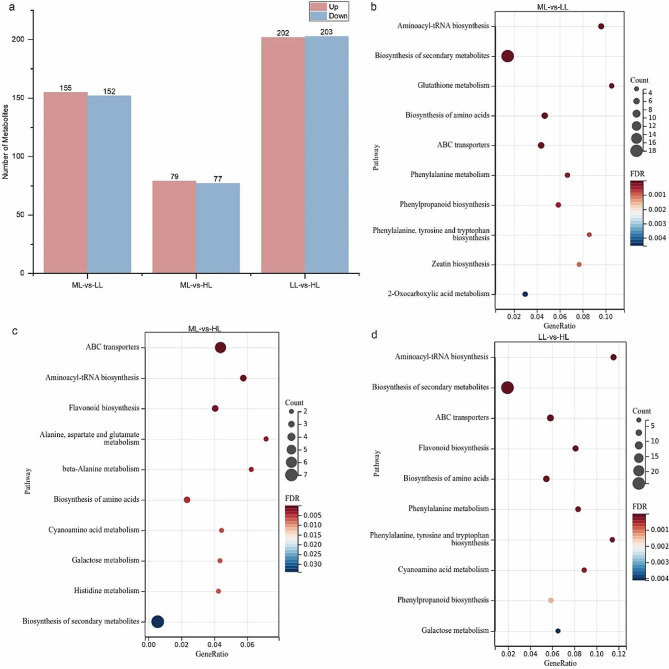
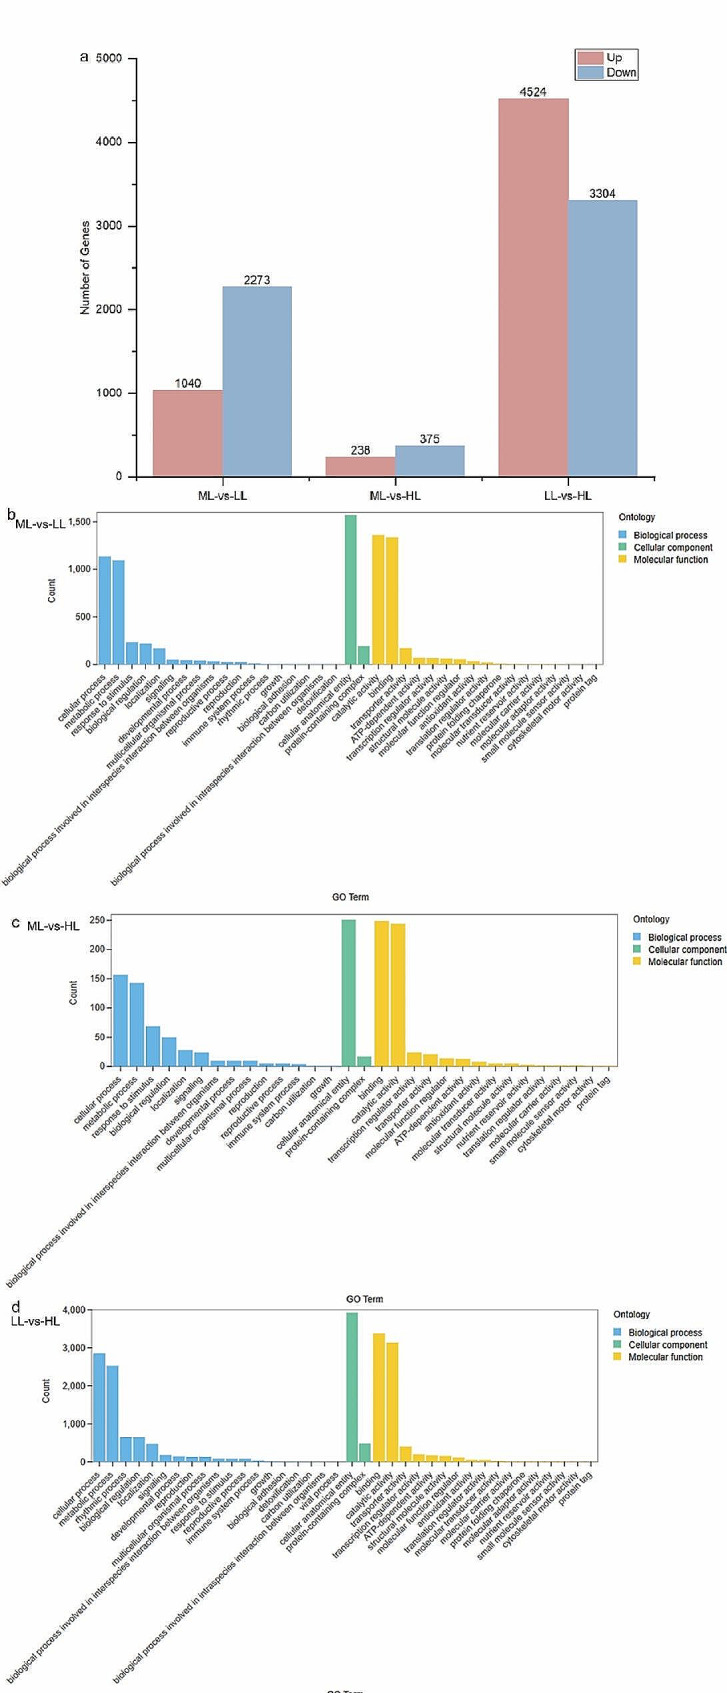
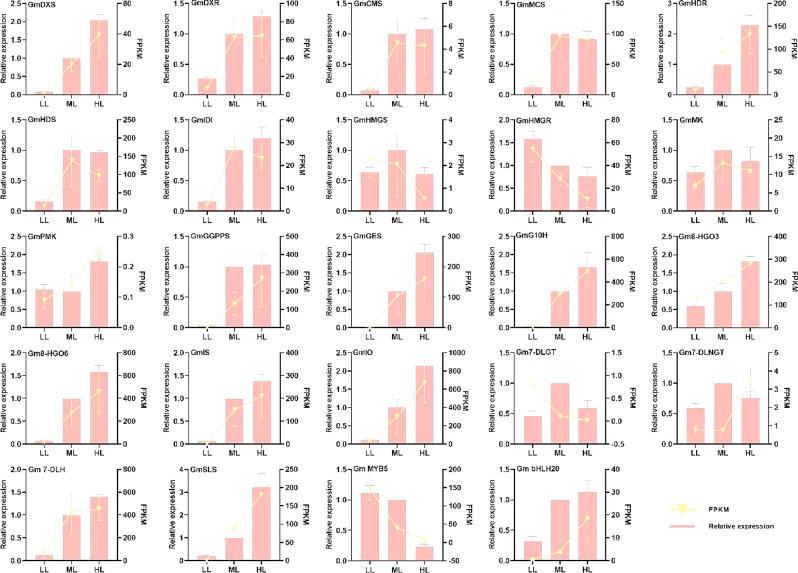
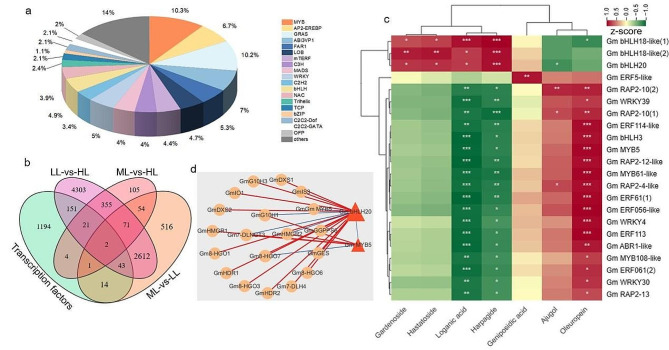
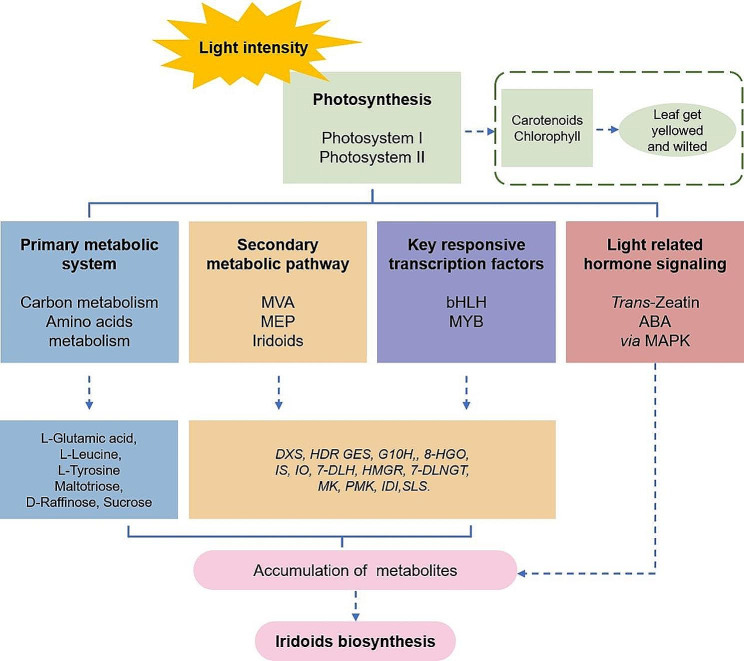
Light intensity is a key factor affecting the synthesis of secondary metabolites in plants. However, the response mechanisms of metabolites and genes in Gentiana macrophylla under different light intensities have not been determined. In the present study, G. macrophylla seedlings were treated with LED light intensities of 15 µmol/m2/s (low light, LL), 90 µmol/m2/s (medium light, ML), and 200 µmol/m2/s (high light, HL), and leaves were collected on the 5th day for further investigation. A total of 2162 metabolites were detected, in which, the most abundant metabolites were identified as flavonoids, carbohydrates, terpenoids and amino acids. A total of 3313 and 613 differentially expressed genes (DEGs) were identified in the LL and HL groups compared with the ML group, respectively, mainly enriched in KEGG pathways such as carotenoid biosynthesis, carbon metabolism, glycolysis/gluconeogenesis, amino acids biosynthesis, plant MAPK pathway and plant hormone signaling. Besides, the transcription factors of GmMYB5 and GmbHLH20 were determined to be significantly correlated with loganic acid biosynthesis; the expression of photosystem-related enzyme genes was altered under different light intensities, regulating the expression of enzyme genes involved in the carotenoid, chlorophyll, glycolysis and amino acids pathway, then affecting their metabolic biosynthesis. As a result, low light inhibited photosynthesis, delayed glycolysis, thus, increased certain amino acids and decreased loganic acid production, while high light got an opposite trend. Our research contributed significantly to understand the molecular mechanism of light intensity in controlling metabolic accumulation in G. macrophylla.
Keywords: Gentiana macrophylla Pall.; Iridoid biosynthesis; Light intensity; Metabolome analysis; Transcriptome analysis.
© 2024. The Author(s).
Conflict of interest statement
All authors certify that they have no affiliations with or involvement in any organization or entity with any financial interest or non-financial interest in the subject matter or materials discussed in this manuscript.
Figures


Similar articles
-
A Comparative Transcriptomic with UPLC-Q-Exactive MS Reveals Differences in Gene Expression and Components of Iridoid Biosynthesis in Various Parts of Gentiana macrophylla.Genes (Basel). 2022 Dec 15;13(12):2372. doi: 10.3390/genes13122372. Genes (Basel). 2022. PMID: 36553639 Free PMC article.
-
Transcriptional Responses and Gentiopicroside Biosynthesis in Methyl Jasmonate-Treated Gentiana macrophylla Seedlings.PLoS One. 2016 Nov 16;11(11):e0166493. doi: 10.1371/journal.pone.0166493. eCollection 2016. PLoS One. 2016. PMID: 27851826 Free PMC article.
-
Genome-wide identification and transcriptional expression profiles of the transcription factor WRKY in Gentiana macrophylla.Mol Biol Rep. 2025 Mar 27;52(1):344. doi: 10.1007/s11033-025-10452-z. Mol Biol Rep. 2025. PMID: 40146451
-
Integrated Transcriptomics and Metabolomics Reveal Key Insights into Iridoid Biosynthesis in Gentiana crassicaulis Seeds during Germination.Genes (Basel). 2024 Sep 26;15(10):1255. doi: 10.3390/genes15101255. Genes (Basel). 2024. PMID: 39457379 Free PMC article.
-
Genomic characterization of WRKY transcription factors related to secoiridoid biosynthesis in Gentiana macrophylla.BMC Plant Biol. 2024 Jan 23;24(1):66. doi: 10.1186/s12870-024-04727-z. BMC Plant Biol. 2024. PMID: 38262919 Free PMC article.
References
-
- Peng MC, Ai XH. Research progress in chemical constituents, pharmacological effects and clinical application of the flowers of Gentianae macrophylla. Cent S Pharm. 2021;19:1243–9. doi: 10.7539/j.issn.1672-2981.2021.06.039. - DOI
MeSH terms
Substances
Grants and funding
- 81903753/Natural Science Foundation of China
- 2022SF-089/the Key Research and Development Program of Shaanxi Province
- 23JY024/the Project on Collaborative Innovation of Shaanxi Provincial Department of Education
- 21JY011/the Project on Collaborative Innovation of Shaanxi Provincial Department of Education
- 2023-ZDLSF-58/the Key Industry Innovation Chain (Group) of Shaanxi Province
LinkOut - more resources
Full Text Sources
Research Materials
