Review
. 2024 Jun 10;21(1):51.
doi: 10.1186/s12987-024-00534-8.

Alterations in brain fluid physiology during the early stages of development of ischaemic oedema

Affiliations
Review

Alterations in brain fluid physiology during the early stages of development of ischaemic oedema

Stephen B Hladky et al. Fluids Barriers CNS. .

Abstract

Oedema occurs when higher than normal amounts of solutes and water accumulate in tissues. In brain parenchymal tissue, vasogenic oedema arises from changes in blood-brain barrier permeability, e.g. in peritumoral oedema. Cytotoxic oedema arises from excess accumulation of solutes within cells, e.g. ischaemic oedema following stroke. This type of oedema is initiated when blood flow in the affected core region falls sufficiently to deprive brain cells of the ATP needed to maintain ion gradients. As a consequence, there is: depolarization of neurons; neural uptake of Na+ and Cl- and loss of K+; neuronal swelling; astrocytic uptake of Na+, K+ and anions; swelling of astrocytes; and reduction in ISF volume by fluid uptake into neurons and astrocytes. There is increased parenchymal solute content due to metabolic osmolyte production and solute influx from CSF and blood. The greatly increased [K+]isf triggers spreading depolarizations into the surrounding penumbra increasing metabolic load leading to increased size of the ischaemic core. Water enters the parenchyma primarily from blood, some passing into astrocyte endfeet via AQP4. In the medium term, e.g. after three hours, NaCl permeability and swelling rate increase with partial opening of tight junctions between blood-brain barrier endothelial cells and opening of SUR1-TPRM4 channels. Swelling is then driven by a Donnan-like effect. Longer term, there is gross failure of the blood-brain barrier. Oedema resolution is slower than its formation. Fluids without colloid, e.g. infused mock CSF, can be reabsorbed across the blood-brain barrier by a Starling-like mechanism whereas infused serum with its colloids must be removed by even slower extravascular means. Large scale oedema can increase intracranial pressure (ICP) sufficiently to cause fatal brain herniation. The potentially lethal increase in ICP can be avoided by craniectomy or by aspiration of the osmotically active infarcted region. However, the only satisfactory treatment resulting in retention of function is restoration of blood flow, providing this can be achieved relatively quickly. One important objective of current research is to find treatments that increase the time during which reperfusion is successful. Questions still to be resolved are discussed.

Keywords: ATP depletion; Aquaporin 4; Astrocyte swelling; Blood–brain barrier permeability; CSF influx; Donnan effect; Neuronal swelling; Perivascular spaces; Reperfusion; Spreading depolarization.


Conflict of interest statement

The authors declare that they have no competing interests.

Figures

Fig. 1
Fig. 1
Timeline of changes in the core in the first 12 h of cortical ischaemic oedema. In less than 5 min of ischaemia, intracellular ATP concentrations in the core fall, Na+ and Ca2+ pumps fail, neurons become depolarized and release K+ which is is transferred from neurons to astrocytes. After 5 min (as shown in orange) it becomes evident that: there are spreading depolarizations that extend into the penumbra; ion gradients collapse; both neurons and astrocytes swell at the expense of ISF volume. The combined volume occupied by ISF and cells increases initially as CSF enters enlarged perivascular spaces and subsequently as NaCl and water enter the parenchyma across the blood–brain barrier. The rate of swelling is sustained by changes in blood–brain barrier properties (as shown in green). These include opening of SUR1-TRPM4 channels allowing Na+ to pass through endothelial cells and into astrocyte endfeet (see Sects. 3.5.2 and 4.2). There are also conformational changes in the tight junctions between endothelial cells increasing paracellular permeability of the endothelial cell layer (see Sect. 4.2.2). At first this allows small molecules to pass through and eventually large molecules and cells to enter as well. Gross failure of the blood–brain barrier occurs within a day. At longer times than shown there is generalised disintegration both of extracellular matrix and of all cell types in the core
Fig. 2
Fig. 2
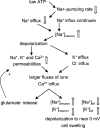
Flow diagram of the ionic changes occurring in neurons at the onset of ischaemia. ATP concentrations fall, active efflux of Na+ by the Na+-pump is reduced, and Na+ influx exceeds its efflux. Hence [Na+]neuron increases and [Na+]isf decreases and this increase in positively-charged Na+ inside the neuron leads to depolarization. This results in K+ efflux and Cl entry with further Na+ influx balancing these ion movements to preserve electroneutrality. Other effects of depolarization are increases in permeability (i.e. opening more voltage-sensitive channels) to Na+ and Ca2+ leading to further increases in [Na+]neuron and [Ca2+]neuron, further depolarization and release of glutamate. Increased [glutamate]isf leads to further increase in the permeability to Na+ and Ca2+ via glutamate-activated channels. The accompanying decrease in [Na+]isf and increase in [K+]isf can be by as much as 80 mM (to roughly half of normal) and 40–60 mM (more than ten times normal) respectively. The gain of Na+ and Cl exceeds the loss of K+ and the neurons swell at the expense of ISF
Fig. 3
Fig. 3
Figure depicting events involved in spreading depolarization. i The depolarization of neurons is initiated by diffusion of K+ from adjacent already depolarized tissue. This increase in [K+]isf leads to influx of K+ and to depolarization. ii Depolarization then triggers opening of Na+ channels and influx of Na+ which amplifies the depolarization leading to release of K+ which further increases [K+]isf. Diffusion of K+ to adjacent cells propagates the wave of depolarization. iii The energy required by neurons to recover from the gain of Na+ and loss of K+ far exceeds that required for recovery from normal neural activity
Fig. 4
Fig. 4
Changes in ion transport between neurons, astrocytes, ISF, CSF and plasma following depletion of ATP in the core. a In the neurons, because ATP is depleted, the Na+,K+- ATPase (the Na+- pump) can no longer produce outward movement of Na+ to balance its inward movement via channels and other transporters. The net entry of positively charged Na+ depolarizes the cell membrane. This depolarization opens further routes for Na+ entry and also leads to K+ exit via K+ channels and to Cl entry via unspecified channels or cotransporters. The gain of Na+ exceeds the loss of K+, the net accumulation of cations and Cl draws in water from ISF and thus the neurons swell. b In ISF, as a result of neuronal Na+ uptake and K+ release, [Na+]isf decreases to as low as 60–70 mM whilst [K+]isf increases to as much as 40–60 mM. c Astrocytes respond to the increase in [K+]isf by taking up K+ via K+ channels so depolarizing their membranes. Na+ and HCO3 enter via the NBCe1 cotransporter and the associated entry of net negative charge allows further entry of K+. Some of the HCO3 may exchange with Cl. The astrocytes swell by taking up water from ISF or from perivascular spaces via their AQP4-containing endfeet membranes (see Sect. 3.6 and appendix E for further discussion). The events in a, b and c occur within a few minutes of the onset of ischaemia. d) Also starting immediately but progressing over hours is net entry of Na+ (red) and Cl (green) into the parenchyma from outside, i.e. from CSF and/or plasma. There is also net loss of K+ (blue) from the parenchyma to CSF and/or plasma. These ion movements, maintaining electroneutrality, result in a gain of parenchymal solute content, entry of water and thus formation of oedema
Fig. 5
Fig. 5
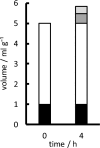
Illustration of the increase in parenchymal tissue volume during development of oedema four hours after onset of MCAO. The heights of the columns indicate volumes per gram of tissue dry weight: tissue solids (black); the initial fluid volume both intra- and extracellular (white); the additional volume resulting from net uptake of ions (dark grey), i.e. NaCl influx, but KCl efflux; and the additional volume (light grey) resulting from metabolic production within the tissue of new osmoles together with the amount of water that maintains nearly constant osmolality, ~ 310 mOsmol L−1. The fraction of the volume increase attributable to net uptake of ions is fionic = (net ion gain) / ((increase in volume) x (310 mOsmol L−1)) and the fraction attributable to production of new osmoles is 1—fionic. In these expressions, the net ion gain is the sum of the Na+ and Cl gains minus the K+ loss; and the Cl uptake is assumed to be equal to Na+ gain minus K+ loss. Data from appendix D
Fig. 6
Fig. 6
Time courses of intakes of a fluorescent CSF marker a) and of water b) into a brain region following MCAO. a Changes in fluorescence from the marker added to CSF in the cisterna magna at t = -15 min, shown for regions on the ipsilateral (solid) and contralateral (dashed) sides. F0 is the fluorescence at t = 0. b Water content of the ipsilateral (solid) and contralateral (dashed) regions shown as mL of water per gram dry weight of tissue. Note that the intake of the fluorescent marker in a and of water in b appear to be complete within a few minutes. Furthermore, the increase in water content, about 0.2 mL g−1 over 15 min, is substantially less than the increases over 3 to 4 h measured by others in different species (see appendix D and Fig. 5). Redrawn and simplified from data in Fig. 1 of Mestre et al. [26]
Fig. 7
Fig. 7
Suggested routes for Na+ and K+ transport across the endothelial cells of the blood–brain barrier in the early stages of ischaemic oedema. Passive fluxes of Na+, K+ and Cl probably occur via paracellular routes involving electrodiffusion that accounts for the endothelial conductance. Active transport through the cells is driven by the Na+-pump, a Na+, K+-ATPase: the increase in [K+]isf stimulates this pump leading to Na+ flux from the endothelial cells into ISF and K+ flux from ISF into the cells. The resulting decrease in [Na+]cell drives inward fluxes of Na+, K+ and Cl from blood into the cells via NKCC1. The net effect is transport of Na+ and Cl from blood to ISF and of K+ from ISF to blood. Many more transporters in addition to those shown are involved, prominently NHE1/2 as mentioned in the text, but the overall effect is as shown. There may be some recycling of K+ as indicated by the dotted line
Fig. 8
Fig. 8
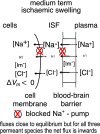
Diagram comparing movements of Na+, K+ and Cl into and out of parenchymal and endothelial cells before (left) and during (right) the initial phase of ischaemic swelling. Negatively charged impermeant solutes, Im, in the parenchyma and in the endothelial cells provide part of the driving force for development of ischaemic oedema. ΔVm, is the cell membrane potential inside relative to 0 in plasma. a Before ischaemia, Na+ is effectively excluded from the cells in the parenchyma by their Na+- pumps. K+ is attracted into the cells and Cl repelled from them by the negative membrane potential, an example of the Donnan effect (see appendix E). The volumes of the cells and ISF are stable as are the ion concentrations, with the concentrations of Na+, K+ and Cl in ISF close to those in plasma. There may be a small net flux of solutes and water from plasma into ISF matched by a net flux out of the tissue into CSF primarily via perivascular routes (see [4]). b During the initial stages of ischaemia: the Na+-pumps are no longer able to exclude Na+ from the cells in the parenchyma but are still functional in the endothelial cells (see Sect. 3.5.2.2); Na+ and Cl enter parenchymal cells; K+ initially redistributes from neurons to astrocytes but eventually leaves both cell types; the cell membranes depolarize to small negative potentials; and the cells swell and ISF shrinks as described in Sect. 3.6. On a time scale of minutes to hours Na+ and Cl enter ISF across the blood–brain barrier at a rate that depends on the permeability of the barrier to these ions. Water follows down the resultant of the total osmotic and hydrostatic pressure gradients. The gradient for solute entry from the plasma persists because [Na+]isf and [Cl]isf are kept somewhat less than the concentrations in plasma by continued entry of Na+ and Cl into the parenchymal cells. Development of oedema in the medium term, times from ~ 3 h to possibly 12 h (or more) is considered in Sects. 4 to 4.2.2 and Fig. 9
Fig. 9
Fig. 9
Diagram showing the movements of permeants, Na+, K+ and Cl, into and out of parenchymal and endothelial cells in the medium term during ischaemic swelling. The Na+- pump is inhibited both in the parenchymal and endothelial cells (compare with situation in Fig. 8). The net negative charge on the impermeants (Im) will lead to accumulation of Na+ and K+. If equilibrium could be reached (sufficient impermeants would need to be in plasma) their concentrations in the parenchyma cells would be slightly greater than in plasma. (For an introduction to more quantitative treatment see appendix E). However, during swelling entry of water keeps these concentrations slightly below those in plasma. There thus continue to be small gradients that drive influx of solutes like Na+ and Cl and this influx tends to increase solute concentrations which tend to increase the driving force for water entry. The net result is continually increasing amounts of solutes and water and thus tissue swelling
Fig. 10
Fig. 10
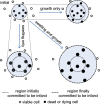
Schematic diagram showing possible ways in which growth and swelling of the core region can occur over time. Examples of cells present in and around the core are indicated by the small circles, (viable cells in white, dead or dying cells in black). The larger dotted circles indicate the size of the core shortly after the onset of ischaemia. The dashed circles represent the size of infarct after 2–3 days: upper right if cells outside the core region become incorporated but with no change in cell volume; lower left the size of an infarct if cells originally within the core swell but no extra cells from outside the original core are incorporated: lower right if both of these indicated changes take place
Fig. 11
Fig. 11
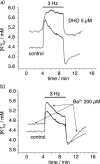
Effects of a dihydro-ouabain (DHO) and b) Ba2+ on [K+]isf. Concentrations were measured using ion-selective microelectrodes under baseline conditions and during antidromic Schaffer collateral 3 Hz stimulation of cells in the CA3 stratum pyramidale of rat hippocampus. Neuron firing releases K+ into the ISF. DHO is an inhibitor of Na+-pumps; Ba2+ inhibits Kir4.1 K+ channels known to be expressed in the astrocytes. Data traces are from D’Ambrosio et al. [265]. Each trace shows the baseline values before 3 Hz stimulation begins at 4 min. During this initial period, the rates of K+ release and uptake are in balance for the neurons and the astrocytes. In the control traces in both a) and b) at the onset of stimulation [K+]isf increases rapidly to a peak then falls gradually as increases in [Na+]neuron stimulate the neural Na+-pumps and thus increase the rate of reuptake of K+ into the neurons. At the end of stimulation, [K+]isf decreases rapidly, overshoots the baseline and then increases towards baseline as [Na+]neuron and the rate of K+ uptake into the neurons return to baseline values [265]. Both DHO in a and Ba2+ in b increase the baseline prestimulation [K+]isf compared to its paired control suggesting that each inhibits one or more routes of removal of K+ from ISF. a With DHO present, at the onset of stimulation [K+]isf increases rapidly to a higher and sustained plateau indicating that the rate of K+ removal from ISF is the same as the increased rate at which it is being released from the neurons. At the end of stimulation [K+]isf decreases rapidly but with little overshoot. The absence of the gradual decline during stimulation and the lack of overshoot afterwards suggest that 5 µM DHO has completely inhibited the Na+ pumps in the neurons. This is consistent with the idea that the isoform of the pump in the neurons has a relatively high affinity for DHO [267]. In this interpretation, the release of K+ during stimulation would be balanced by uptake into astrocytes. From the evidence discussed so far this uptake could be via either a pump isoform with relatively low affinity for DHO or K+ channels. b With Ba2+ present, [K+]isf is higher than in the paired control both before and during stimulation suggesting that Ba2+ has inhibited removal of K+ from ISF into the cells. At the end of stimulation, Ba2+ accentuates the size of the overshoot in [K+]isf below the baseline before stimulation. This phenomenon is explained [265] by the combination of continued rapid uptake of K+ by the neural Na+-pumps stimulated by increased [Na+]neuron together with inhibition by Ba2+ of the return of K+ to ISF from the astrocytes

Similar articles

Cited by

References

    1. Hladky SB, Barrand MA. Regulation of brain fluid volumes and pressures: basic principles, intracranial hypertension, ventriculomegaly and hydrocephalus Fluids Barriers CNS 2024. 10.1186/s12987-024-00532-w. (in press)
    1. Hladky SB, Barrand MA. The glymphatic hypothesis: the theory and the evidence. Fluids Barriers CNS. 2022;19:9. - PMC - PubMed
    1. Hladky SB, Barrand MA. Elimination of substances from the brain parenchyma: efflux via perivascular pathways and via the blood–brain barrier. Fluids Barriers CNS. 2018;15:30. - PMC - PubMed
    1. Hladky SB, Barrand MA. Fluid and ion transfer across the blood–brain and blood–cerebrospinal fluid barriers; a comparative account of mechanisms and roles. Fluids Barriers CNS. 2016;13:19. - PMC - PubMed
    1. Hladky SB, Barrand MA. Mechanisms of fluid movement into, through and out of the brain: evaluation of the evidence. Fluids Barriers CNS. 2014;11:26. - PMC - PubMed