

Attenuation of osteoarthritis progression via locoregional delivery of Klotho-expressing plasmid DNA and Tanshinon IIA through a stem cell-homing hydrogel
- PMID: 38858695
- PMCID: PMC11163801
- DOI: 10.1186/s12951-024-02608-z
Attenuation of osteoarthritis progression via locoregional delivery of Klotho-expressing plasmid DNA and Tanshinon IIA through a stem cell-homing hydrogel
Abstract
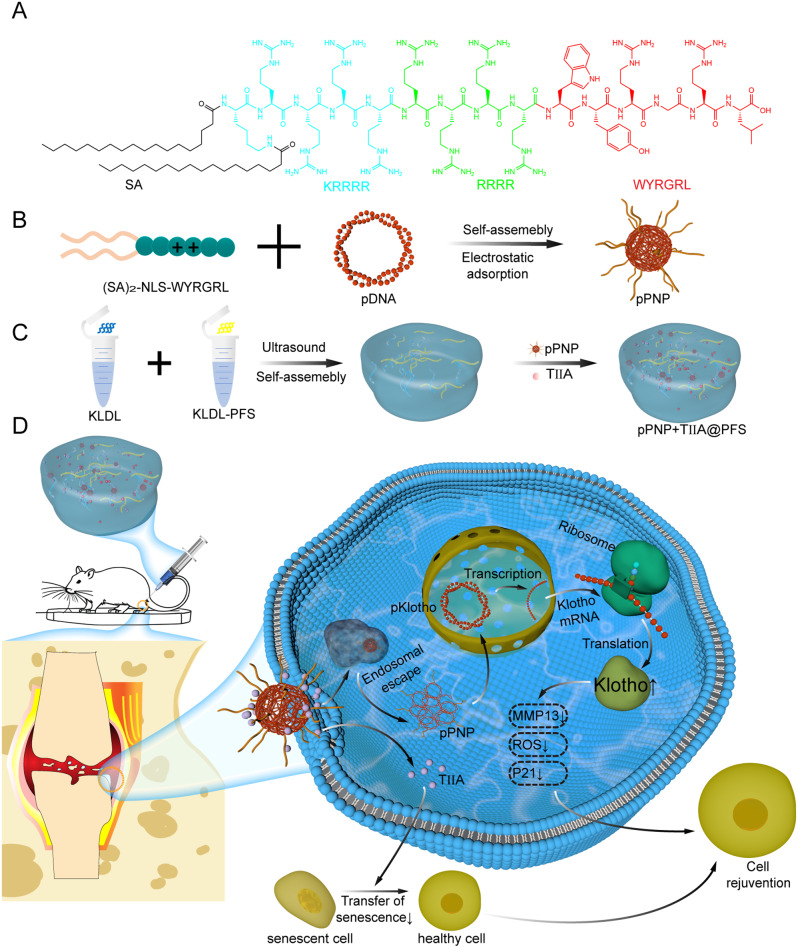
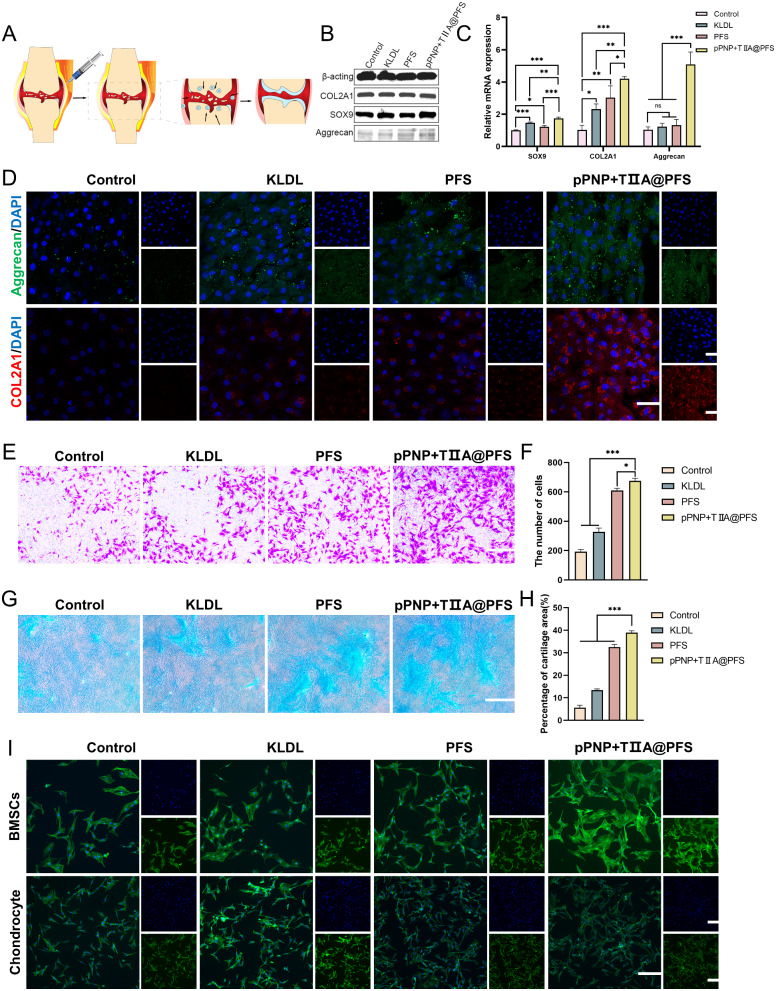
Background: Osteoarthritis (OA) is an aging-related degenerative joint disorder marked by joint discomfort and rigidity. Senescent chondrocytes release pro-inflammatory cytokines and extracellular matrix-degrading proteins, creating an inflammatory microenvironment that hinders chondrogenesis and accelerates matrix degradation. Targeting of senescent chondrocytes may be a promising approach for the treatment of OA. Herein, we describe the engineering of an injectable peptide-hydrogel conjugating a stem cell-homing peptide PFSSTKT for carrying plasmid DNA-laden nanoparticles and Tanshinon IIA (pPNP + TIIA@PFS) that was designed to attenuate OA progression by improving the senescent microenvironment and fostering cartilage regeneration.
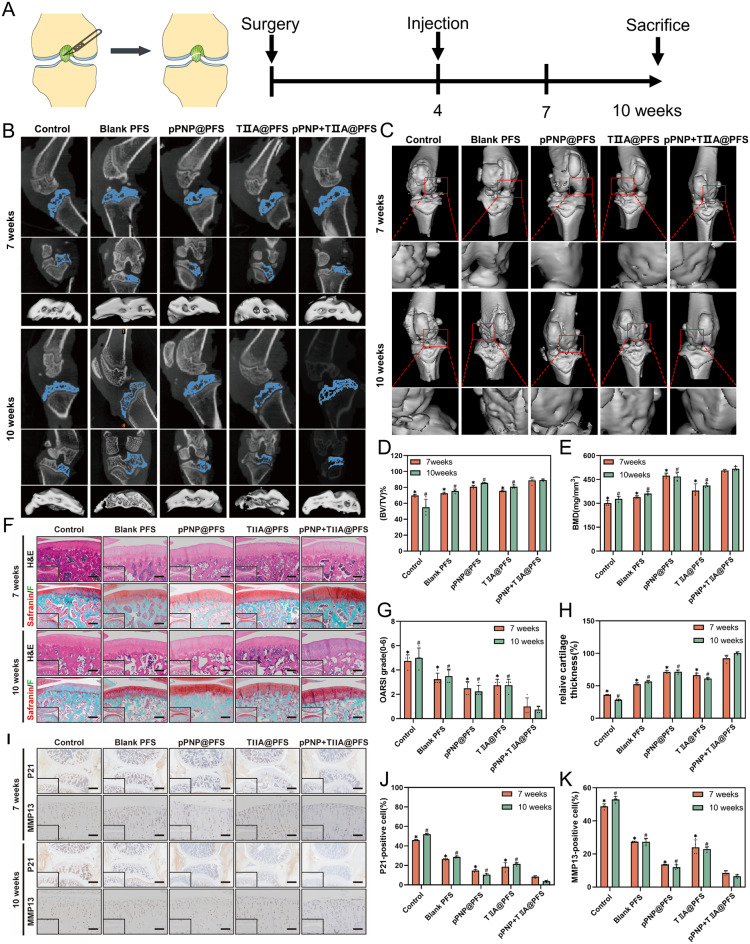
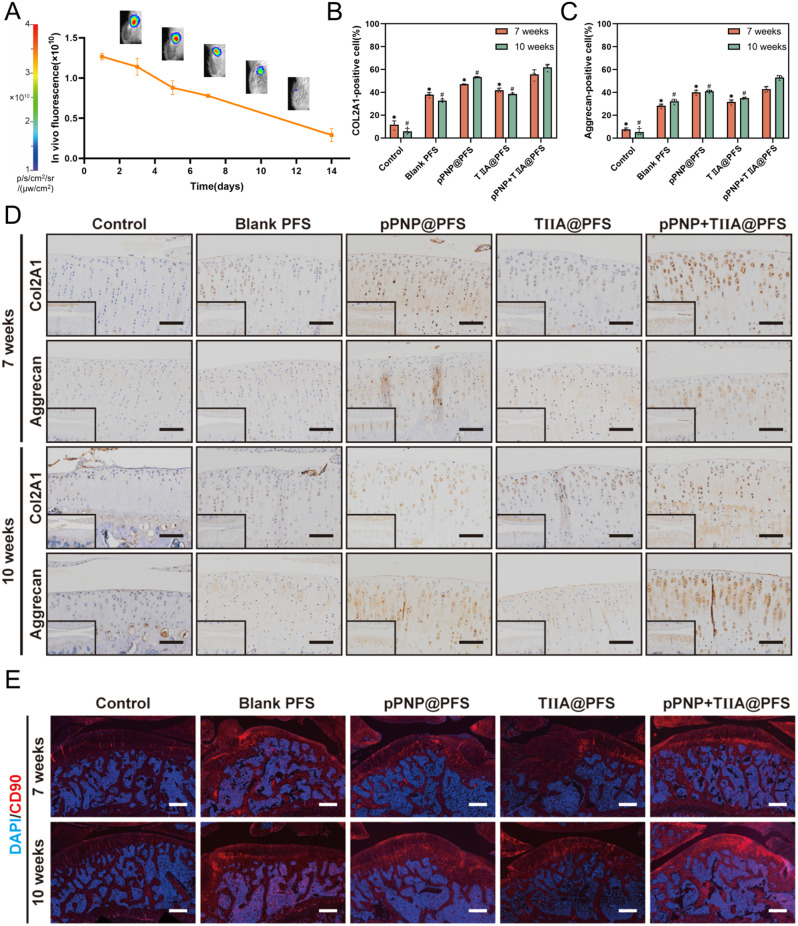
Results: Specifically, pPNP + TIIA@PFS elevates the concentration of the anti-aging protein Klotho and blocks the transmission of senescence signals to adjacent healthy chondrocytes, significantly mitigating chondrocyte senescence and enhancing cartilage integrity. Additionally, pPNP + TIIA@PFS recruit bone mesenchymal stem cells and directs their subsequent differentiation into chondrocytes, achieving satisfactory chondrogenesis. In surgically induced OA model rats, the application of pPNP + TIIA@PFS results in reduced osteophyte formation and attenuation of articular cartilage degeneration.
Conclusions: Overall, this study introduces a novel approach for the alleviation of OA progression, offering a foundation for potential clinical translation in OA therapy.
Keywords: Cartilage rejuvenation; Klotho; Osteoarthritis; Senescent; Stem cell-homing hydrogel.
© 2024. The Author(s).
Conflict of interest statement
The authors declare no competing interests.
The authors declare no conflict of interest.
Figures
Similar articles
-
Targeted lipid nanoparticles distributed in hydrogel treat osteoarthritis by modulating cholesterol metabolism and promoting endogenous cartilage regeneration.J Nanobiotechnology. 2024 Dec 20;22(1):786. doi: 10.1186/s12951-024-02965-9. J Nanobiotechnology. 2024. PMID: 39707367 Free PMC article.
-
Senolytic activity of small molecular polyphenols from olive restores chondrocyte redifferentiation and promotes a pro-regenerative environment in osteoarthritis.Aging (Albany NY). 2020 Aug 3;12(16):15882-15905. doi: 10.18632/aging.103801. Epub 2020 Aug 3. Aging (Albany NY). 2020. PMID: 32745074 Free PMC article.
-
Engineered MSC-sEVs as a Versatile Nanoplatform for Enhanced Osteoarthritis Treatment via Targeted Elimination of Senescent Chondrocytes and Maintenance of Cartilage Matrix Metabolic Homeostasis.Adv Sci (Weinh). 2025 Feb;12(8):e2413759. doi: 10.1002/advs.202413759. Epub 2025 Jan 4. Adv Sci (Weinh). 2025. PMID: 39755936 Free PMC article.
-
The Role of Chondrocyte Hypertrophy and Senescence in Osteoarthritis Initiation and Progression.Int J Mol Sci. 2020 Mar 29;21(7):2358. doi: 10.3390/ijms21072358. Int J Mol Sci. 2020. PMID: 32235300 Free PMC article. Review.
-
Inflammation-Modulating Hydrogels for Osteoarthritis Cartilage Tissue Engineering.Cells. 2020 Feb 12;9(2):419. doi: 10.3390/cells9020419. Cells. 2020. PMID: 32059502 Free PMC article. Review.
Cited by
-
Klotho Protein: A Multifaceted Guardian of Healthy Aging and Its Therapeutic Potential.Int J Nanomedicine. 2025 Jun 9;20:7251-7270. doi: 10.2147/IJN.S514516. eCollection 2025. Int J Nanomedicine. 2025. PMID: 40520057 Free PMC article. Review.
-
Biomaterial-Based Nucleic Acid Delivery Systems for In Situ Tissue Engineering and Regenerative Medicine.Int J Mol Sci. 2025 Jul 30;26(15):7384. doi: 10.3390/ijms26157384. Int J Mol Sci. 2025. PMID: 40806513 Free PMC article. Review.
-
Inflammation-Induced Klotho Deficiency: A Possible Key Driver of Chronic Kidney Disease Progression.Int J Gen Med. 2025 May 11;18:2507-2520. doi: 10.2147/IJGM.S513497. eCollection 2025. Int J Gen Med. 2025. PMID: 40376197 Free PMC article. Review.
-
Therapeutic Potential of Tanshinones in Osteolytic Diseases: From Molecular and Cellular Pathways to Preclinical Models.Dent J (Basel). 2025 Jul 9;13(7):309. doi: 10.3390/dj13070309. Dent J (Basel). 2025. PMID: 40710154 Free PMC article. Review.
-
Engineering gene-activated bioprinted scaffolds for enhancing articular cartilage repair.Mater Today Bio. 2024 Nov 19;29:101351. doi: 10.1016/j.mtbio.2024.101351. eCollection 2024 Dec. Mater Today Bio. 2024. PMID: 39649247 Free PMC article. Review.
References
-
- Karsdal MA, Michaelis M, Ladel C, Siebuhr AS, Bihlet AR, Andersen JR, Guehring H, Christiansen C, Bay-Jensen AC, Kraus VB. Disease-modifying treatments for osteoarthritis (DMOADs) of the knee and hip: lessons learned from failures and opportunities for the future. Osteoarthritis Cartilage. 2016;24:2013–21. doi: 10.1016/j.joca.2016.07.017. - DOI - PubMed
MeSH terms
Substances
Grants and funding
- 81702152/the National Natural Science Foundation of China
- 81672185/the National Natural Science Foundation of China
- tsqn202211348/Taishan Scholars Program for Young Experts of Shandong Province
- ZR2023MH209/the Natural Science Foundation of Shandong Province
- ZR2022MH222/the Natural Science Foundation of Shandong Province
LinkOut - more resources
Full Text Sources
Medical
