. 2024 Jun 10;19(1):38.
doi: 10.1186/s40793-024-00579-0.

Coral microbiomes are structured by environmental gradients in deep waters

Affiliations

Coral microbiomes are structured by environmental gradients in deep waters

Samuel A Vohsen et al. Environ Microbiome. .

Abstract

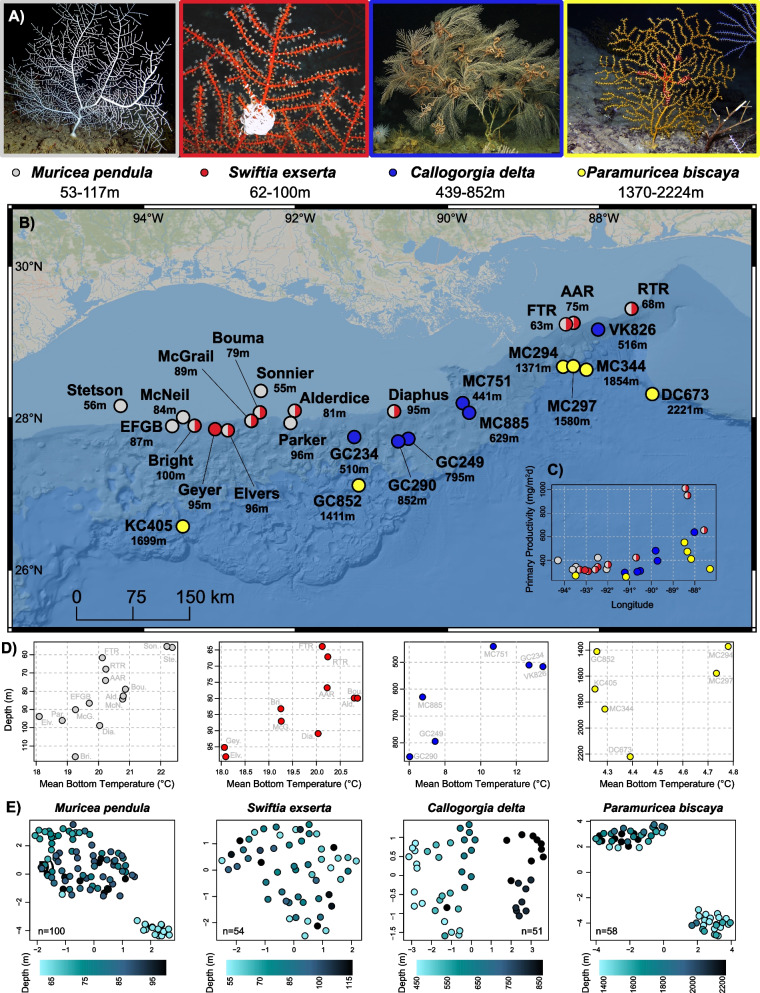
Background: Coral-associated microbiomes vary greatly between colonies and localities with functional consequences on the host. However, the full extent of variability across the ranges of most coral species remains unknown, especially for corals living in deep waters which span greater ranges. Here, we characterized the microbiomes of four octocoral species from mesophotic and bathyal deep-sea habitats in the northern Gulf of Mexico, Muricea pendula, Swiftia exserta, Callogorgia delta, and Paramuricea biscaya, using 16S rRNA gene metabarcoding. We sampled extensively across their ranges to test for microbiome differentiation between and within species, examining the influence of environmental factors that vary with depth (53-2224 m) and geographic location (over 680 m) as well as the host coral's genotype using RAD-sequencing.

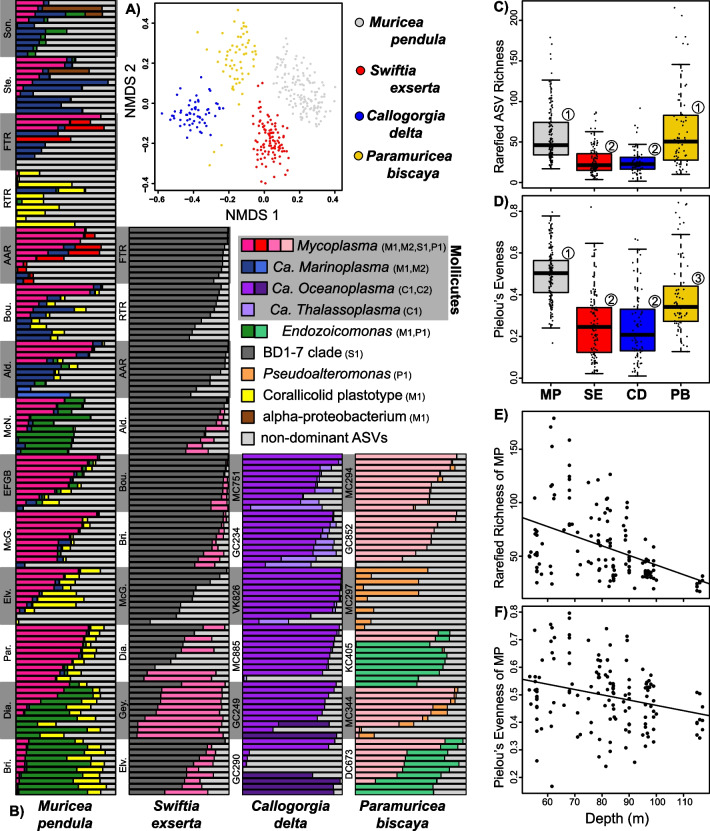
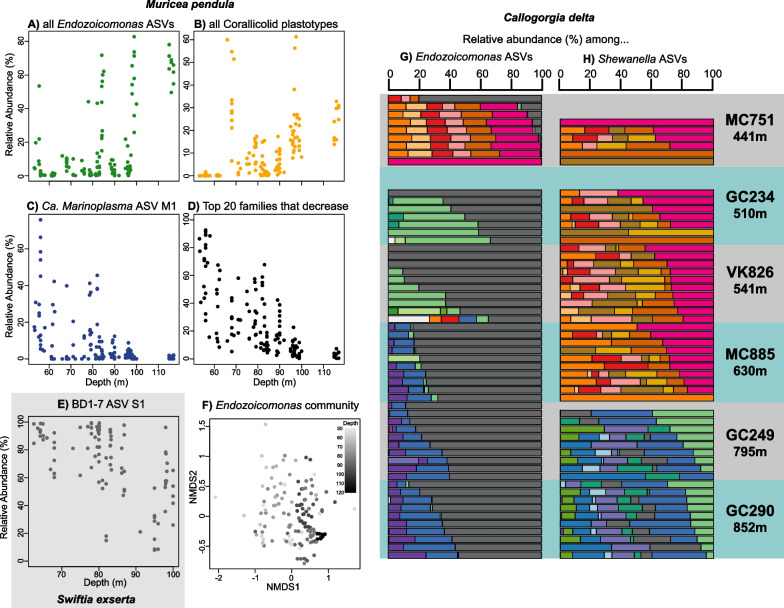
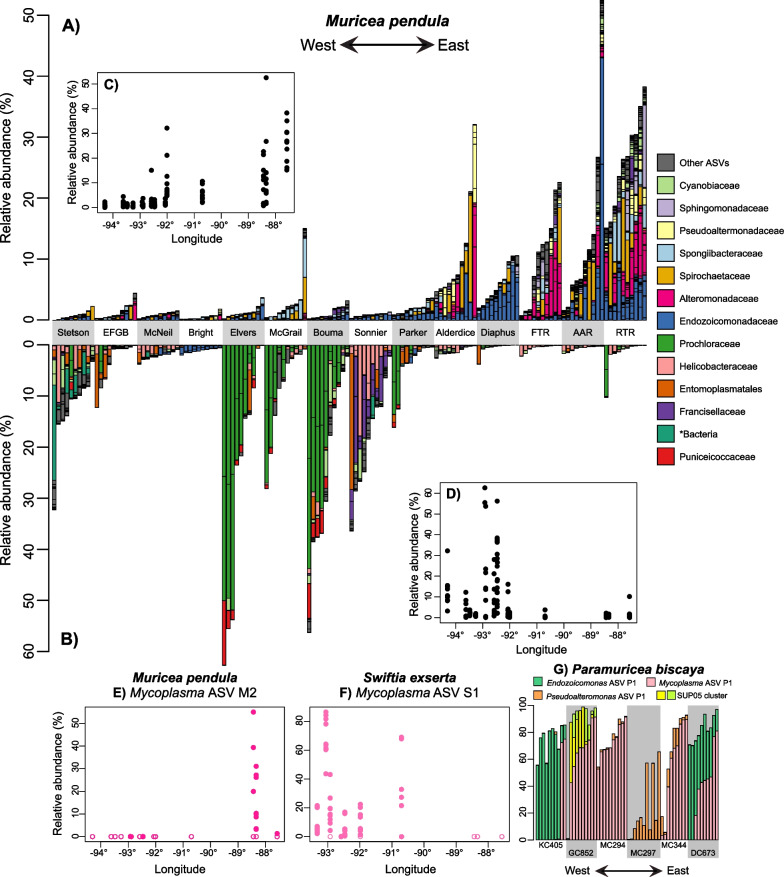
Results: Coral microbiomes were often dominated by amplicon sequence variants whose abundances varied across their hosts' ranges, including symbiotic taxa: corallicolids, Endozoicomonas, members of the Mollicutes, and the BD1-7 clade. Coral species, depth, and geographic location significantly affected diversity, microbial community composition, and the relative abundance of individual microbes. Depth was the strongest environmental factor determining microbiome structure within species, which influenced the abundance of most dominant symbiotic taxa. Differences in host genotype, bottom temperature, and surface primary productivity could explain a significant part of the microbiome variation associated with depth and geographic location.

Conclusions: Altogether, this work demonstrates that the microbiomes of corals in deep waters vary substantially across their ranges in accordance with depth and other environmental conditions. It reveals that the influence of depth on the ecology of mesophotic and deep-sea corals extends to its effects on their microbiomes which may have functional consequences. This work also identifies the distributions of microbes including potential parasites which can be used to inform restoration plans in response to the Deepwater Horizon oil spill.

Keywords: Deep-sea; Mesophotic; Microbial biogeography; Mycoplasma; Oceanoplasma; Seascape ecology.


Conflict of interest statement

The authors declare no competing interests.

Figures

Fig. 1
Fig. 1
Sampling sites and their environmental and coral genotypic makeup. A In situ images of the octocoral species in this study. B Geographic map displaying sampling locations in the Northern Gulf of Mexico (BOEM bathymetry). The mean depth of all samples from a site is reported next to each site name in meters. Sites are colored based on which coral species were sampled: light gray = Muricea pendula, red = Swiftia exserta, blue = Callogorgia delta, yellow = Paramuricea biscaya. Images of C. delta and P. biscaya courtesy of the ECOGIG consortium. C Surface primary productivity of each sampling site displayed across longitude and colored by coral species sampled therein. D Bottom seawater temperature for each sampling site displayed across depth for each coral species. E UMAP projections of the genetic background of coral colonies based on RADseq data. Each point represents the genotype of a coral colony and is colored by depth
Fig. 2
Fig. 2
Characterization of coral microbiomes. A Non-metric multidimensional scaling plot of microbiome compositions using Bray–Curtis dissimilarities of ASV proportions. B Barplots of dominant ASVs in each coral species. Each horizontal bar represents the relative abundance of ASVs in an individual coral colony which sum to 100%. Colonies are grouped by site which are sorted by depth. ASVs that comprised 50% or more in any sample are designated with different colors. All other ASVs are collapsed and shown in light gray. Ca. Oceanoplasma and Ca. Thalassoplasma were recently described by Vohsen et al. (2022). C Rarefied ASV richness and D Pielou’s evenness between different coral species. MP = Muricea pendula, SE = Swiftia exserta, CD = Callogorgia delta, PB = Paramuricea biscaya. E Rarefied ASV richness and F Pielou’s evenness in Muricea pendula with depth. Numbers over boxplots designate significantly different groups
Fig. 3
Fig. 3
Examples of depth patterns in coral microbiome composition. The relative abundances along depth in Muricea pendula of A the sum of all Endozoicomonas ASVs, B the sum of all corallicolid ASVs, C Ca. Marinoplasma ASV M1, D the sum of top 20 microbial families that decreased significantly with depth. E Relative abundance of BD1-7 ASV S1 with depth in Swiftia exserta. F NMDS ordination of Endozoicomonas communities in M. pendula showing patterns with depth. The community composition of G Endozoicomonas and H Shewanella communities in Callogorgia delta. Each horizontal bar is a single coral colony whose composition reflects the relative abundances of each ASV when restricted to only Endozoicomonas or Shewanella ASVs. Colors denote different ASVs. Colonies are arranged by site in order of increasing mean depth
Fig. 4
Fig. 4
Examples of geographic patterns in coral microbiome composition. Barplots of the relative abundance of microbial ASVs from Muricea pendula that A increased and B decreased from West to East across its range in the Northern Gulf of Mexico. ASVs are colored by family or other taxonomic level detailed in the legend. Each coral colony is represented by a vertical bar, and colonies are grouped by site sorted from westernmost to easternmost starting from the left. The total relative abundances of these ASVs are shown in C and D plotted against longitude to better reflect relative distances between sites. The relative abundance of E Mycoplasma ASV M1 in M. pendula and F Mycoplasma ASV S1 in S. exserta along longitude. Samples where zero reads were detected are represented with open circles. G Barplots showing the five most abundant ASVs that differed between sites in P. biscaya

Similar articles

Cited by

References

    1. Pollock FJ, McMinds R, Smith S, Bourne DG, Willis BL, Medina M, et al. Coral-associated bacteria demonstrate phylosymbiosis and cophylogeny. Nat Commun. 2018;9:4921. doi: 10.1038/s41467-018-07275-x. - DOI - PMC - PubMed
    1. Siboni N, Ben-Dov E, Sivan A, Kushmaro A. Global distribution and diversity of coral-associated Archaea and their possible role in the coral holobiont nitrogen cycle. Environ Microbiol. 2008;10:2979–2990. doi: 10.1111/j.1462-2920.2008.01718.x. - DOI - PubMed
    1. Wegley L, Yu Y, Breitbart M, Casas V, Kline DI, Rohwer F. Coral-associated archaea. Mar Ecol Prog Ser. 2004;273:89–96. doi: 10.3354/meps273089. - DOI
    1. Ainsworth T, Fordyce A, Camp E. The other microeukaryotes of the coral reef microbiome. Trends Microbiol. 2017;25:980–991. doi: 10.1016/j.tim.2017.06.007. - DOI - PubMed
    1. Thurber RV, Payet JP, Thurber AR, Correa A. Virus–host interactions and their roles in coral reef health and disease. Nat Rev Microbiol. 2017;15:205–216. doi: 10.1038/nrmicro.2016.176. - DOI - PubMed

LinkOut - more resources